Estimated zip code population in 2022: 9,503 Zip code population in 2010: 8,857 Zip code population in 2000: 8,680
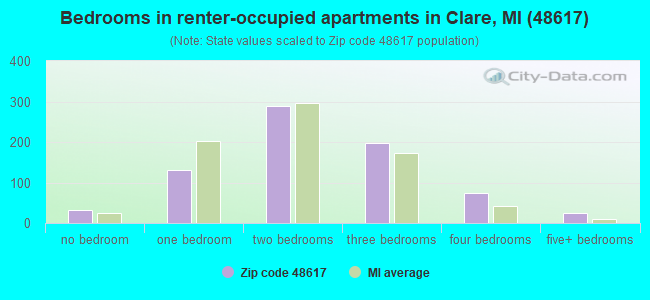
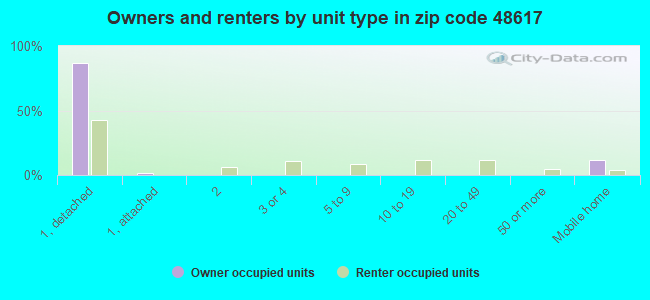
Houses and condos: 4,132 Renter-occupied apartments: 752
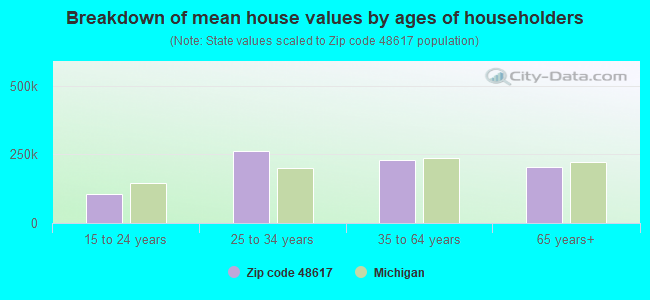
% of renters here:
22%
State:
27%
March 2022 cost of living index in zip code 48617: 81.2 (low, U.S. average is 100)
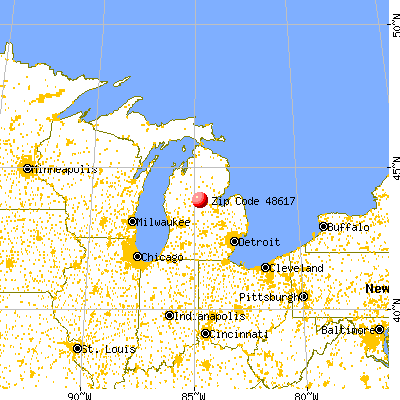
Land area: 138.6 sq. mi. Water area: 1.2 sq. mi.
Population density: 69 people per square mile
(very low).
OSM Map
General Map
Google Map
MSN Map
OSM Map
General Map
Google Map
MSN Map
OSM Map
General Map
Google Map
MSN Map
OSM Map
General Map
Google Map
MSN Map
Please wait while loading the map...
Real estate property taxes paid for housing units in 2022:
This zip code:
1.2% ($1,973)
Michigan:
1.2% ($2,746)
Median real estate property taxes paid for housing units with mortgages in 2022: $2,018 (1.2%) Median real estate property taxes paid for housing units with no mortgage in 2022: $1,929 (1.2%)
Averages for the 2020 tax year for zip code 48617, filed in 2021:
Average Adjusted Gross Income (AGI) in 2020: $53,525 (Individual Income Tax Returns)
Here:
$53,525
State:
$68,945
Salary/wage: $45,553 (reported on 73.4% of returns)
Here:
$45,553
State:
$57,142
(% of AGI for various income ranges: 969.5% for AGIs below $25k, 2998.3% for AGIs $25k-50k, 5911.5% for AGIs $50k-75k, 9023.8% for AGIs $75k-100k, 16047.3% for AGIs $100k-200k, 60465.0% for AGIs over 200k)
Taxable interest for individuals: $1,182 (reported on 28.1% of returns)
This zip code:
$1,182
Michigan:
$1,630
(% of AGI for various income ranges: 19.2% for AGIs below $25k, 30.0% for AGIs $25k-50k, 32.3% for AGIs $50k-75k, 57.1% for AGIs $75k-100k, 136.9% for AGIs $100k-200k, 1360.0% for AGIs over 200k)
Ordinary dividends: $5,286 (reported on 14.8% of returns)
Here:
$5,286
State:
$6,972
(% of AGI for various income ranges: 23.1% for AGIs below $25k, 42.7% for AGIs $25k-50k, 82.6% for AGIs $50k-75k, 173.3% for AGIs $75k-100k, 522.3% for AGIs $100k-200k, 2135.0% for AGIs over 200k)
Net capital gain/loss in AGI: +$8,463 (reported on 13.8% of returns)
Here:
+$8,463
State:
+$20,064
(% of AGI for various income ranges: 19.0% for AGIs below $25k, 39.5% for AGIs $25k-50k, 75.1% for AGIs $50k-75k, 317.1% for AGIs $75k-100k, 430.0% for AGIs $100k-200k, 9585.0% for AGIs over 200k)
Profit/loss from business: +$18,770 (reported on 17.6% of returns)
Here:
+$18,770
State:
+$11,172
(% of AGI for various income ranges: 158.1% for AGIs below $25k, 368.3% for AGIs $25k-50k, 407.4% for AGIs $50k-75k, 731.7% for AGIs $75k-100k, 1086.2% for AGIs $100k-200k, 12350.0% for AGIs over 200k)
Taxable individual retirement arrangement distribution: $12,762 (reported on 9.5% of returns)
48617:
$12,762
Michigan:
$19,803
(% of AGI for various income ranges: 56.6% for AGIs below $25k, 98.2% for AGIs $25k-50k, 214.1% for AGIs $50k-75k, 350.8% for AGIs $75k-100k, 678.5% for AGIs $100k-200k)
Total itemized deductions: $48,288 (reported on 2.0% of returns)
Here:
$48,288
State:
$34,117
(% of AGI for various income ranges: 189.5% for AGIs $50k-75k, 403.1% for AGIs $100k-200k, 10380.0% for AGIs over 200k)
Charity contributions: $28,057 (reported on 1.8% of returns)
Here:
$28,057
State:
$13,548
(% of AGI for various income ranges: 15.4% for AGIs $25k-50k, 135.8% for AGIs $100k-200k, 7455.0% for AGIs over 200k)
Taxes paid: $8,288 (reported on 2.0% of returns)
48617:
$8,288
State:
$7,972
(% of AGI for various income ranges: 40.3% for AGIs $50k-75k, 106.5% for AGIs $100k-200k, 1145.0% for AGIs over 200k)
Earned income credit: $2,130 (reported on 15.3% of returns)
Here:
$2,130
State:
$2,251
(% of AGI for various income ranges: 78.8% for AGIs below $25k, 71.9% for AGIs $25k-50k)
Percentage of individuals using paid preparers for their 2020 taxes: 93.9%
Here:
94%
State:
93%
(% for various income ranges: 92.8% for AGIs below $25k, 93.3% for AGIs $25k-50k, 94.6% for AGIs $50k-75k, 94.6% for AGIs $75k-100k, 97.8% for AGIs $100k-200k, 87.5% for AGIs over 200k)
Averages for the 2012 tax year for zip code 48617, filed in 2013:
Average Adjusted Gross Income (AGI) in 2012: $41,836 (Individual Income Tax Returns)
Here:
$41,836
State:
$55,609
Salary/wage: $36,407 (reported on 77.5% of returns)
Here:
$36,407
State:
$46,782
(% of AGI for various income ranges: 65.3% for AGIs below $25k, 72.1% for AGIs $25k-50k, 72.2% for AGIs $50k-75k, 70.2% for AGIs $75k-100k, 71.7% for AGIs $100k-200k, 38.1% for AGIs over 200k)
Taxable interest for individuals: $1,304 (reported on 30.8% of returns)
This zip code:
$1,304
Michigan:
$1,491
(% of AGI for various income ranges: 1.3% for AGIs below $25k, 1.0% for AGIs $25k-50k, 0.5% for AGIs $50k-75k, 1.0% for AGIs $75k-100k, 1.0% for AGIs $100k-200k, 1.1% for AGIs over 200k)
Ordinary dividends: $3,384 (reported on 16.2% of returns)
Here:
$3,384
State:
$6,225
(% of AGI for various income ranges: 1.2% for AGIs below $25k, 0.9% for AGIs $25k-50k, 1.0% for AGIs $50k-75k, 2.0% for AGIs $75k-100k, 1.6% for AGIs $100k-200k, 1.0% for AGIs over 200k)
Net capital gain/loss in AGI: +$4,052 (reported on 12.7% of returns)
Here:
+$4,052
State:
+$9,326
(% of AGI for various income ranges: 0.3% for AGIs below $25k, 0.9% for AGIs $25k-50k, 0.7% for AGIs $50k-75k, 1.5% for AGIs $75k-100k, 2.7% for AGIs $100k-200k, 0.7% for AGIs over 200k)
Profit/loss from business: +$12,506 (reported on 16.4% of returns)
Here:
+$12,506
State:
+$11,523
(% of AGI for various income ranges: 8.7% for AGIs below $25k, 4.9% for AGIs $25k-50k, 3.3% for AGIs $50k-75k, 4.0% for AGIs $75k-100k, 7.1% for AGIs $100k-200k)
Taxable individual retirement arrangement distribution: $10,003 (reported on 10.3% of returns)
48617:
$10,003
Michigan:
$15,298
(% of AGI for various income ranges: 2.8% for AGIs below $25k, 1.7% for AGIs $25k-50k, 3.4% for AGIs $50k-75k, 3.6% for AGIs $75k-100k, 2.4% for AGIs $100k-200k)
Total itemized deductions: $22,184 (24% of AGI, reported on 17.8% of returns)
Here:
$22,184
State:
$21,628
Here:
23.6% of AGI
State:
18.4% of AGI
(% of AGI for various income ranges: 3.7% for AGIs below $25k, 5.4% for AGIs $25k-50k, 7.7% for AGIs $50k-75k, 8.1% for AGIs $75k-100k, 12.8% for AGIs $100k-200k, 23.4% for AGIs over 200k)
Charity contributions: $4,916 (reported on 13.5% of returns)
Here:
$4,916
State:
$4,225
(% of AGI for various income ranges: 0.4% for AGIs below $25k, 0.7% for AGIs $25k-50k, 1.1% for AGIs $50k-75k, 1.0% for AGIs $75k-100k, 2.2% for AGIs $100k-200k, 5.7% for AGIs over 200k)
Taxes paid: $6,072 (reported on 17.8% of returns)
48617:
$6,072
State:
$8,327
(% of AGI for various income ranges: 0.6% for AGIs below $25k, 1.3% for AGIs $25k-50k, 2.0% for AGIs $50k-75k, 2.5% for AGIs $75k-100k, 4.4% for AGIs $100k-200k, 5.1% for AGIs over 200k)
Earned income credit: $2,239 (reported on 20.4% of returns)
Here:
$2,239
State:
$2,306
(% of AGI for various income ranges: 6.3% for AGIs below $25k, 1.3% for AGIs $25k-50k)
Percentage of individuals using paid preparers for their 2012 taxes: 66.3%
Here:
66%
State:
57%
(% for various income ranges: 62.9% for AGIs below $25k, 66.7% for AGIs $25k-50k, 69.6% for AGIs $50k-75k, 74.2% for AGIs $75k-100k, 70.4% for AGIs $100k-200k, 80.0% for AGIs over 200k)
Averages for the 2004 tax year for zip code 48617, filed in 2005:
Average Adjusted Gross Income (AGI) in 2004: $35,382 (Individual Income Tax Returns)
Here:
$35,382
State:
$48,204
Salary/wage: $32,356 (reported on 80.4% of returns)
Here:
$32,356
State:
$42,791
(% of AGI for various income ranges: 120.6% for AGIs below $10k, 68.4% for AGIs $10k-25k, 75.8% for AGIs $25k-50k, 79.3% for AGIs $50k-75k, 75.0% for AGIs $75k-100k, 63.4% for AGIs over 100k)
Taxable interest for individuals: $1,275 (reported on 42.2% of returns)
This zip code:
$1,275
Michigan:
$1,725
(% of AGI for various income ranges: 7.6% for AGIs below $10k, 2.2% for AGIs $10k-25k, 1.9% for AGIs $25k-50k, 1.0% for AGIs $50k-75k, 1.2% for AGIs $75k-100k, 0.9% for AGIs over 100k)
Taxable dividends: $3,218 (reported on 19.8% of returns)
Here:
$3,218
State:
$3,420
(% of AGI for various income ranges: 4.4% for AGIs below $10k, 1.8% for AGIs $10k-25k, 0.9% for AGIs $25k-50k, 1.3% for AGIs $50k-75k, 1.0% for AGIs $75k-100k, 3.6% for AGIs over 100k)
Net capital gain/loss: +$4,829 (reported on 15.9% of returns)
Here:
+$4,829
State:
+$8,532
(% of AGI for various income ranges: 3.2% for AGIs below $10k, 1.6% for AGIs $10k-25k, 2.0% for AGIs $25k-50k, 0.0% for AGIs $50k-75k, 2.1% for AGIs $75k-100k, 4.7% for AGIs over 100k)
Profit/loss from business: +$8,566 (reported on 17.4% of returns)
Here:
+$8,566
State:
+$9,547
(% of AGI for various income ranges: 11.5% for AGIs below $10k, 5.8% for AGIs $10k-25k, 4.6% for AGIs $25k-50k, 1.9% for AGIs $50k-75k, 3.6% for AGIs $75k-100k, 4.8% for AGIs over 100k)
IRA payment deduction: $2,901 (reported on 2.2% of returns)
48617:
$2,901
Michigan:
$2,875
(% of AGI for various income ranges: 0.2% for AGIs $10k-25k, 0.2% for AGIs $25k-50k, 0.3% for AGIs $50k-75k, 0.2% for AGIs over 100k)
Self-employed pension: $13,286 (reported on 0.4% of returns)
Here:
$13,286
Michigan:
$13,826
Total itemized deductions: $16,119 (22% of AGI, reported on 21.6% of returns)
Here:
$16,119
State:
$18,509
Here:
22.0% of AGI
State:
20.7% of AGI
(% of AGI for various income ranges: 14.7% for AGIs below $10k, 6.7% for AGIs $10k-25k, 7.5% for AGIs $25k-50k, 9.3% for AGIs $50k-75k, 11.2% for AGIs $75k-100k, 13.3% for AGIs over 100k)
Charity contributions deductions: $3,357 (4% of AGI, reported on 17.4% of returns)
Here:
$3,357
State:
$3,365
Here:
4.2% of AGI
State:
3.6% of AGI
(% of AGI for various income ranges: 1.0% for AGIs below $10k, 0.7% for AGIs $10k-25k, 0.8% for AGIs $25k-50k, 1.2% for AGIs $50k-75k, 1.9% for AGIs $75k-100k, 3.5% for AGIs over 100k)
Total tax: $4,652 (reported on 70.7% of returns)
48617:
$4,652
State:
$7,691
(% of AGI for various income ranges: 5.3% for AGIs below $10k, 3.9% for AGIs $10k-25k, 6.3% for AGIs $25k-50k, 8.3% for AGIs $50k-75k, 10.0% for AGIs $75k-100k, 16.4% for AGIs over 100k)
Earned income credit: $1,647 (reported on 17.7% of returns)
Here:
$1,647
State:
$1,737
Percentage of individuals using paid preparers for their 2004 taxes: 68.8%
Here:
69%
State:
60%
(% for various income ranges: 61.1% for AGIs below $10k, 72.1% for AGIs $10k-25k, 69.3% for AGIs $25k-50k, 70.2% for AGIs $50k-75k, 69.5% for AGIs $75k-100k, 81.1% for AGIs over 100k)
Household received Food Stamps/SNAP in the past 12 months: 565 Household did not receive Food Stamps/SNAP in the past 12 months: 2,881
Women who had a birth in the past 12 months: 105 (54 now married, 49 unmarried) Women who did not have a birth in the past 12 months: 1,905 (957 now married, 944 unmarried)
Housing units in zip code 48617 with a mortgage: 1,414 (103 second mortgage, 11 home equity loan, 74 both second mortgage and home equity loan) Houses without a mortgage: 15
Median monthly owner costs for units with a mortgage: $1,184 Median monthly owner costs for units without a mortgage: $507
Residents with income below the poverty level in 2022:
This zip code:
16.9%
Whole state:
13.4%
Residents with income below 50% of the poverty level in 2022:
This zip code:
10.5%
Whole state:
6.9%
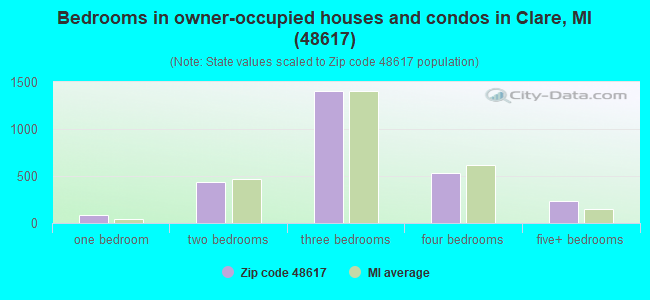
Median number of rooms in houses and condos:
Here:
6.7
State:
6.5
Median number of rooms in apartments:
Here:
4.5
State:
4.3
Notable locations in this zip code not listed on our city pages
Notable locations in zip code 48617: Firefly Golf Links (A), Browns Corners (B), Camp Rotary (C), Snow Snake Golf Course (D), Mobile Medical Response Station 31 (E), Clare Welcome Center (F), Arthur Township Hall (G), Sheridan Township Hall (H), Clare Police Department (I), Clare Fire Department (J), Clare City Hall (K), Clare County Historical Society and Museum (L), Garfield Memorial Library (M), Charles A Amble Library (N). Display/hide their locations on the map
Churches in zip code 48617 include: Eagle Church (A), Colonville Bible Church (B), Grace Bible Church (C), Jehovah's Witnesses Clare (D), First Baptist Church of Clare (E), Saint John Evangelical Lutheran Church (F), Clare United Methodist Church (G), Old Time Missionary Baptist Church (H), Clare Christ Fellowship Church (I). Display/hide their locations on the map
Cemeteries: Saint Cecilia Cemetery (1), Cherry Grave Cemetery (2), Vernon Township Cemetery (3), Thompson Cemetery (4), Wood Cemetery (5), Wise Cemetery (6). Display/hide their locations on the map
Lakes: Marshall Lake (A), Owens Lake (B), West Trout Lake (C), Mud Lake (D), Lake Shamrock (E), Shively Lake (F), Lake Enola (G), East Trout Lake (H). Display/hide their locations on the map
Creeks: Bailey Creek (A), Five Lakes Creek (B), Spike Horn Creek (C), Carrow Creek (D), Sanford Creek (E), Clear Creek (F), McCuran Creek (G). Display/hide their locations on the map
Parks in zip code 48617 include: Pettit Park (1), Brookwood Park (2), Grant Township Park (3), Herrick Recreation Area (4), Barnes Island Park (5), Stamina Stadium Park (6), Shamrock Park (7), Clare City Park (8), Gerrish Railroad Roadside Park (9). Display/hide their locations on the map
In group quarters: 107 (-1 institutionalized population)
Size of family households: 1,032 2-persons, 365 3-persons, 340 4-persons, 169 5-persons, 161 6-persons, 119 7-or-more-persons
Size of nonfamily households: 1,090 1-person, 161 2-persons
1,879 married couples with children.
366 single-parent households (74 men, 292 women).
85.5% of residents of 48617 zip code speak English at home.
0.6% of residents speak Spanish at home (94% very well, 6% well).
13.5% of residents speak other Indo-European language at home (81% very well, 10% well, 6% not well, 3% not at all).
0.1% of residents speak Asian or Pacific Island language at home (73% very well, 27% well).
0.4% of residents speak other language at home (59% very well, 41% well).
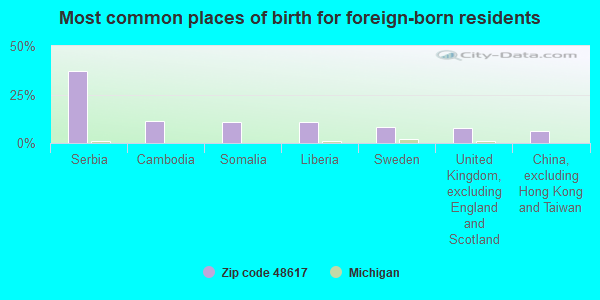
Foreign born population: 166 (1.8%) (67.4% of them are naturalized citizens)
This zip code:
1.8%
Whole state:
6.9%
37%Serbia
11%Cambodia
11%Somalia
11%Liberia
8%Sweden
8%United Kingdom, excluding England and Scotland
6%China, excluding Hong Kong and Taiwan
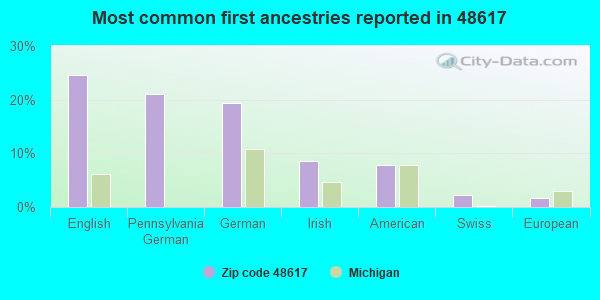
25%English
21%Pennsylvania German
19%German
9%Irish
8%American
2%Swiss
2%European
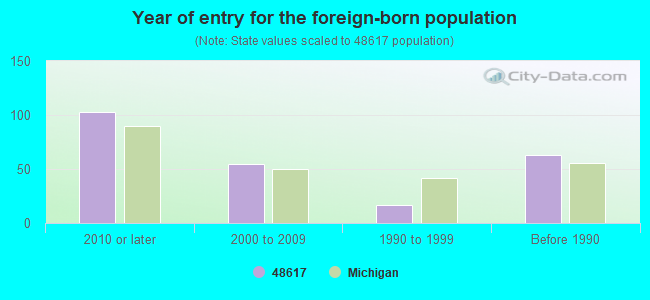
Year of entry for the foreign-born population
1032010 or later
552000 to 2009
171990 to 1999
63Before 1990
Major facilities with environmental interests located in this zip code:
AMOCO OIL CO (10197 S CLARE AVE in CLARE, MI)
(Resource Conservation and Recovery Act (tracking hazardous waste)) Organizations: AMOCO OIL COMPANY (CONTACT/OWNER)
Alternative names: AMOCO OIL CO 7042 CLARE
MI DEPT/TRANSPORTATION BRIDGE (US-27 OVER BUS RTE 27 in CLARE, MI)
(Resource Conservation and Recovery Act (tracking hazardous waste)) Organizations: MICH DEPT OF TRANSPORTATION (CONTACT/OPERATOR)
Alternative names: MIDOT BRIDGE US-27 OVER BUS 27
MI DEPT/TRANSPORTATION BRIDGE (US-10 OVER EBERHART RD in CLARE, MI)
(Resource Conservation and Recovery Act (tracking hazardous waste)) Organizations: MICH DEPT OF TRANSPORTATION (CONTACT/OPERATOR)
Alternative names: MIDOT BRIDGE US-10 OVER EBERHART RD
MI DEPT/TRANSPORTATION BRIDGE B01 B02-18 (US-27 OVER S BR TOBACCO RIVER in CLARE, MI)
(Resource Conservation and Recovery Act (tracking hazardous waste)) Organizations: MICH DEPT OF TRANSPORTAION (CONTACT/OPERATOR)
Alternative names: MIDOT BRIDGE US-27 OVER S BR TABACC0 RIV
Housing units lacking complete plumbing facilities: 0.5% Housing units lacking complete kitchen facilities: 1.5%
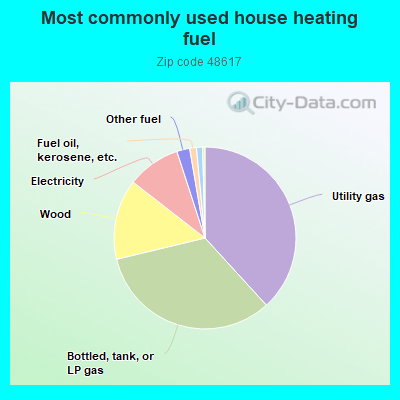
38.3%Utility gas
33.1%Bottled, tank, or LP gas
14.3%Wood
9.5%Electricity
2.3%Other fuel
1.2%Fuel oil, kerosene, etc.
1.1%No fuel used
Population in 1990: 6,635. Population change in the 1990s: +2,045 (+30.8%).
Place of birth for U.S.-born residents:
This state: 7,778
Northeast: 129
Midwest: 823
South: 441
West: 83
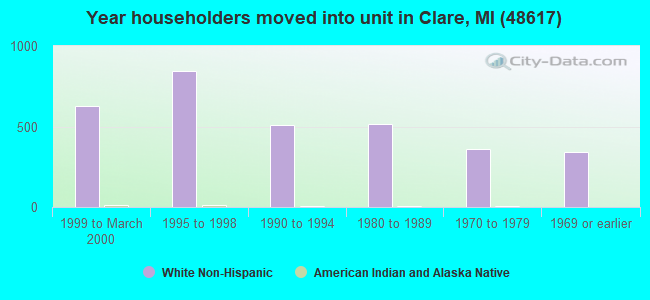
57% of the 48617 zip code residents lived in the same house 5 years ago. Out of people who lived in different houses, 51% lived in this county. Out of people who lived in different counties, 50% lived in Michigan.
91% of the 48617 zip code residents lived in the same house 1 year ago. Out of people who lived in different houses, 40% moved from this county. Out of people who lived in different houses, 49% moved from different county within same state. Out of people who lived in different houses, 11% moved from different state.
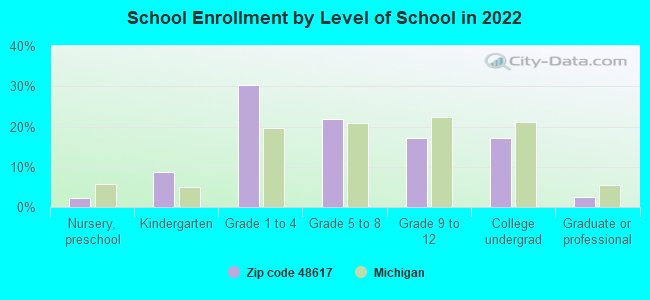
Private vs. public school enrollment:
Students in private schools in grades 1 to 8 (elementary and middle school): 196
Here:
18.9%
Michigan:
12.4%
Students in private schools in grades 9 to 12 (high school): 32
Here:
9.6%
Michigan:
9.8%
Students in private undergraduate colleges: 2
Here:
0.7%
Michigan:
14.9%
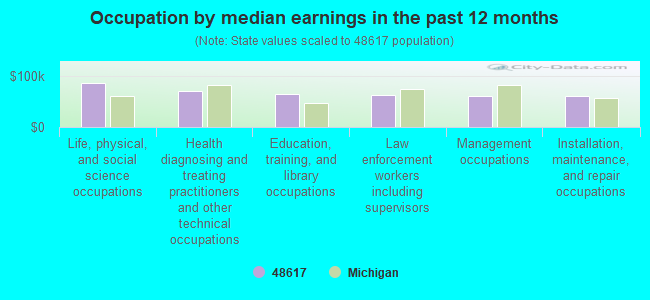
Occupation by median earnings in the past 12 months ($)
85,659Life, physical, and social science occupations
69,207Health diagnosing and treating practitioners and other technical occupations
64,012Education, training, and library occupations
63,216Law enforcement workers including supervisors
60,172Management occupations
59,599Installation, maintenance, and repair occupations
Companies with federal contracts located in this zip code:
STAGERIGHT CORPORATION (495 PIONEER PKWY in CLARE, MI; small business) : $62,667 in 5 contractsfrom 2004 to 2006
Contracts for Miscellaneous Furniture and Fixtures by Air Force, Indian Affairs (Assistant Secretary) Signed by year:2000: $0; 2001: $0; 2002: $0; 2003: $0; 2004: $20,830; 2005: $33,957; 2006: $7,880.
Biggest contracts:
$33,957 with Air Force for Miscellaneous Furniture and Fixtures. Signed on 2005-09-26. Completion date: 2005-12-12.
$20,830 with Indian Affairs (Assistant Secretary) for Miscellaneous Furniture and Fixtures. Taking place in AZ. Signed on 2004-06-30. Completion date: 2004-09-30.
$6,638 with Air Force for Miscellaneous Furniture and Fixtures. Signed on 2006-05-23. Completion date: 2006-07-25.
$1,242, same as above.Signed on 2006-04-21. Completion date: 2006-05-30.
Top industries in this zip code by the number of employees in 2005:
Administrative and Support and Waste Management and Remediation Services: Professional Employer Organizations (100-249 employees: 1 establishment, 50-99 employees: 1 establishment)
Accommodation and Food Services: Hotels (except Casino Hotels) and Motels (100-249: 1, 20-49: 1, 1-4: 1)
Health Care and Social Assistance: Other Individual and Family Services (100-249: 1)
Health Care and Social Assistance: Nursing Care Facilities (100-249: 1)
Accommodation and Food Services: Limited-Service Restaurants (20-49: 4, 10-19: 1)
101 people in nursing facilities/skilled-nursing facilities
26 people in group homes intended for adults
6 people in group homes for juveniles (non-correctional)
2 people in workers' group living quarters and job corps centers
People in group quarters in 2000:
94 people in nursing homes
30 people in agriculture workers' dormitories on farms
20 people in other noninstitutional group quarters
19 people in other group homes
17 people in homes for the mentally retarded
8 people in unknown juvenile institutions
Fatal accident statistics in 2014:
Fatal accident count: 2
Vehicles involved in fatal accidents: 2
Fatal accidents caused by drunken drivers: 1
Fatalities: 2
Persons involved in fatal accidents: 2
Pedestrians involved in fatal accidents: 0
Fatal accident statistics in 2013:
Fatal accident count: 1
Vehicles involved in fatal accidents: 1
Fatal accidents caused by drunken drivers: 1
Fatalities: 1
Persons involved in fatal accidents: 1
Pedestrians involved in fatal accidents: 0
2002 - 2018 National Fire Incident Reporting System (NFIRS) incidents
Based on the data from the years 2002 - 2018 the average number of fires per year is 41. The highest number of fires - 69 took place in 2003, and the least - 2 in 2004. The data has a growing trend.
When looking into fire subcategories, the most reports belonged to: Structure Fires (43.1%), and Outside Fires (35.7%).
Fire incident types reported to NFIRS in Zip Code 48617


 Nearest zip codes: 48878, 48622, 48618, 48633, 48625, 48858.


 Based on the data from the years 2002 - 2018 the average number of fires per year is 41. The highest number of fires - 69 took place in 2003, and the least - 2 in 2004. The data has a growing trend.
 When looking into fire subcategories, the most reports belonged to: Structure Fires (43.1%), and Outside Fires (35.7%).