Estimated zip code population in 2022: 1,969 Zip code population in 2010: 1,548 Zip code population in 2000: 1,520
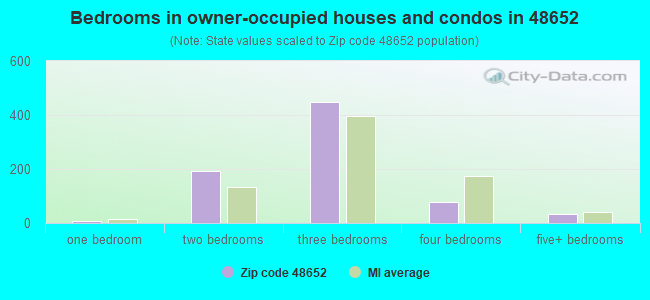
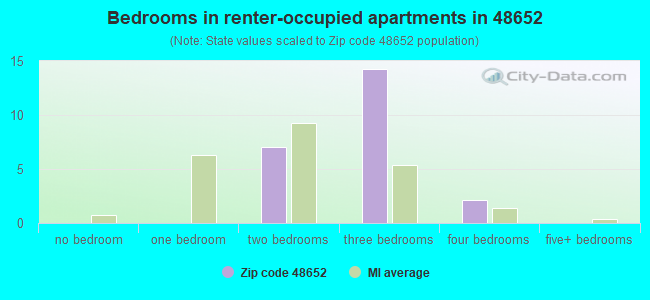
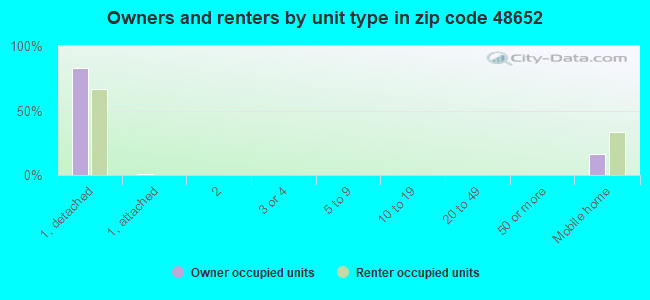
Houses and condos: 801 Renter-occupied apartments: 23
% of renters here:
3%
State:
27%
March 2022 cost of living index in zip code 48652: 81.1 (low, U.S. average is 100)
Land area: 53.5 sq. mi. Water area: 1.2 sq. mi.
Population density: 37 people per square mile
(very low).
OSM Map
General Map
Google Map
MSN Map
OSM Map
General Map
Google Map
MSN Map
OSM Map
General Map
Google Map
MSN Map
OSM Map
General Map
Google Map
MSN Map
Please wait while loading the map...
Real estate property taxes paid for housing units in 2022:
This zip code:
1.2% ($1,968)
Michigan:
1.2% ($2,746)
Median real estate property taxes paid for housing units with mortgages in 2022: $2,128 (1.1%) Median real estate property taxes paid for housing units with no mortgage in 2022: $1,815 (1.4%)
Business Search- 14 Million verified businesses
Males: 1,018
(51.7%)
Females: 951
(48.3%)
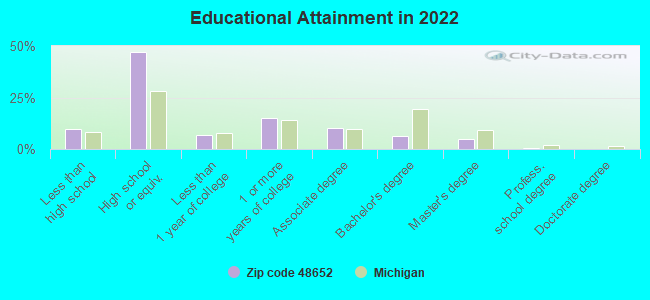
For population 25 years and over in 48652:
High school or higher: 89.3%
Bachelor's degree or higher: 11.6%
Graduate or professional degree: 5.2%
Unemployed: 2.9%
Mean travel time to work (commute): 36.9 minutes
For population 15 years and over in 48652:
Never married: 25.8%
Now married: 58.0%
Separated: 0.1%
Widowed: 5.7%
Divorced: 10.5%
Zip code 48652 compared to state average:
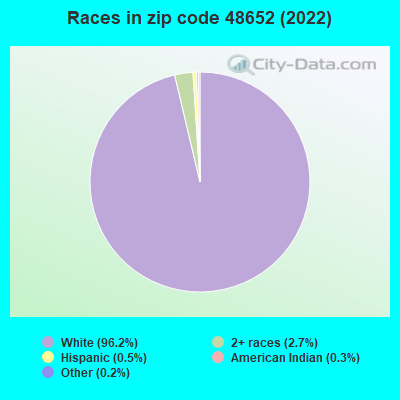
Black race population percentage significantly below state average.
Hispanic race population percentage significantly below state average.
Median age above state average.
Foreign-born population percentage significantly below state average.
Renting percentage significantly below state average.
Length of stay since moving in significantly above state average.
House age below state average.
Percentage of population with a bachelor's degree or higher significantly below state average.
Estimated median house/condo value in 2022: $167,826
48652:
$167,826
Michigan:
$224,400
According to our research of Michigan and other state lists, there were 5 registered sex offenders living in 48652 zip code as of May 28, 2024. The ratio of all residents to sex offenders in zip code 48652 is 340 to 1. The ratio of registered sex offenders to all residents in this zip code is near the state average.
Median resident age:
This zip code:
45.0 years
Michigan median age:
40.3 years
Average household size:
This zip code:
2.5 people
Michigan:
2.4 people
Averages for the 2020 tax year for zip code 48652, filed in 2021:
Average Adjusted Gross Income (AGI) in 2020: $50,342 (Individual Income Tax Returns)
Here:
$50,342
State:
$68,945
Salary/wage: $50,315 (reported on 75.3% of returns)
Here:
$50,315
State:
$57,142
(% of AGI for various income ranges: 837.4% for AGIs below $25k, 3308.8% for AGIs $25k-50k, 5433.6% for AGIs $50k-75k, 8821.7% for AGIs $75k-100k, 17437.1% for AGIs $100k-200k)
Taxable interest for individuals: $508 (reported on 29.6% of returns)
This zip code:
$508
Michigan:
$1,630
(% of AGI for various income ranges: 13.2% for AGIs below $25k, 22.9% for AGIs $25k-50k, 8.2% for AGIs $50k-75k, 5.0% for AGIs $75k-100k, 65.7% for AGIs $100k-200k)
Ordinary dividends: $1,422 (reported on 11.1% of returns)
Here:
$1,422
State:
$6,972
(% of AGI for various income ranges: 26.8% for AGIs below $25k, 12.9% for AGIs $25k-50k, 11.8% for AGIs $50k-75k, 60.0% for AGIs $100k-200k)
Net capital gain/loss in AGI: +$3,129 (reported on 8.6% of returns)
Here:
+$3,129
State:
+$20,064
(% of AGI for various income ranges: 7.6% for AGIs $25k-50k, 294.3% for AGIs $100k-200k)
Profit/loss from business: +$6,422 (reported on 11.1% of returns)
Here:
+$6,422
State:
+$11,172
(% of AGI for various income ranges: 132.6% for AGIs below $25k, 199.1% for AGIs $50k-75k, 178.3% for AGIs $75k-100k)
Taxable individual retirement arrangement distribution: $9,543 (reported on 8.6% of returns)
48652:
$9,543
Michigan:
$19,803
(% of AGI for various income ranges: 164.7% for AGIs below $25k, 322.7% for AGIs $50k-75k)
Earned income credit: $1,692 (reported on 14.8% of returns)
Here:
$1,692
State:
$2,251
(% of AGI for various income ranges: 57.4% for AGIs below $25k, 55.3% for AGIs $25k-50k)
Percentage of individuals using paid preparers for their 2020 taxes: 92.6%
Here:
93%
State:
93%
(% for various income ranges: 89.3% for AGIs below $25k, 95.5% for AGIs $25k-50k, 92.3% for AGIs $50k-75k, 87.5% for AGIs $75k-100k, 100.0% for AGIs $100k-200k)
Averages for the 2012 tax year for zip code 48652, filed in 2013:
Average Adjusted Gross Income (AGI) in 2012: $42,466 (Individual Income Tax Returns)
Here:
$42,466
State:
$55,609
Salary/wage: $37,991 (reported on 84.4% of returns)
Here:
$37,991
State:
$46,782
(% of AGI for various income ranges: 65.6% for AGIs below $25k, 71.4% for AGIs $25k-50k, 81.2% for AGIs $50k-75k, 75.1% for AGIs $75k-100k, 78.5% for AGIs $100k-200k)
Taxable interest for individuals: $500 (reported on 35.1% of returns)
This zip code:
$500
Michigan:
$1,491
(% of AGI for various income ranges: 1.4% for AGIs below $25k, 0.6% for AGIs $25k-50k, 0.3% for AGIs $50k-75k, 0.1% for AGIs $75k-100k, 0.1% for AGIs $100k-200k)
Ordinary dividends: $1,110 (reported on 13.0% of returns)
Here:
$1,110
State:
$6,225
(% of AGI for various income ranges: 0.7% for AGIs below $25k, 0.6% for AGIs $25k-50k, 0.3% for AGIs $50k-75k, 0.3% for AGIs $100k-200k)
Profit/loss from business: +$3,450 (reported on 10.4% of returns)
Here:
+$3,450
State:
+$11,523
Taxable individual retirement arrangement distribution: $10,983 (reported on 7.8% of returns)
48652:
$10,983
Michigan:
$15,298
Total itemized deductions: $17,747 (23% of AGI, reported on 24.7% of returns)
Here:
$17,747
State:
$21,628
Here:
22.8% of AGI
State:
18.4% of AGI
(% of AGI for various income ranges: 9.7% for AGIs $25k-50k, 10.8% for AGIs $50k-75k, 12.9% for AGIs $75k-100k, 13.2% for AGIs $100k-200k)
Charity contributions: $2,000 (reported on 16.9% of returns)
Here:
$2,000
State:
$4,225
(% of AGI for various income ranges: 0.7% for AGIs $25k-50k, 0.5% for AGIs $50k-75k, 0.8% for AGIs $75k-100k, 1.4% for AGIs $100k-200k)
Taxes paid: $5,384 (reported on 24.7% of returns)
48652:
$5,384
State:
$8,327
(% of AGI for various income ranges: 1.9% for AGIs $25k-50k, 2.9% for AGIs $50k-75k, 3.5% for AGIs $75k-100k, 5.6% for AGIs $100k-200k)
Earned income credit: $1,838 (reported on 20.8% of returns)
Here:
$1,838
State:
$2,306
(% of AGI for various income ranges: 5.5% for AGIs below $25k, 1.2% for AGIs $25k-50k)
Percentage of individuals using paid preparers for their 2012 taxes: 63.6%
Here:
64%
State:
57%
(% for various income ranges: 56.2% for AGIs below $25k, 68.4% for AGIs $25k-50k, 69.2% for AGIs $50k-75k, 71.4% for AGIs $75k-100k, 66.7% for AGIs $100k-200k)
Averages for the 2004 tax year for zip code 48652, filed in 2005:
Average Adjusted Gross Income (AGI) in 2004: $34,151 (Individual Income Tax Returns)
Here:
$34,151
State:
$48,204
Salary/wage: $31,271 (reported on 85.9% of returns)
Here:
$31,271
State:
$42,791
(% of AGI for various income ranges: 75.9% for AGIs below $10k, 68.6% for AGIs $10k-25k, 72.5% for AGIs $25k-50k, 87.7% for AGIs $50k-75k, 90.2% for AGIs $75k-100k, 69.6% for AGIs over 100k)
Taxable interest for individuals: $736 (reported on 42.7% of returns)
This zip code:
$736
Michigan:
$1,725
(% of AGI for various income ranges: 3.3% for AGIs below $10k, 2.1% for AGIs $10k-25k, 1.3% for AGIs $25k-50k, 0.3% for AGIs $50k-75k, 0.1% for AGIs $75k-100k, 0.6% for AGIs over 100k)
Taxable dividends: $795 (reported on 17.1% of returns)
Here:
$795
State:
$3,420
(% of AGI for various income ranges: 1.4% for AGIs below $10k, 1.4% for AGIs $10k-25k, 0.5% for AGIs $25k-50k, 0.1% for AGIs $50k-75k, 0.1% for AGIs $75k-100k)
Net capital gain/loss: +$870 (reported on 8.9% of returns)
Here:
+$870
State:
+$8,532
(% of AGI for various income ranges: 1.1% for AGIs $10k-25k, -0.1% for AGIs $25k-50k, 0.1% for AGIs $50k-75k, 0.8% for AGIs $75k-100k)
Profit/loss from business: +$2,231 (reported on 13.5% of returns)
Here:
+$2,231
State:
+$9,547
(% of AGI for various income ranges: 6.7% for AGIs below $10k, 3.9% for AGIs $10k-25k, 0.7% for AGIs $25k-50k, 0.1% for AGIs $50k-75k)
Total itemized deductions: $15,233 (25% of AGI, reported on 27.8% of returns)
Here:
$15,233
State:
$18,509
Here:
24.6% of AGI
State:
20.7% of AGI
(% of AGI for various income ranges: 7.9% for AGIs $10k-25k, 11.5% for AGIs $25k-50k, 14.9% for AGIs $50k-75k, 14.2% for AGIs $75k-100k, 13.8% for AGIs over 100k)
Charity contributions deductions: $1,952 (3% of AGI, reported on 24.5% of returns)
Here:
$1,952
State:
$3,365
Here:
3.0% of AGI
State:
3.6% of AGI
(% of AGI for various income ranges: 0.7% for AGIs $10k-25k, 0.8% for AGIs $25k-50k, 1.5% for AGIs $50k-75k, 1.3% for AGIs $75k-100k, 3.6% for AGIs over 100k)
Total tax: $3,743 (reported on 71.0% of returns)
48652:
$3,743
State:
$7,691
(% of AGI for various income ranges: 2.6% for AGIs below $10k, 3.5% for AGIs $10k-25k, 5.4% for AGIs $25k-50k, 7.9% for AGIs $50k-75k, 10.3% for AGIs $75k-100k, 15.5% for AGIs over 100k)
Earned income credit: $1,582 (reported on 15.8% of returns)
Here:
$1,582
State:
$1,737
Percentage of individuals using paid preparers for their 2004 taxes: 63.9%
Here:
64%
State:
60%
(% for various income ranges: 50.8% for AGIs below $10k, 65.8% for AGIs $10k-25k, 69.7% for AGIs $25k-50k, 66.4% for AGIs $50k-75k, 70.5% for AGIs $75k-100k, 68.2% for AGIs over 100k)
Household received Food Stamps/SNAP in the past 12 months: 44 Household did not receive Food Stamps/SNAP in the past 12 months: 729
Women who had a birth in the past 12 months: 16 (7 now married, 8 unmarried) Women who did not have a birth in the past 12 months: 434 (236 now married, 196 unmarried)
Housing units in zip code 48652 with a mortgage: 373 (39 second mortgage, 28 both second mortgage and home equity loan) Houses without a mortgage: 10
Median monthly owner costs for units with a mortgage: $1,314 Median monthly owner costs for units without a mortgage: $495
Residents with income below the poverty level in 2022:
This zip code:
6.5%
Whole state:
13.4%
Residents with income below 50% of the poverty level in 2022:
This zip code:
5.1%
Whole state:
6.9%
Median number of rooms in houses and condos:
Here:
6.0
State:
6.5
Median number of rooms in apartments:
Here:
6.4
State:
4.3
Notable locations in this zip code not listed on our city pages
Churches in zip code 48652 include: Estey Seventh-Day Adventist Church (A), Rhodes Missionary Church (B), Hope Church (C). Display/hide their locations on the map
Size of family households: 267 2-persons, 150 3-persons, 132 4-persons, 15 5-persons, 13 6-persons, 8 7-or-more-persons
Size of nonfamily households: 156 1-person, 30 2-persons
207 married couples with children.
68 single-parent households (36 men, 32 women).
99.9% of residents of 48652 zip code speak English at home.
Foreign born population: 7 (0.4%) (0.0% of them are naturalized citizens)
:
0.4%
Whole state:
6.9%
50%Sweden
38%Greece
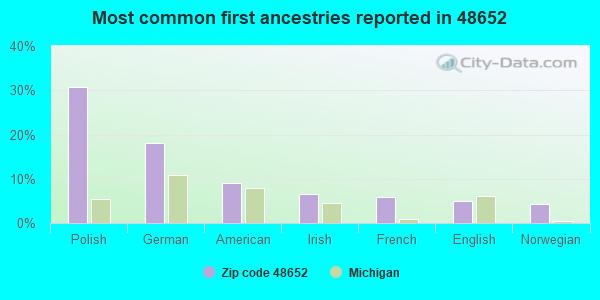
31%Polish
18%German
9%American
7%Irish
6%French
5%English
4%Norwegian
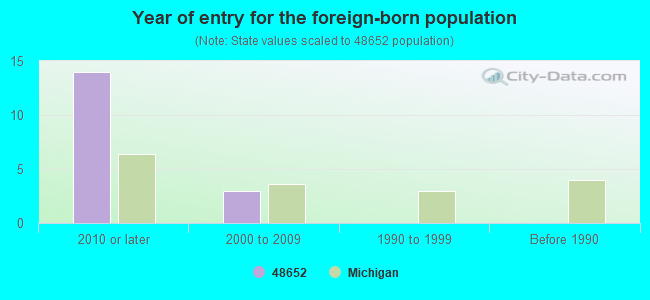
Year of entry for the foreign-born population
142010 or later
32000 to 2009
01990 to 1999
0Before 1990
Facilities with environmental interests located in this zip code:
ESTEY SUPERMARKET INC (4002 ESTEY RD in RHODES, MI)
(Resource Conservation and Recovery Act (tracking hazardous waste)) Organizations: GREGORY STARK (CONTACT/OWNER)
MI DEPT/ENVIRONMENTAL QUALITY (NE CORNER SCHOOL & SWINSON NEU in RHODES, MI)
Conditionally Exempt Small Quantity Generators, less than 100 kg/month of hazardous waste (Resource Conservation and Recovery Act (tracking hazardous waste)) Business NAICS classification: DRILLING OIL AND GAS WELLS. Organizations: MDEQ/LAKELAND OIL & GAS (CONTACT/OPERATOR)
Alternative names: MDEQ LAKELAND OIL & GAS SITE
Housing units lacking complete plumbing facilities: 0.9% Housing units lacking complete kitchen facilities: 0.9%
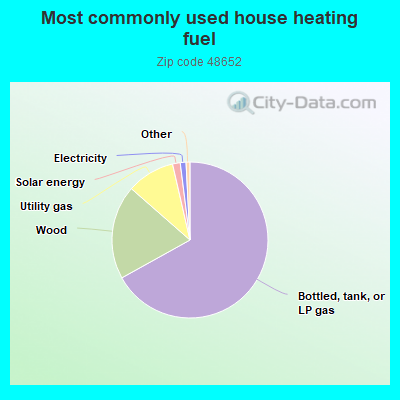
67.2%Bottled, tank, or LP gas
19.6%Wood
10.0%Utility gas
1.6%Solar energy
1.2%Electricity
Population in 1990: 2,034.
Place of birth for U.S.-born residents:
This state: 1,812
Northeast: 2
Midwest: 25
South: 76
West: 31
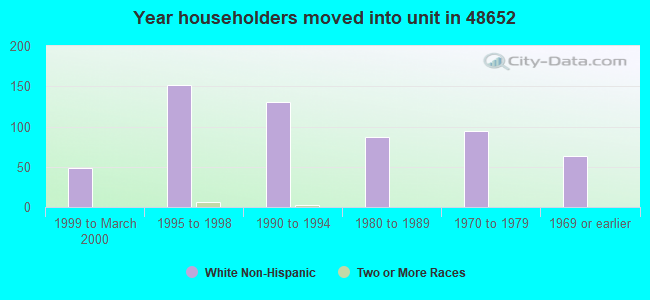
70% of the 48652 zip code residents lived in the same house 5 years ago. Out of people who lived in different houses, 31% lived in this county. Out of people who lived in different counties, 50% lived in Michigan.
97% of the 48652 zip code residents lived in the same house 1 year ago. Out of people who lived in different houses, 37% moved from this county. Out of people who lived in different houses, 65% moved from different county within same state. Out of people who lived in different houses, 4% moved from abroad.
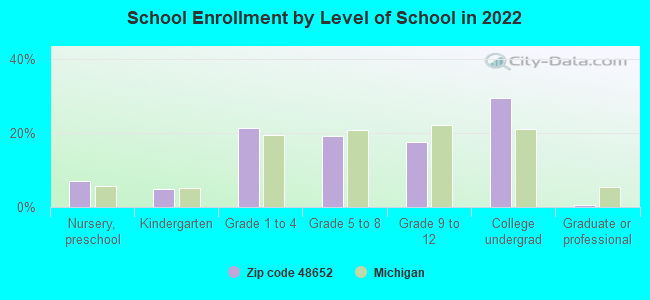
Private vs. public school enrollment:
Students in private schools in grades 1 to 8 (elementary and middle school): 25
Here:
18.0%
Michigan:
12.4%
Students in private schools in grades 9 to 12 (high school): 6
Here:
10.6%
Michigan:
9.8%
Students in private undergraduate colleges: 11
Here:
11.2%
Michigan:
14.9%
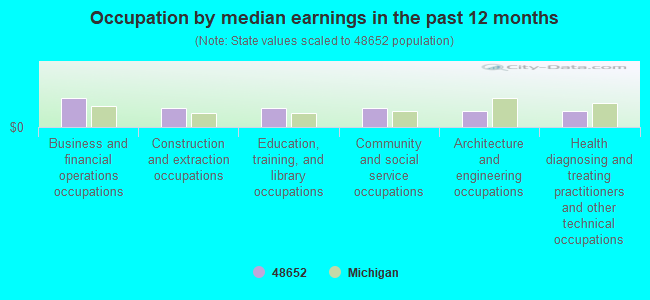
Occupation by median earnings in the past 12 months ($)
110,500Business and financial operations occupations
73,367Construction and extraction occupations
73,243Education, training, and library occupations
70,066Community and social service occupations
60,318Architecture and engineering occupations
59,875Health diagnosing and treating practitioners and other technical occupations
Top industries in this zip code by the number of employees in 2005:
Accommodation and Food Services: Caterers (10-19 employees: 1 establishment)
Construction: Electrical Contractors (5-9: 2)
Accommodation and Food Services: Full-Service Restaurants (5-9: 1)
Wholesale Trade: Service Establishment Equipment and Supplies Merchant Wholesalers (5-9: 1)
Construction: Commercial and Institutional Building Construction (5-9: 1)
Construction: Flooring Contractors (1-4: 2)
Professional, Scientific, and Technical Services: Engineering Services (1-4: 1)
Wholesale Trade: Drugs and Druggists' Sundries Merchant Wholesalers (1-4: 1)
Administrative and Support and Waste Management and Remediation Services: Landscaping Services (1-4: 1)
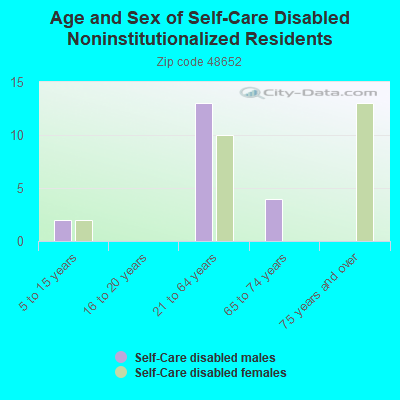
People in group quarters in 2000:
9 people in other noninstitutional group quarters
Home Mortgage Disclosure Act Aggregated Statistics For Year 2009 (Based on 2 partial tracts)
A) FHA, FSA/RHS & VA Home Purchase Loans
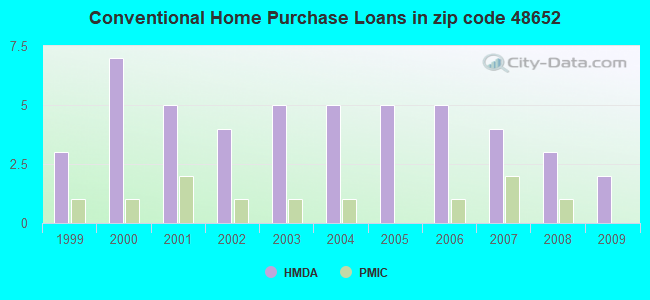
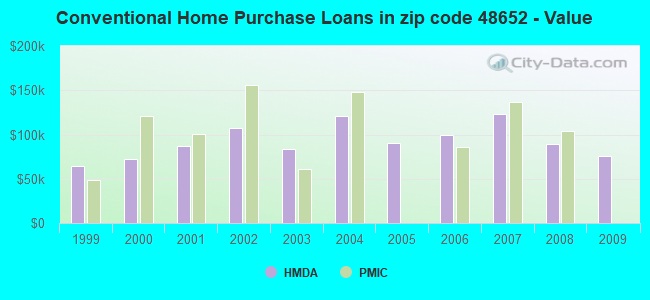
B) Conventional Home Purchase Loans
C) Refinancings
D) Home Improvement Loans
F) Non-occupant Loans on < 5 Family Dwellings (A B C & D)
G) Loans On Manufactured Home Dwelling (A B C & D)
Number
Average Value
Number
Average Value
Number
Average Value
Number
Average Value
Number
Average Value
Number
Average Value
LOANS ORIGINATED
1
$86,120
2
$75,855
10
$93,127
3
$14,627
1
$31,040
1
$54,850
APPLICATIONS APPROVED, NOT ACCEPTED
0
$0
0
$0
2
$134,790
0
$0
0
$0
0
$0
APPLICATIONS DENIED
0
$0
0
$0
5
$143,308
1
$8,170
1
$98,030
2
$62,200
APPLICATIONS WITHDRAWN
0
$0
0
$0
1
$78,420
0
$0
0
$0
0
$0
FILES CLOSED FOR INCOMPLETENESS
0
$0
0
$0
0
$0
0
$0
0
$0
0
$0
Aggregated Statistics For Year 2008 (Based on 2 partial tracts)
A) FHA, FSA/RHS & VA Home Purchase Loans
B) Conventional Home Purchase Loans
C) Refinancings
D) Home Improvement Loans
F) Non-occupant Loans on < 5 Family Dwellings (A B C & D)
G) Loans On Manufactured Home Dwelling (A B C & D)
Number
Average Value
Number
Average Value
Number
Average Value
Number
Average Value
Number
Average Value
Number
Average Value
LOANS ORIGINATED
1
$118,330
3
$89,160
9
$94,604
3
$23,030
1
$37,340
2
$76,555
APPLICATIONS APPROVED, NOT ACCEPTED
0
$0
1
$84,490
2
$167,930
0
$0
0
$0
0
$0
APPLICATIONS DENIED
0
$0
3
$90,637
5
$105,916
1
$61,150
0
$0
1
$73,750
APPLICATIONS WITHDRAWN
0
$0
0
$0
2
$119,735
0
$0
0
$0
0
$0
FILES CLOSED FOR INCOMPLETENESS
0
$0
0
$0
0
$0
0
$0
0
$0
0
$0
Aggregated Statistics For Year 2007 (Based on 2 partial tracts)
A) FHA, FSA/RHS & VA Home Purchase Loans
B) Conventional Home Purchase Loans
C) Refinancings
D) Home Improvement Loans
F) Non-occupant Loans on < 5 Family Dwellings (A B C & D)
G) Loans On Manufactured Home Dwelling (A B C & D)
Number
Average Value
Number
Average Value
Number
Average Value
Number
Average Value
Number
Average Value
Number
Average Value
LOANS ORIGINATED
1
$81,220
4
$122,885
11
$97,476
5
$25,720
1
$48,780
4
$79,472
APPLICATIONS APPROVED, NOT ACCEPTED
0
$0
0
$0
3
$104,873
1
$26,370
0
$0
0
$0
APPLICATIONS DENIED
0
$0
2
$60,685
7
$120,334
4
$29,058
0
$0
2
$70,485
APPLICATIONS WITHDRAWN
0
$0
1
$73,050
3
$116,467
0
$0
0
$0
0
$0
FILES CLOSED FOR INCOMPLETENESS
0
$0
0
$0
0
$0
0
$0
0
$0
0
$0
Aggregated Statistics For Year 2006 (Based on 2 partial tracts)
A) FHA, FSA/RHS & VA Home Purchase Loans
B) Conventional Home Purchase Loans
C) Refinancings
D) Home Improvement Loans
F) Non-occupant Loans on < 5 Family Dwellings (A B C & D)
G) Loans On Manufactured Home Dwelling (A B C & D)
Number
Average Value
Number
Average Value
Number
Average Value
Number
Average Value
Number
Average Value
Number
Average Value
LOANS ORIGINATED
0
$0
5
$99,476
14
$96,961
5
$35,710
1
$56,250
4
$54,382
APPLICATIONS APPROVED, NOT ACCEPTED
0
$0
1
$91,490
2
$88,690
1
$40,840
0
$0
1
$80,290
APPLICATIONS DENIED
0
$0
1
$104,330
11
$101,125
3
$23,730
1
$64,890
1
$58,580
APPLICATIONS WITHDRAWN
0
$0
1
$91,260
5
$127,250
0
$0
0
$0
0
$0
FILES CLOSED FOR INCOMPLETENESS
1
$70,020
1
$46,450
2
$82,505
0
$0
0
$0
0
$0
Aggregated Statistics For Year 2005 (Based on 2 partial tracts)
A) FHA, FSA/RHS & VA Home Purchase Loans
B) Conventional Home Purchase Loans
C) Refinancings
D) Home Improvement Loans
G) Loans On Manufactured Home Dwelling (A B C & D)
Number
Average Value
Number
Average Value
Number
Average Value
Number
Average Value
Number
Average Value
LOANS ORIGINATED
2
$74,920
5
$89,860
13
$99,500
3
$28,787
4
$47,322
APPLICATIONS APPROVED, NOT ACCEPTED
0
$0
1
$126,970
2
$88,925
0
$0
0
$0
APPLICATIONS DENIED
0
$0
2
$140,505
10
$102,323
2
$50,530
2
$63,600
APPLICATIONS WITHDRAWN
0
$0
1
$191,150
6
$106,275
0
$0
0
$0
FILES CLOSED FOR INCOMPLETENESS
0
$0
0
$0
4
$104,912
0
$0
0
$0
Aggregated Statistics For Year 2004 (Based on 2 partial tracts)
A) FHA, FSA/RHS & VA Home Purchase Loans
B) Conventional Home Purchase Loans
C) Refinancings
D) Home Improvement Loans
F) Non-occupant Loans on < 5 Family Dwellings (A B C & D)
G) Loans On Manufactured Home Dwelling (A B C & D)
Number
Average Value
Number
Average Value
Number
Average Value
Number
Average Value
Number
Average Value
Number
Average Value
LOANS ORIGINATED
1
$95,930
5
$121,228
18
$83,441
5
$39,678
1
$21,240
4
$69,788
APPLICATIONS APPROVED, NOT ACCEPTED
0
$0
0
$0
5
$79,450
0
$0
0
$0
1
$40,610
APPLICATIONS DENIED
0
$0
1
$94,530
11
$92,342
3
$38,667
0
$0
2
$77,840
APPLICATIONS WITHDRAWN
0
$0
1
$83,560
5
$108,812
0
$0
0
$0
0
$0
FILES CLOSED FOR INCOMPLETENESS
0
$0
0
$0
2
$113,550
0
$0
0
$0
0
$0
Aggregated Statistics For Year 2003 (Based on 2 partial tracts)
A) FHA, FSA/RHS & VA Home Purchase Loans
B) Conventional Home Purchase Loans
C) Refinancings
D) Home Improvement Loans
Number
Average Value
Number
Average Value
Number
Average Value
Number
Average Value
LOANS ORIGINATED
1
$63,720
5
$83,604
29
$90,084
6
$25,597
APPLICATIONS APPROVED, NOT ACCEPTED
0
$0
0
$0
3
$77,410
0
$0
APPLICATIONS DENIED
0
$0
1
$76,320
12
$103,027
2
$20,775
APPLICATIONS WITHDRAWN
0
$0
0
$0
3
$89,860
0
$0
FILES CLOSED FOR INCOMPLETENESS
0
$0
0
$0
1
$76,090
0
$0
Aggregated Statistics For Year 2002 (Based on 2 partial tracts)
A) FHA, FSA/RHS & VA Home Purchase Loans
B) Conventional Home Purchase Loans
C) Refinancings
D) Home Improvement Loans
F) Non-occupant Loans on < 5 Family Dwellings (A B C & D)
Number
Average Value
Number
Average Value
Number
Average Value
Number
Average Value
Number
Average Value
LOANS ORIGINATED
1
$94,290
4
$107,715
22
$88,840
4
$22,872
1
$91,490
APPLICATIONS APPROVED, NOT ACCEPTED
0
$0
0
$0
4
$74,630
0
$0
0
$0
APPLICATIONS DENIED
0
$0
1
$111,800
9
$71,706
2
$14,820
0
$0
APPLICATIONS WITHDRAWN
0
$0
1
$104,330
4
$89,042
0
$0
0
$0
FILES CLOSED FOR INCOMPLETENESS
0
$0
0
$0
2
$99,310
0
$0
0
$0
Aggregated Statistics For Year 2001 (Based on 2 partial tracts)
B) Conventional Home Purchase Loans
C) Refinancings
D) Home Improvement Loans
F) Non-occupant Loans on < 5 Family Dwellings (A B C & D)
Number
Average Value
Number
Average Value
Number
Average Value
Number
Average Value
LOANS ORIGINATED
5
$86,452
22
$82,995
6
$16,883
2
$57,065
APPLICATIONS APPROVED, NOT ACCEPTED
1
$140,740
3
$74,843
1
$69,320
0
$0
APPLICATIONS DENIED
1
$106,900
6
$83,830
2
$7,120
0
$0
APPLICATIONS WITHDRAWN
0
$0
3
$73,053
0
$0
0
$0
FILES CLOSED FOR INCOMPLETENESS
0
$0
0
$0
0
$0
0
$0
Aggregated Statistics For Year 2000 (Based on 2 partial tracts)
B) Conventional Home Purchase Loans
C) Refinancings
D) Home Improvement Loans
F) Non-occupant Loans on < 5 Family Dwellings (A B C & D)
Number
Average Value
Number
Average Value
Number
Average Value
Number
Average Value
LOANS ORIGINATED
7
$71,987
7
$62,984
5
$20,772
0
$0
APPLICATIONS APPROVED, NOT ACCEPTED
1
$38,280
2
$66,870
1
$8,400
0
$0
APPLICATIONS DENIED
2
$53,215
7
$63,619
2
$32,095
1
$45,980
APPLICATIONS WITHDRAWN
0
$0
2
$75,505
0
$0
0
$0
FILES CLOSED FOR INCOMPLETENESS
0
$0
0
$0
0
$0
0
$0
Aggregated Statistics For Year 1999 (Based on 1 partial tract)
B) Conventional Home Purchase Loans
C) Refinancings
D) Home Improvement Loans
F) Non-occupant Loans on < 5 Family Dwellings (A B C & D)


 Nearest zip codes: 48613, 48628, 48642, 48634, 48650, 48612.