Estimated zip code population in 2022: 2,226 Zip code population in 2010: 1,952 Zip code population in 2000: 1,907
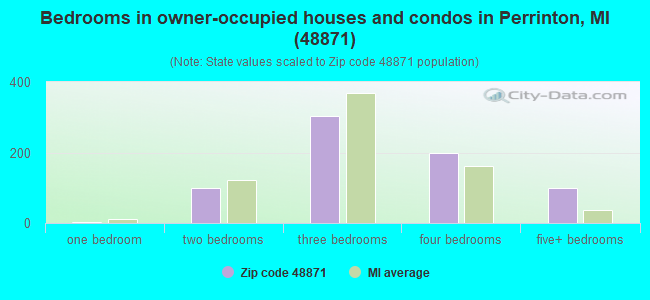
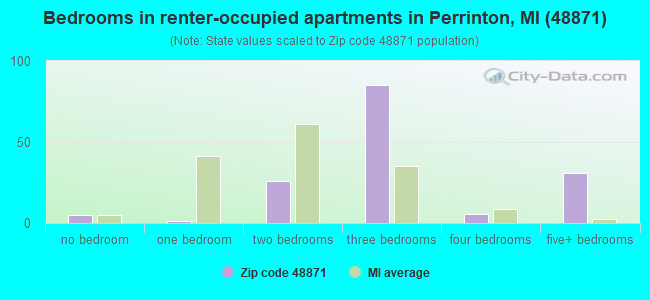
Houses and condos: 928 Renter-occupied apartments: 155
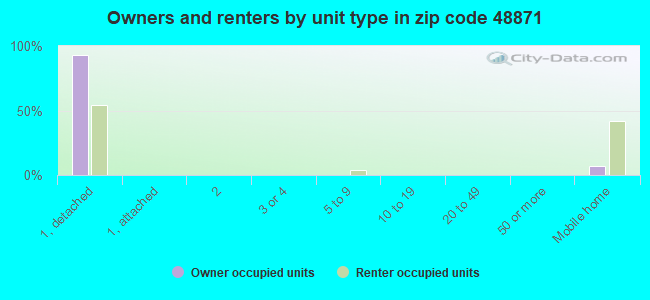
% of renters here:
18%
State:
27%
March 2022 cost of living index in zip code 48871: 81.4 (low, U.S. average is 100)
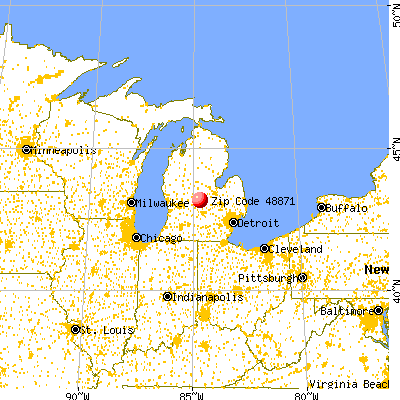
Land area: 30.3 sq. mi. Water area: 0.8 sq. mi.
Population density: 74 people per square mile
(very low).
OSM Map
General Map
Google Map
MSN Map
OSM Map
General Map
Google Map
MSN Map
OSM Map
General Map
Google Map
MSN Map
OSM Map
General Map
Google Map
MSN Map
Please wait while loading the map...
Real estate property taxes paid for housing units in 2022:
This zip code:
0.8% ($1,529)
Michigan:
1.2% ($2,746)
Median real estate property taxes paid for housing units with mortgages in 2022: $1,523 (0.8%) Median real estate property taxes paid for housing units with no mortgage in 2022: $1,566 (0.6%)
Business Search- 14 Million verified businesses
Males: 1,055
(47.4%)
Females: 1,170
(52.6%)
For population 25 years and over in 48871:
High school or higher: 94.2%
Bachelor's degree or higher: 22.7%
Graduate or professional degree: 3.3%
Unemployed: 2.4%
Mean travel time to work (commute): 33.3 minutes
For population 15 years and over in 48871:
Never married: 26.2%
Now married: 54.6%
Separated: 0.6%
Widowed: 7.2%
Divorced: 11.5%
Zip code 48871 compared to state average:
Unemployed percentage below state average.
Black race population percentage significantly below state average.
Hispanic race population percentage significantly below state average.
Foreign-born population percentage significantly below state average.
Length of stay since moving in significantly above state average.
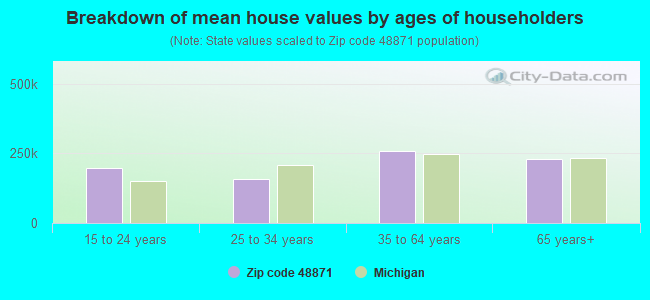
Estimated median house/condo value in 2022: $194,941
48871:
$194,941
Michigan:
$224,400
According to our research of Michigan and other state lists, there were 8 registered sex offenders living in 48871 zip code as of May 28, 2024. The ratio of all residents to sex offenders in zip code 48871 is 260 to 1. The ratio of registered sex offenders to all residents in this zip code is near the state average.
Median resident age:
This zip code:
40.1 years
Michigan median age:
40.3 years
Average household size:
This zip code:
2.5 people
Michigan:
2.4 people
Averages for the 2020 tax year for zip code 48871, filed in 2021:
Average Adjusted Gross Income (AGI) in 2020: $63,780 (Individual Income Tax Returns)
Here:
$63,780
State:
$68,945
Salary/wage: $52,612 (reported on 74.3% of returns)
Here:
$52,612
State:
$57,142
(% of AGI for various income ranges: 968.5% for AGIs below $25k, 3353.9% for AGIs $25k-50k, 6208.0% for AGIs $50k-75k, 9553.3% for AGIs $75k-100k, 15945.0% for AGIs $100k-200k)
Taxable interest for individuals: $725 (reported on 31.7% of returns)
This zip code:
$725
Michigan:
$1,630
(% of AGI for various income ranges: 9.5% for AGIs below $25k, 27.2% for AGIs $25k-50k, 45.0% for AGIs $50k-75k, 41.7% for AGIs $75k-100k, 48.8% for AGIs $100k-200k)
Ordinary dividends: $3,573 (reported on 14.9% of returns)
Here:
$3,573
State:
$6,972
(% of AGI for various income ranges: 16.5% for AGIs below $25k, 11.1% for AGIs $25k-50k, 34.0% for AGIs $50k-75k, 121.7% for AGIs $75k-100k, 172.5% for AGIs $100k-200k)
Net capital gain/loss in AGI: +$14,012 (reported on 16.8% of returns)
Here:
+$14,012
State:
+$20,064
(% of AGI for various income ranges: 23.0% for AGIs below $25k, 40.6% for AGIs $25k-50k, 165.0% for AGIs $50k-75k, 642.5% for AGIs $100k-200k)
Profit/loss from business: +$12,146 (reported on 12.9% of returns)
Here:
+$12,146
State:
+$11,172
(% of AGI for various income ranges: 131.0% for AGIs below $25k, 162.8% for AGIs $25k-50k, 87.0% for AGIs $50k-75k, 1171.2% for AGIs $100k-200k)
Taxable individual retirement arrangement distribution: $16,858 (reported on 11.9% of returns)
48871:
$16,858
Michigan:
$19,803
(% of AGI for various income ranges: 192.0% for AGIs below $25k, 470.0% for AGIs $50k-75k, 1461.2% for AGIs $100k-200k)
Total itemized deductions: $27,450 (reported on 4.0% of returns)
Here:
$27,450
State:
$34,117
(% of AGI for various income ranges: 1372.5% for AGIs $100k-200k)
Charity contributions: $12,633 (reported on 3.0% of returns)
Here:
$12,633
State:
$13,548
(% of AGI for various income ranges: 473.8% for AGIs $100k-200k)
Taxes paid: $7,175 (reported on 4.0% of returns)
48871:
$7,175
State:
$7,972
(% of AGI for various income ranges: 358.8% for AGIs $100k-200k)
Earned income credit: $2,182 (reported on 10.9% of returns)
Here:
$2,182
State:
$2,251
(% of AGI for various income ranges: 53.0% for AGIs below $25k, 74.4% for AGIs $25k-50k)
Percentage of individuals using paid preparers for their 2020 taxes: 94.1%
Here:
94%
State:
93%
(% for various income ranges: 90.3% for AGIs below $25k, 96.0% for AGIs $25k-50k, 100.0% for AGIs $50k-75k, 90.9% for AGIs $75k-100k, 93.3% for AGIs $100k-200k, 100.0% for AGIs over 200k)
Averages for the 2012 tax year for zip code 48871, filed in 2013:
Average Adjusted Gross Income (AGI) in 2012: $53,713 (Individual Income Tax Returns)
Here:
$53,713
State:
$55,609
Salary/wage: $42,725 (reported on 81.5% of returns)
Here:
$42,725
State:
$46,782
(% of AGI for various income ranges: 62.1% for AGIs below $25k, 62.8% for AGIs $25k-50k, 67.5% for AGIs $50k-75k, 71.0% for AGIs $75k-100k, 101.7% for AGIs $100k-200k)
Taxable interest for individuals: $866 (reported on 34.8% of returns)
This zip code:
$866
Michigan:
$1,491
(% of AGI for various income ranges: 1.1% for AGIs below $25k, 0.3% for AGIs $25k-50k, 0.3% for AGIs $50k-75k, 0.6% for AGIs $75k-100k, 1.0% for AGIs $100k-200k)
Ordinary dividends: $1,750 (reported on 15.2% of returns)
Here:
$1,750
State:
$6,225
(% of AGI for various income ranges: 0.6% for AGIs below $25k, 0.8% for AGIs $25k-50k, 0.4% for AGIs $50k-75k, 1.0% for AGIs $100k-200k)
Net capital gain/loss in AGI: +$4,750 (reported on 13.0% of returns)
Here:
+$4,750
State:
+$9,326
(% of AGI for various income ranges: 1.0% for AGIs $50k-75k, 4.0% for AGIs $100k-200k)
Profit/loss from business: +$6,669 (reported on 14.1% of returns)
Here:
+$6,669
State:
+$11,523
(% of AGI for various income ranges: 3.9% for AGIs below $25k, 6.3% for AGIs $25k-50k, 2.3% for AGIs $75k-100k)
Taxable individual retirement arrangement distribution: $12,340 (reported on 10.9% of returns)
48871:
$12,340
Michigan:
$15,298
(% of AGI for various income ranges: 2.4% for AGIs below $25k, 3.3% for AGIs $25k-50k, 5.2% for AGIs $50k-75k, 3.7% for AGIs $100k-200k)
Total itemized deductions: $20,446 (20% of AGI, reported on 28.3% of returns)
Here:
$20,446
State:
$21,628
Here:
19.8% of AGI
State:
18.4% of AGI
(% of AGI for various income ranges: 10.9% for AGIs $25k-50k, 9.9% for AGIs $50k-75k, 11.7% for AGIs $75k-100k, 20.8% for AGIs $100k-200k)
Charity contributions: $4,414 (reported on 22.8% of returns)
Here:
$4,414
State:
$4,225
(% of AGI for various income ranges: 1.7% for AGIs $25k-50k, 1.4% for AGIs $50k-75k, 2.0% for AGIs $75k-100k, 4.0% for AGIs $100k-200k)
Taxes paid: $6,615 (reported on 28.3% of returns)
48871:
$6,615
State:
$8,327
(% of AGI for various income ranges: 2.1% for AGIs $25k-50k, 2.8% for AGIs $50k-75k, 3.6% for AGIs $75k-100k, 8.0% for AGIs $100k-200k)
Earned income credit: $2,292 (reported on 14.1% of returns)
Here:
$2,292
State:
$2,306
(% of AGI for various income ranges: 4.8% for AGIs below $25k, 1.1% for AGIs $25k-50k)
Percentage of individuals using paid preparers for their 2012 taxes: 65.2%
Here:
65%
State:
57%
(% for various income ranges: 60.0% for AGIs below $25k, 65.2% for AGIs $25k-50k, 66.7% for AGIs $50k-75k, 70.0% for AGIs $75k-100k, 90.0% for AGIs $100k-200k)
Averages for the 2004 tax year for zip code 48871, filed in 2005:
Average Adjusted Gross Income (AGI) in 2004: $42,312 (Individual Income Tax Returns)
Here:
$42,312
State:
$48,204
Salary/wage: $38,162 (reported on 83.9% of returns)
Here:
$38,162
State:
$42,791
(% of AGI for various income ranges: 109.5% for AGIs below $10k, 57.8% for AGIs $10k-25k, 68.7% for AGIs $25k-50k, 81.3% for AGIs $50k-75k, 83.5% for AGIs $75k-100k, 71.1% for AGIs over 100k)
Taxable interest for individuals: $1,081 (reported on 47.1% of returns)
This zip code:
$1,081
Michigan:
$1,725
(% of AGI for various income ranges: 8.6% for AGIs below $10k, 2.6% for AGIs $10k-25k, 1.5% for AGIs $25k-50k, 0.6% for AGIs $50k-75k, 1.5% for AGIs $75k-100k, 0.5% for AGIs over 100k)
Taxable dividends: $1,047 (reported on 19.0% of returns)
Here:
$1,047
State:
$3,420
(% of AGI for various income ranges: 3.6% for AGIs below $10k, 0.3% for AGIs $10k-25k, 0.6% for AGIs $25k-50k, 0.3% for AGIs $50k-75k, 0.5% for AGIs $75k-100k, 0.4% for AGIs over 100k)
Net capital gain/loss: +$1,566 (reported on 15.2% of returns)
Here:
+$1,566
State:
+$8,532
(% of AGI for various income ranges: -3.4% for AGIs below $10k, 1.1% for AGIs $10k-25k, 0.3% for AGIs $25k-50k, 0.3% for AGIs $50k-75k, 0.6% for AGIs $75k-100k, 1.2% for AGIs over 100k)
Profit/loss from business: +$962 (reported on 14.9% of returns)
Here:
+$962
State:
+$9,547
(% of AGI for various income ranges: -14.1% for AGIs below $10k, 3.9% for AGIs $10k-25k, 0.8% for AGIs $25k-50k, -0.1% for AGIs $50k-75k, 0.5% for AGIs $75k-100k)
Total itemized deductions: $15,305 (21% of AGI, reported on 33.0% of returns)
Here:
$15,305
State:
$18,509
Here:
21.4% of AGI
State:
20.7% of AGI
(% of AGI for various income ranges: 22.1% for AGIs below $10k, 10.4% for AGIs $10k-25k, 9.4% for AGIs $25k-50k, 12.8% for AGIs $50k-75k, 13.3% for AGIs $75k-100k, 11.7% for AGIs over 100k)
Charity contributions deductions: $2,792 (4% of AGI, reported on 28.6% of returns)
Here:
$2,792
State:
$3,365
Here:
3.7% of AGI
State:
3.6% of AGI
(% of AGI for various income ranges: 1.4% for AGIs $10k-25k, 1.1% for AGIs $25k-50k, 1.7% for AGIs $50k-75k, 2.6% for AGIs $75k-100k, 2.4% for AGIs over 100k)
Total tax: $5,473 (reported on 74.8% of returns)
48871:
$5,473
State:
$7,691
(% of AGI for various income ranges: 3.8% for AGIs below $10k, 3.7% for AGIs $10k-25k, 6.3% for AGIs $25k-50k, 8.2% for AGIs $50k-75k, 10.1% for AGIs $75k-100k, 16.4% for AGIs over 100k)
Earned income credit: $1,398 (reported on 12.7% of returns)
Here:
$1,398
State:
$1,737
Percentage of individuals using paid preparers for their 2004 taxes: 66.4%
Here:
66%
State:
60%
(% for various income ranges: 53.6% for AGIs below $10k, 71.3% for AGIs $10k-25k, 67.2% for AGIs $25k-50k, 68.2% for AGIs $50k-75k, 71.4% for AGIs $75k-100k, 78.0% for AGIs over 100k)
Household received Food Stamps/SNAP in the past 12 months: 106 Household did not receive Food Stamps/SNAP in the past 12 months: 748
Women who had a birth in the past 12 months: 40 (35 now married, 5 unmarried) Women who did not have a birth in the past 12 months: 398 (172 now married, 226 unmarried)
Housing units in zip code 48871 with a mortgage: 385 (51 second mortgage, 54 both second mortgage and home equity loan) Houses without a mortgage: 10
Median monthly owner costs for units with a mortgage: $1,281 Median monthly owner costs for units without a mortgage: $535
Residents with income below the poverty level in 2022:
This zip code:
8.3%
Whole state:
13.4%
Residents with income below 50% of the poverty level in 2022:
This zip code:
3.7%
Whole state:
6.9%
Median number of rooms in houses and condos:
Here:
7.1
State:
6.5
Median number of rooms in apartments:
Here:
5.7
State:
4.3
Notable locations in this zip code not listed on our city pages
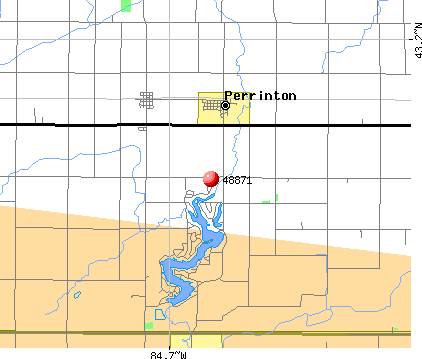
Churches in zip code 48871 include: Fulton Center Church (A), Fulton Church (B), Wildwood Mennonite Church (C), Abundant Life Christian Church (D), Perrington United Methodist Church (E), Marantha United Brethren Church (F). Display/hide their locations on the map
In group quarters: 50 (-1 institutionalized population)
Size of family households: 269 2-persons, 117 3-persons, 142 4-persons, 67 5-persons, 14 6-persons, 11 7-or-more-persons
Size of nonfamily households: 175 1-person, 41 2-persons, 11 3-persons
318 married couples with children.
161 single-parent households (24 men, 137 women).
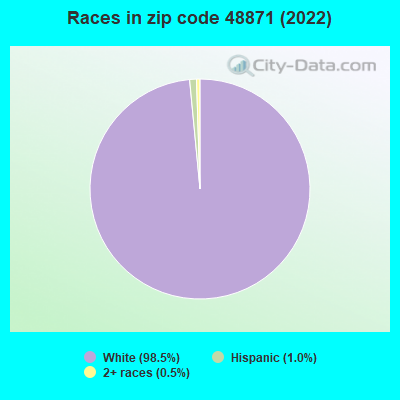
98.5% of residents of 48871 zip code speak English at home.
0.8% of residents speak Spanish at home (31% very well, 50% well, 19% not at all).
0.5% of residents speak other Indo-European language at home (100% very well).
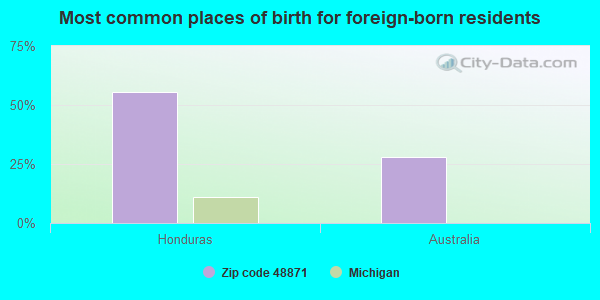
Foreign born population: 17 (0.8%) (0.0% of them are naturalized citizens)
:
0.8%
Whole state:
6.9%
56%Honduras
28%Australia
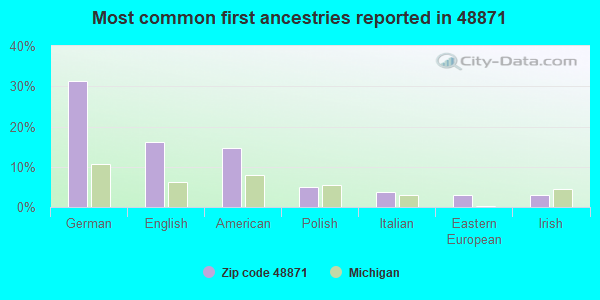
31%German
16%English
15%American
5%Polish
4%Italian
3%Eastern European
3%Irish
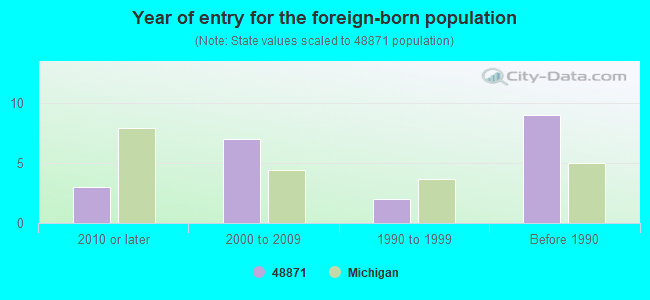
Year of entry for the foreign-born population
32010 or later
72000 to 2009
21990 to 1999
9Before 1990
Facilities with environmental interests located in this zip code:
A J`S AUTO WASH (5250 CLEVELAND in PERRINTON, MI)
(Resource Conservation and Recovery Act (tracking hazardous waste)) Business NAICS classification: CAR WASHES. Organizations: JEFF A PRICE (CONTACT/OPERATOR)
MI DEPT/NATURAL RESOURCES (102 ROBINSON in PERRINTON, MI)
(Resource Conservation and Recovery Act (tracking hazardous waste)) Alternative names: PERRINTON TOTAL
Housing units lacking complete plumbing facilities: 0.1% Housing units lacking complete kitchen facilities: 0.1%
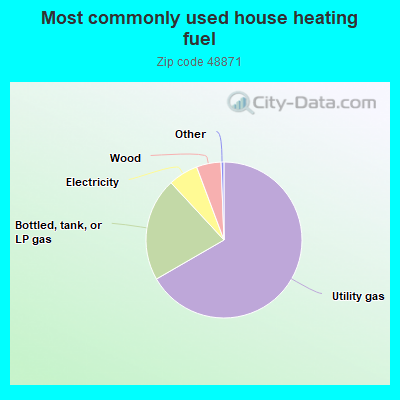
66.8%Utility gas
21.5%Bottled, tank, or LP gas
6.2%Electricity
5.1%Wood
Population in 1990: 1,791. Population change in the 1990s: +116 (+6.5%).
Place of birth for U.S.-born residents:
This state: 1,935
Northeast: 33
Midwest: 177
South: 28
West: 25
61% of the 48871 zip code residents lived in the same house 5 years ago. Out of people who lived in different houses, 36% lived in this county. Out of people who lived in different counties, 50% lived in Michigan.
94% of the 48871 zip code residents lived in the same house 1 year ago. Out of people who lived in different houses, 51% moved from this county. Out of people who lived in different houses, 30% moved from different county within same state. Out of people who lived in different houses, 14% moved from different state. Out of people who lived in different houses, 7% moved from abroad.
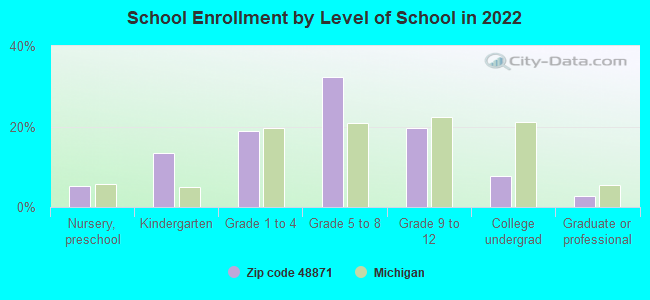
Private vs. public school enrollment:
Students in private schools in grades 1 to 8 (elementary and middle school): 10
Here:
4.5%
Michigan:
12.4%
Students in private schools in grades 9 to 12 (high school): 12
Here:
14.2%
Michigan:
9.8%
Students in private undergraduate colleges: 12
Here:
36.6%
Michigan:
14.9%
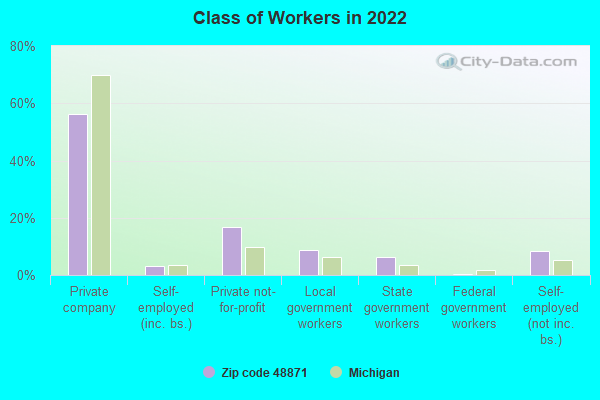
Occupation by median earnings in the past 12 months ($)
222,375Installation, maintenance, and repair occupations
85,105Management occupations
75,032Sales and related occupations
55,934Law enforcement workers including supervisors
52,028Health technologists and technicians
44,918Transportation occupations
Top industries in this zip code by the number of employees in 2005:
Health Care and Social Assistance: Nursing Care Facilities (50-99 employees: 1 establishment)
Construction: Other Heavy and Civil Engineering Construction (1-4: 2)
Construction: New Single-Family Housing Construction (except Operative Builders) (1-4: 2)
Construction: Poured Concrete Foundation and Structure Contractors (1-4: 2)
Other Services (except Public Administration): Religious Organizations (1-4: 1)
Construction: Plumbing, Heating, and Air-Conditioning Contractors (1-4: 1)
Construction: All Other Specialty Trade Contractors (1-4: 1)
People in group quarters in 2010:
45 people in nursing facilities/skilled-nursing facilities
People in group quarters in 2000:
46 people in nursing homes
Fatal accident statistics in 2013:
Fatal accident count: 1
Vehicles involved in fatal accidents: 1
Fatal accidents caused by drunken drivers: 1
Fatalities: 1
Persons involved in fatal accidents: 1
Pedestrians involved in fatal accidents: 0
2002 - 2018 National Fire Incident Reporting System (NFIRS) incidents
Based on the data from the years 2002 - 2018 the average number of fire incidents per year is 7. The highest number of fire incidents - 21 took place in 2015, and the least - 0 in 2004. The data has a rising trend.
When looking into fire subcategories, the most incidents belonged to: Structure Fires (58.5%), and Outside Fires (33.3%).
Fire incident types reported to NFIRS in Zip Code 48871


 Nearest zip codes: 48853, 48856, 48874, 48835, 48847, 48806.


 Based on the data from the years 2002 - 2018 the average number of fire incidents per year is 7. The highest number of fire incidents - 21 took place in 2015, and the least - 0 in 2004. The data has a rising trend.
 When looking into fire subcategories, the most incidents belonged to: Structure Fires (58.5%), and Outside Fires (33.3%).