Estimated zip code population in 2022: 8,556
Zip code population in 2010: 9,310
Zip code population in 2000: 10,075
Houses and condos: 5,160
Renter-occupied apartments: 929
% of renters here:
24%State:
27%
March 2022 cost of living index in zip code 49038: 81.9
(low, U.S. average is 100)
Land area: 37.7
sq. mi.
Water area: 2.5
sq. mi.
Population density: 227 people per square mile (very low).
OSM Map
General Map
Google Map
MSN Map
OSM Map
General Map
Google Map
MSN Map
OSM Map
General Map
Google Map
MSN Map
OSM Map
General Map
Google Map
MSN Map
Please wait while loading the map...
Real estate property taxes paid for housing units in 2022:
This zip code:
1.0% ($2,045)Michigan:
1.2% ($2,746)
Median real estate property taxes paid for housing units with mortgages in 2022: $2,003 (1.1%)
Median real estate property taxes paid for housing units with no mortgage in 2022: $2,119 (1.0%)
Profiles of local businesses
Business Search - 14 Million verified businesses
Males: 4,249 Females: 4,307
For population 25 years and over in 49038:
High school or higher: 93.2%Bachelor's degree or higher: 25.6%Graduate or professional degree: 10.4%Unemployed: 3.8%Mean travel time to work (commute): 23.1 minutes
For population 15 years and over in 49038:
Never married: 21.5%Now married: 55.7%Separated: 1.4%Widowed: 6.8%Divorced: 14.5%
Zip code 49038 compared to state average:
Black race population percentage significantly below state average. Median age above state average. Foreign-born population percentage significantly below state average. 7,557 88.3% White 377 4.4% Two or more races 292 3.4% Hispanic or Latino 186 2.2% Black 143 1.7% Some other race
Data:
Median household income ($)
Median household income (% change since 2000)
Household income diversity
Ratio of average income to average house value (%)
Ratio of average income to average rent
Median household income ($) - White
Median household income ($) - Black or African American
Median household income ($) - Asian
Median household income ($) - Hispanic or Latino
Median household income ($) - American Indian and Alaska Native
Median household income ($) - Multirace
Median household income ($) - Other Race
Median household income for houses/condos with a mortgage ($)
Median household income for apartments without a mortgage ($)
Races - White alone (%)
Races - White alone (% change since 2000)
Races - Black alone (%)
Races - Black alone (% change since 2000)
Races - American Indian alone (%)
Races - American Indian alone (% change since 2000)
Races - Asian alone (%)
Races - Asian alone (% change since 2000)
Races - Hispanic (%)
Races - Hispanic (% change since 2000)
Races - Native Hawaiian and Other Pacific Islander alone (%)
Races - Native Hawaiian and Other Pacific Islander alone (% change since 2000)
Races - Two or more races (%)
Races - Two or more races (% change since 2000)
Races - Other race alone (%)
Races - Other race alone (% change since 2000)
Racial diversity
Unemployment (%)
Unemployment (% change since 2000)
Unemployment (%) - White
Unemployment (%) - Black or African American
Unemployment (%) - Asian
Unemployment (%) - Hispanic or Latino
Unemployment (%) - American Indian and Alaska Native
Unemployment (%) - Multirace
Unemployment (%) - Other Race
Population density (people per square mile)
Population - Males (%)
Population - Females (%)
Population - Males (%) - White
Population - Males (%) - Black or African American
Population - Males (%) - Asian
Population - Males (%) - Hispanic or Latino
Population - Males (%) - American Indian and Alaska Native
Population - Males (%) - Multirace
Population - Males (%) - Other Race
Population - Females (%) - White
Population - Females (%) - Black or African American
Population - Females (%) - Asian
Population - Females (%) - Hispanic or Latino
Population - Females (%) - American Indian and Alaska Native
Population - Females (%) - Multirace
Population - Females (%) - Other Race
Coronavirus confirmed cases (May 28, 2024)
Deaths caused by coronavirus (May 28, 2024)
Coronavirus confirmed cases (per 100k population) (May 28, 2024)
Deaths caused by coronavirus (per 100k population) (May 28, 2024)
Daily increase in number of cases (May 28, 2024)
Weekly increase in number of cases (May 28, 2024)
Cases doubled (in days) (May 28, 2024)
Hospitalized patients (Apr 18, 2022)
Negative test results (Apr 18, 2022)
Total test results (Apr 18, 2022)
COVID Vaccine doses distributed (per 100k population) (Sep 19, 2023)
COVID Vaccine doses administered (per 100k population) (Sep 19, 2023)
COVID Vaccine doses distributed (Sep 19, 2023)
COVID Vaccine doses administered (Sep 19, 2023)
Likely homosexual households (%)
Likely homosexual households (% change since 2000)
Likely homosexual households - Lesbian couples (%)
Likely homosexual households - Lesbian couples (% change since 2000)
Likely homosexual households - Gay men (%)
Likely homosexual households - Gay men (% change since 2000)
Cost of living index
Median gross rent ($)
Median contract rent ($)
Median monthly housing costs ($)
Median house or condo value ($)
Median house or condo value ($ change since 2000)
Mean house or condo value by units in structure - 1, detached ($)
Mean house or condo value by units in structure - 1, attached ($)
Mean house or condo value by units in structure - 2 ($)
Mean house or condo value by units in structure by units in structure - 3 or 4 ($)
Mean house or condo value by units in structure - 5 or more ($)
Mean house or condo value by units in structure - Boat, RV, van, etc. ($)
Mean house or condo value by units in structure - Mobile home ($)
Median house or condo value ($) - White
Median house or condo value ($) - Black or African American
Median house or condo value ($) - Asian
Median house or condo value ($) - Hispanic or Latino
Median house or condo value ($) - American Indian and Alaska Native
Median house or condo value ($) - Multirace
Median house or condo value ($) - Other Race
Median resident age
Resident age diversity
Median resident age - Males
Median resident age - Females
Median resident age - White
Median resident age - Black or African American
Median resident age - Asian
Median resident age - Hispanic or Latino
Median resident age - American Indian and Alaska Native
Median resident age - Multirace
Median resident age - Other Race
Median resident age - Males - White
Median resident age - Males - Black or African American
Median resident age - Males - Asian
Median resident age - Males - Hispanic or Latino
Median resident age - Males - American Indian and Alaska Native
Median resident age - Males - Multirace
Median resident age - Males - Other Race
Median resident age - Females - White
Median resident age - Females - Black or African American
Median resident age - Females - Asian
Median resident age - Females - Hispanic or Latino
Median resident age - Females - American Indian and Alaska Native
Median resident age - Females - Multirace
Median resident age - Females - Other Race
Commute - mean travel time to work (minutes)
Travel time to work - Less than 5 minutes (%)
Travel time to work - Less than 5 minutes (% change since 2000)
Travel time to work - 5 to 9 minutes (%)
Travel time to work - 5 to 9 minutes (% change since 2000)
Travel time to work - 10 to 19 minutes (%)
Travel time to work - 10 to 19 minutes (% change since 2000)
Travel time to work - 20 to 29 minutes (%)
Travel time to work - 20 to 29 minutes (% change since 2000)
Travel time to work - 30 to 39 minutes (%)
Travel time to work - 30 to 39 minutes (% change since 2000)
Travel time to work - 40 to 59 minutes (%)
Travel time to work - 40 to 59 minutes (% change since 2000)
Travel time to work - 60 to 89 minutes (%)
Travel time to work - 60 to 89 minutes (% change since 2000)
Travel time to work - 90 or more minutes (%)
Travel time to work - 90 or more minutes (% change since 2000)
Marital status - Never married (%)
Marital status - Now married (%)
Marital status - Separated (%)
Marital status - Widowed (%)
Marital status - Divorced (%)
Median family income ($)
Median family income (% change since 2000)
Median non-family income ($)
Median non-family income (% change since 2000)
Median per capita income ($)
Median per capita income (% change since 2000)
Median family income ($) - White
Median family income ($) - Black or African American
Median family income ($) - Asian
Median family income ($) - Hispanic or Latino
Median family income ($) - American Indian and Alaska Native
Median family income ($) - Multirace
Median family income ($) - Other Race
Median year house/condo built
Median year apartment built
Year house built - Built 2005 or later (%)
Year house built - Built 2000 to 2004 (%)
Year house built - Built 1990 to 1999 (%)
Year house built - Built 1980 to 1989 (%)
Year house built - Built 1970 to 1979 (%)
Year house built - Built 1960 to 1969 (%)
Year house built - Built 1950 to 1959 (%)
Year house built - Built 1940 to 1949 (%)
Year house built - Built 1939 or earlier (%)
Average household size
Household density (households per square mile)
Average household size - White
Average household size - Black or African American
Average household size - Asian
Average household size - Hispanic or Latino
Average household size - American Indian and Alaska Native
Average household size - Multirace
Average household size - Other Race
Occupied housing units (%)
Vacant housing units (%)
Owner occupied housing units (%)
Renter occupied housing units (%)
Vacancy status - For rent (%)
Vacancy status - For sale only (%)
Vacancy status - Rented or sold, not occupied (%)
Vacancy status - For seasonal, recreational, or occasional use (%)
Vacancy status - For migrant workers (%)
Vacancy status - Other vacant (%)
Residents with income below the poverty level (%)
Residents with income below 50% of the poverty level (%)
Children below poverty level (%)
Poor families by family type - Married-couple family (%)
Poor families by family type - Male, no wife present (%)
Poor families by family type - Female, no husband present (%)
Poverty status for native-born residents (%)
Poverty status for foreign-born residents (%)
Poverty among high school graduates not in families (%)
Poverty among people who did not graduate high school not in families (%)
Residents with income below the poverty level (%) - White
Residents with income below the poverty level (%) - Black or African American
Residents with income below the poverty level (%) - Asian
Residents with income below the poverty level (%) - Hispanic or Latino
Residents with income below the poverty level (%) - American Indian and Alaska Native
Residents with income below the poverty level (%) - Multirace
Residents with income below the poverty level (%) - Other Race
Air pollution - Air Quality Index (AQI)
Air pollution - CO
Air pollution - NO2
Air pollution - SO2
Air pollution - Ozone
Air pollution - PM10
Air pollution - PM25
Air pollution - Pb
Crime - Murders per 100,000 population
Crime - Rapes per 100,000 population
Crime - Robberies per 100,000 population
Crime - Assaults per 100,000 population
Crime - Burglaries per 100,000 population
Crime - Thefts per 100,000 population
Crime - Auto thefts per 100,000 population
Crime - Arson per 100,000 population
Crime - City-data.com crime index
Crime - Violent crime index
Crime - Property crime index
Crime - Murders per 100,000 population (5 year average)
Crime - Rapes per 100,000 population (5 year average)
Crime - Robberies per 100,000 population (5 year average)
Crime - Assaults per 100,000 population (5 year average)
Crime - Burglaries per 100,000 population (5 year average)
Crime - Thefts per 100,000 population (5 year average)
Crime - Auto thefts per 100,000 population (5 year average)
Crime - Arson per 100,000 population (5 year average)
Crime - City-data.com crime index (5 year average)
Crime - Violent crime index (5 year average)
Crime - Property crime index (5 year average)
1996 Presidential Elections Results (%) - Democratic Party (Clinton)
1996 Presidential Elections Results (%) - Republican Party (Dole)
1996 Presidential Elections Results (%) - Other
2000 Presidential Elections Results (%) - Democratic Party (Gore)
2000 Presidential Elections Results (%) - Republican Party (Bush)
2000 Presidential Elections Results (%) - Other
2004 Presidential Elections Results (%) - Democratic Party (Kerry)
2004 Presidential Elections Results (%) - Republican Party (Bush)
2004 Presidential Elections Results (%) - Other
2008 Presidential Elections Results (%) - Democratic Party (Obama)
2008 Presidential Elections Results (%) - Republican Party (McCain)
2008 Presidential Elections Results (%) - Other
2012 Presidential Elections Results (%) - Democratic Party (Obama)
2012 Presidential Elections Results (%) - Republican Party (Romney)
2012 Presidential Elections Results (%) - Other
2016 Presidential Elections Results (%) - Democratic Party (Clinton)
2016 Presidential Elections Results (%) - Republican Party (Trump)
2016 Presidential Elections Results (%) - Other
2020 Presidential Elections Results (%) - Democratic Party (Biden)
2020 Presidential Elections Results (%) - Republican Party (Trump)
2020 Presidential Elections Results (%) - Other
Ancestries Reported - Arab (%)
Ancestries Reported - Czech (%)
Ancestries Reported - Danish (%)
Ancestries Reported - Dutch (%)
Ancestries Reported - English (%)
Ancestries Reported - French (%)
Ancestries Reported - French Canadian (%)
Ancestries Reported - German (%)
Ancestries Reported - Greek (%)
Ancestries Reported - Hungarian (%)
Ancestries Reported - Irish (%)
Ancestries Reported - Italian (%)
Ancestries Reported - Lithuanian (%)
Ancestries Reported - Norwegian (%)
Ancestries Reported - Polish (%)
Ancestries Reported - Portuguese (%)
Ancestries Reported - Russian (%)
Ancestries Reported - Scotch-Irish (%)
Ancestries Reported - Scottish (%)
Ancestries Reported - Slovak (%)
Ancestries Reported - Subsaharan African (%)
Ancestries Reported - Swedish (%)
Ancestries Reported - Swiss (%)
Ancestries Reported - Ukrainian (%)
Ancestries Reported - United States (%)
Ancestries Reported - Welsh (%)
Ancestries Reported - West Indian (%)
Ancestries Reported - Other (%)
Educational Attainment - No schooling completed (%)
Educational Attainment - Less than high school (%)
Educational Attainment - High school or equivalent (%)
Educational Attainment - Less than 1 year of college (%)
Educational Attainment - 1 or more years of college (%)
Educational Attainment - Associate degree (%)
Educational Attainment - Bachelor's degree (%)
Educational Attainment - Master's degree (%)
Educational Attainment - Professional school degree (%)
Educational Attainment - Doctorate degree (%)
School Enrollment - Nursery, preschool (%)
School Enrollment - Kindergarten (%)
School Enrollment - Grade 1 to 4 (%)
School Enrollment - Grade 5 to 8 (%)
School Enrollment - Grade 9 to 12 (%)
School Enrollment - College undergrad (%)
School Enrollment - Graduate or professional (%)
School Enrollment - Not enrolled in school (%)
School enrollment - Public schools (%)
School enrollment - Private schools (%)
School enrollment - Not enrolled (%)
Median number of rooms in houses and condos
Median number of rooms in apartments
Housing units lacking complete plumbing facilities (%)
Housing units lacking complete kitchen facilities (%)
Density of houses
Urban houses (%)
Rural houses (%)
Households with people 60 years and over (%)
Households with people 65 years and over (%)
Households with people 75 years and over (%)
Households with one or more nonrelatives (%)
Households with no nonrelatives (%)
Population in households (%)
Family households (%)
Nonfamily households (%)
Population in families (%)
Family households with own children (%)
Median number of bedrooms in owner occupied houses
Mean number of bedrooms in owner occupied houses
Median number of bedrooms in renter occupied houses
Mean number of bedrooms in renter occupied houses
Median number of vehichles in owner occupied houses
Mean number of vehichles in owner occupied houses
Median number of vehichles in renter occupied houses
Mean number of vehichles in renter occupied houses
Mortgage status - with mortgage (%)
Mortgage status - with second mortgage (%)
Mortgage status - with home equity loan (%)
Mortgage status - with both second mortgage and home equity loan (%)
Mortgage status - without a mortgage (%)
Average family size
Average family size - White
Average family size - Black or African American
Average family size - Asian
Average family size - Hispanic or Latino
Average family size - American Indian and Alaska Native
Average family size - Multirace
Average family size - Other Race
Geographical mobility - Same house 1 year ago (%)
Geographical mobility - Moved within same county (%)
Geographical mobility - Moved from different county within same state (%)
Geographical mobility - Moved from different state (%)
Geographical mobility - Moved from abroad (%)
Place of birth - Born in state of residence (%)
Place of birth - Born in other state (%)
Place of birth - Native, outside of US (%)
Place of birth - Foreign born (%)
Housing units in structures - 1, detached (%)
Housing units in structures - 1, attached (%)
Housing units in structures - 2 (%)
Housing units in structures - 3 or 4 (%)
Housing units in structures - 5 to 9 (%)
Housing units in structures - 10 to 19 (%)
Housing units in structures - 20 to 49 (%)
Housing units in structures - 50 or more (%)
Housing units in structures - Mobile home (%)
Housing units in structures - Boat, RV, van, etc. (%)
House/condo owner moved in on average (years ago)
Renter moved in on average (years ago)
Year householder moved into unit - Moved in 1999 to March 2000 (%)
Year householder moved into unit - Moved in 1995 to 1998 (%)
Year householder moved into unit - Moved in 1990 to 1994 (%)
Year householder moved into unit - Moved in 1980 to 1989 (%)
Year householder moved into unit - Moved in 1970 to 1979 (%)
Year householder moved into unit - Moved in 1969 or earlier (%)
Means of transportation to work - Drove car alone (%)
Means of transportation to work - Carpooled (%)
Means of transportation to work - Public transportation (%)
Means of transportation to work - Bus or trolley bus (%)
Means of transportation to work - Streetcar or trolley car (%)
Means of transportation to work - Subway or elevated (%)
Means of transportation to work - Railroad (%)
Means of transportation to work - Ferryboat (%)
Means of transportation to work - Taxicab (%)
Means of transportation to work - Motorcycle (%)
Means of transportation to work - Bicycle (%)
Means of transportation to work - Walked (%)
Means of transportation to work - Other means (%)
Working at home (%)
Industry diversity
Most Common Industries - Agriculture, forestry, fishing and hunting, and mining (%)
Most Common Industries - Agriculture, forestry, fishing and hunting (%)
Most Common Industries - Mining, quarrying, and oil and gas extraction (%)
Most Common Industries - Construction (%)
Most Common Industries - Manufacturing (%)
Most Common Industries - Wholesale trade (%)
Most Common Industries - Retail trade (%)
Most Common Industries - Transportation and warehousing, and utilities (%)
Most Common Industries - Transportation and warehousing (%)
Most Common Industries - Utilities (%)
Most Common Industries - Information (%)
Most Common Industries - Finance and insurance, and real estate and rental and leasing (%)
Most Common Industries - Finance and insurance (%)
Most Common Industries - Real estate and rental and leasing (%)
Most Common Industries - Professional, scientific, and management, and administrative and waste management services (%)
Most Common Industries - Professional, scientific, and technical services (%)
Most Common Industries - Management of companies and enterprises (%)
Most Common Industries - Administrative and support and waste management services (%)
Most Common Industries - Educational services, and health care and social assistance (%)
Most Common Industries - Educational services (%)
Most Common Industries - Health care and social assistance (%)
Most Common Industries - Arts, entertainment, and recreation, and accommodation and food services (%)
Most Common Industries - Arts, entertainment, and recreation (%)
Most Common Industries - Accommodation and food services (%)
Most Common Industries - Other services, except public administration (%)
Most Common Industries - Public administration (%)
Occupation diversity
Most Common Occupations - Management, business, science, and arts occupations (%)
Most Common Occupations - Management, business, and financial occupations (%)
Most Common Occupations - Management occupations (%)
Most Common Occupations - Business and financial operations occupations (%)
Most Common Occupations - Computer, engineering, and science occupations (%)
Most Common Occupations - Computer and mathematical occupations (%)
Most Common Occupations - Architecture and engineering occupations (%)
Most Common Occupations - Life, physical, and social science occupations (%)
Most Common Occupations - Education, legal, community service, arts, and media occupations (%)
Most Common Occupations - Community and social service occupations (%)
Most Common Occupations - Legal occupations (%)
Most Common Occupations - Education, training, and library occupations (%)
Most Common Occupations - Arts, design, entertainment, sports, and media occupations (%)
Most Common Occupations - Healthcare practitioners and technical occupations (%)
Most Common Occupations - Health diagnosing and treating practitioners and other technical occupations (%)
Most Common Occupations - Health technologists and technicians (%)
Most Common Occupations - Service occupations (%)
Most Common Occupations - Healthcare support occupations (%)
Most Common Occupations - Protective service occupations (%)
Most Common Occupations - Fire fighting and prevention, and other protective service workers including supervisors (%)
Most Common Occupations - Law enforcement workers including supervisors (%)
Most Common Occupations - Food preparation and serving related occupations (%)
Most Common Occupations - Building and grounds cleaning and maintenance occupations (%)
Most Common Occupations - Personal care and service occupations (%)
Most Common Occupations - Sales and office occupations (%)
Most Common Occupations - Sales and related occupations (%)
Most Common Occupations - Office and administrative support occupations (%)
Most Common Occupations - Natural resources, construction, and maintenance occupations (%)
Most Common Occupations - Farming, fishing, and forestry occupations (%)
Most Common Occupations - Construction and extraction occupations (%)
Most Common Occupations - Installation, maintenance, and repair occupations (%)
Most Common Occupations - Production, transportation, and material moving occupations (%)
Most Common Occupations - Production occupations (%)
Most Common Occupations - Transportation occupations (%)
Most Common Occupations - Material moving occupations (%)
People in Group quarters - Institutionalized population (%)
People in Group quarters - Correctional institutions (%)
People in Group quarters - Federal prisons and detention centers (%)
People in Group quarters - Halfway houses (%)
People in Group quarters - Local jails and other confinement facilities (including police lockups) (%)
People in Group quarters - Military disciplinary barracks (%)
People in Group quarters - State prisons (%)
People in Group quarters - Other types of correctional institutions (%)
People in Group quarters - Nursing homes (%)
People in Group quarters - Hospitals/wards, hospices, and schools for the handicapped (%)
People in Group quarters - Hospitals/wards and hospices for chronically ill (%)
People in Group quarters - Hospices or homes for chronically ill (%)
People in Group quarters - Military hospitals or wards for chronically ill (%)
People in Group quarters - Other hospitals or wards for chronically ill (%)
People in Group quarters - Hospitals or wards for drug/alcohol abuse (%)
People in Group quarters - Mental (Psychiatric) hospitals or wards (%)
People in Group quarters - Schools, hospitals, or wards for the mentally retarded (%)
People in Group quarters - Schools, hospitals, or wards for the physically handicapped (%)
People in Group quarters - Institutions for the deaf (%)
People in Group quarters - Institutions for the blind (%)
People in Group quarters - Orthopedic wards and institutions for the physically handicapped (%)
People in Group quarters - Wards in general hospitals for patients who have no usual home elsewhere (%)
People in Group quarters - Wards in military hospitals for patients who have no usual home elsewhere (%)
People in Group quarters - Juvenile institutions (%)
People in Group quarters - Long-term care (%)
People in Group quarters - Homes for abused, dependent, and neglected children (%)
People in Group quarters - Residential treatment centers for emotionally disturbed children (%)
People in Group quarters - Training schools for juvenile delinquents (%)
People in Group quarters - Short-term care, detention or diagnostic centers for delinquent children (%)
People in Group quarters - Type of juvenile institution unknown (%)
People in Group quarters - Noninstitutionalized population (%)
People in Group quarters - College dormitories (includes college quarters off campus) (%)
People in Group quarters - Military quarters (%)
People in Group quarters - On base (%)
People in Group quarters - Barracks, unaccompanied personnel housing (UPH), (Enlisted/Officer), ;and similar group living quarters for military personnel (%)
People in Group quarters - Transient quarters for temporary residents (%)
People in Group quarters - Military ships (%)
People in Group quarters - Group homes (%)
People in Group quarters - Homes or halfway houses for drug/alcohol abuse (%)
People in Group quarters - Homes for the mentally ill (%)
People in Group quarters - Homes for the mentally retarded (%)
People in Group quarters - Homes for the physically handicapped (%)
People in Group quarters - Other group homes (%)
People in Group quarters - Religious group quarters (%)
People in Group quarters - Dormitories (%)
People in Group quarters - Agriculture workers' dormitories on farms (%)
People in Group quarters - Job Corps and vocational training facilities (%)
People in Group quarters - Other workers' dormitories (%)
People in Group quarters - Crews of maritime vessels (%)
People in Group quarters - Other nonhousehold living situations (%)
People in Group quarters - Other noninstitutional group quarters (%)
Residents speaking English at home (%)
Residents speaking English at home - Born in the United States (%)
Residents speaking English at home - Native, born elsewhere (%)
Residents speaking English at home - Foreign born (%)
Residents speaking Spanish at home (%)
Residents speaking Spanish at home - Born in the United States (%)
Residents speaking Spanish at home - Native, born elsewhere (%)
Residents speaking Spanish at home - Foreign born (%)
Residents speaking other language at home (%)
Residents speaking other language at home - Born in the United States (%)
Residents speaking other language at home - Native, born elsewhere (%)
Residents speaking other language at home - Foreign born (%)
Class of Workers - Employee of private company (%)
Class of Workers - Self-employed in own incorporated business (%)
Class of Workers - Private not-for-profit wage and salary workers (%)
Class of Workers - Local government workers (%)
Class of Workers - State government workers (%)
Class of Workers - Federal government workers (%)
Class of Workers - Self-employed workers in own not incorporated business and Unpaid family workers (%)
House heating fuel used in houses and condos - Utility gas (%)
House heating fuel used in houses and condos - Bottled, tank, or LP gas (%)
House heating fuel used in houses and condos - Electricity (%)
House heating fuel used in houses and condos - Fuel oil, kerosene, etc. (%)
House heating fuel used in houses and condos - Coal or coke (%)
House heating fuel used in houses and condos - Wood (%)
House heating fuel used in houses and condos - Solar energy (%)
House heating fuel used in houses and condos - Other fuel (%)
House heating fuel used in houses and condos - No fuel used (%)
House heating fuel used in apartments - Utility gas (%)
House heating fuel used in apartments - Bottled, tank, or LP gas (%)
House heating fuel used in apartments - Electricity (%)
House heating fuel used in apartments - Fuel oil, kerosene, etc. (%)
House heating fuel used in apartments - Coal or coke (%)
House heating fuel used in apartments - Wood (%)
House heating fuel used in apartments - Solar energy (%)
House heating fuel used in apartments - Other fuel (%)
House heating fuel used in apartments - No fuel used (%)
Armed forces status - In Armed Forces (%)
Armed forces status - Civilian (%)
Armed forces status - Civilian - Veteran (%)
Armed forces status - Civilian - Nonveteran (%)
Fatal accidents locations in years 2005-2021
Fatal accidents locations in 2005
Fatal accidents locations in 2006
Fatal accidents locations in 2007
Fatal accidents locations in 2008
Fatal accidents locations in 2009
Fatal accidents locations in 2010
Fatal accidents locations in 2011
Fatal accidents locations in 2012
Fatal accidents locations in 2013
Fatal accidents locations in 2014
Fatal accidents locations in 2015
Fatal accidents locations in 2016
Fatal accidents locations in 2017
Fatal accidents locations in 2018
Fatal accidents locations in 2019
Fatal accidents locations in 2020
Fatal accidents locations in 2021
Alcohol use - People drinking some alcohol every month (%)
Alcohol use - People not drinking at all (%)
Alcohol use - Average days/month drinking alcohol
Alcohol use - Average drinks/week
Alcohol use - Average days/year people drink much
Audiometry - Average condition of hearing (%)
Audiometry - People that can hear a whisper from across a quiet room (%)
Audiometry - People that can hear normal voice from across a quiet room (%)
Audiometry - Ears ringing, roaring, buzzing (%)
Audiometry - Had a job exposure to loud noise (%)
Audiometry - Had off-work exposure to loud noise (%)
Blood Pressure & Cholesterol - Has high blood pressure (%)
Blood Pressure & Cholesterol - Checking blood pressure at home (%)
Blood Pressure & Cholesterol - Frequently checking blood cholesterol (%)
Blood Pressure & Cholesterol - Has high cholesterol level (%)
Consumer Behavior - Money monthly spent on food at supermarket/grocery store
Consumer Behavior - Money monthly spent on food at other stores
Consumer Behavior - Money monthly spent on eating out
Consumer Behavior - Money monthly spent on carryout/delivered foods
Consumer Behavior - Income spent on food at supermarket/grocery store (%)
Consumer Behavior - Income spent on food at other stores (%)
Consumer Behavior - Income spent on eating out (%)
Consumer Behavior - Income spent on carryout/delivered foods (%)
Current Health Status - General health condition (%)
Current Health Status - Blood donors (%)
Current Health Status - Has blood ever tested for HIV virus (%)
Current Health Status - Left-handed people (%)
Dermatology - People using sunscreen (%)
Diabetes - Diabetics (%)
Diabetes - Had a blood test for high blood sugar (%)
Diabetes - People taking insulin (%)
Diet Behavior & Nutrition - Diet health (%)
Diet Behavior & Nutrition - Milk product consumption (# of products/month)
Diet Behavior & Nutrition - Meals not home prepared (#/week)
Diet Behavior & Nutrition - Meals from fast food or pizza place (#/week)
Diet Behavior & Nutrition - Ready-to-eat foods (#/month)
Diet Behavior & Nutrition - Frozen meals/pizza (#/month)
Drug Use - People that ever used marijuana or hashish (%)
Drug Use - Ever used hard drugs (%)
Drug Use - Ever used any form of cocaine (%)
Drug Use - Ever used heroin (%)
Drug Use - Ever used methamphetamine (%)
Health Insurance - People covered by health insurance (%)
Kidney Conditions-Urology - Avg. # of times urinating at night
Medical Conditions - People with asthma (%)
Medical Conditions - People with anemia (%)
Medical Conditions - People with psoriasis (%)
Medical Conditions - People with overweight (%)
Medical Conditions - Elderly people having difficulties in thinking or remembering (%)
Medical Conditions - People who ever received blood transfusion (%)
Medical Conditions - People having trouble seeing even with glass/contacts (%)
Medical Conditions - People with arthritis (%)
Medical Conditions - People with gout (%)
Medical Conditions - People with congestive heart failure (%)
Medical Conditions - People with coronary heart disease (%)
Medical Conditions - People with angina pectoris (%)
Medical Conditions - People who ever had heart attack (%)
Medical Conditions - People who ever had stroke (%)
Medical Conditions - People with emphysema (%)
Medical Conditions - People with thyroid problem (%)
Medical Conditions - People with chronic bronchitis (%)
Medical Conditions - People with any liver condition (%)
Medical Conditions - People who ever had cancer or malignancy (%)
Mental Health - People who have little interest in doing things (%)
Mental Health - People feeling down, depressed, or hopeless (%)
Mental Health - People who have trouble sleeping or sleeping too much (%)
Mental Health - People feeling tired or having little energy (%)
Mental Health - People with poor appetite or overeating (%)
Mental Health - People feeling bad about themself (%)
Mental Health - People who have trouble concentrating on things (%)
Mental Health - People moving or speaking slowly or too fast (%)
Mental Health - People having thoughts they would be better off dead (%)
Oral Health - Average years since last visit a dentist
Oral Health - People embarrassed because of mouth (%)
Oral Health - People with gum disease (%)
Oral Health - General health of teeth and gums (%)
Oral Health - Average days a week using dental floss/device
Oral Health - Average days a week using mouthwash for dental problem
Oral Health - Average number of teeth
Pesticide Use - Households using pesticides to control insects (%)
Pesticide Use - Households using pesticides to kill weeds (%)
Physical Activity - People doing vigorous-intensity work activities (%)
Physical Activity - People doing moderate-intensity work activities (%)
Physical Activity - People walking or bicycling (%)
Physical Activity - People doing vigorous-intensity recreational activities (%)
Physical Activity - People doing moderate-intensity recreational activities (%)
Physical Activity - Average hours a day doing sedentary activities
Physical Activity - Average hours a day watching TV or videos
Physical Activity - Average hours a day using computer
Physical Functioning - People having limitations keeping them from working (%)
Physical Functioning - People limited in amount of work they can do (%)
Physical Functioning - People that need special equipment to walk (%)
Physical Functioning - People experiencing confusion/memory problems (%)
Physical Functioning - People requiring special healthcare equipment (%)
Prescription Medications - Average number of prescription medicines taking
Preventive Aspirin Use - Adults 40+ taking low-dose aspirin (%)
Reproductive Health - Vaginal deliveries (%)
Reproductive Health - Cesarean deliveries (%)
Reproductive Health - Deliveries resulted in a live birth (%)
Reproductive Health - Pregnancies resulted in a delivery (%)
Reproductive Health - Women breastfeeding newborns (%)
Reproductive Health - Women that had a hysterectomy (%)
Reproductive Health - Women that had both ovaries removed (%)
Reproductive Health - Women that have ever taken birth control pills (%)
Reproductive Health - Women taking birth control pills (%)
Reproductive Health - Women that have ever used Depo-Provera or injectables (%)
Reproductive Health - Women that have ever used female hormones (%)
Sexual Behavior - People 18+ that ever had sex (vaginal, anal, or oral) (%)
Sexual Behavior - Males 18+ that ever had vaginal sex with a woman (%)
Sexual Behavior - Males 18+ that ever performed oral sex on a woman (%)
Sexual Behavior - Males 18+ that ever had anal sex with a woman (%)
Sexual Behavior - Males 18+ that ever had any sex with a man (%)
Sexual Behavior - Females 18+ that ever had vaginal sex with a man (%)
Sexual Behavior - Females 18+ that ever performed oral sex on a man (%)
Sexual Behavior - Females 18+ that ever had anal sex with a man (%)
Sexual Behavior - Females 18+ that ever had any kind of sex with a woman (%)
Sexual Behavior - Average age people first had sex
Sexual Behavior - Average number of female sex partners in lifetime (males 18+)
Sexual Behavior - Average number of female vaginal sex partners in lifetime (males 18+)
Sexual Behavior - Average age people first performed oral sex on a woman (18+)
Sexual Behavior - Average number of woman performed oral sex on in lifetime (18+)
Sexual Behavior - Average number of male sex partners in lifetime (males 18+)
Sexual Behavior - Average number of male anal sex partners in lifetime (males 18+)
Sexual Behavior - Average age people first performed oral sex on a man (18+)
Sexual Behavior - Average number of male oral sex partners in lifetime (18+)
Sexual Behavior - People using protection when performing oral sex (%)
Sexual Behavior - Average number of times people have vaginal or anal sex a year
Sexual Behavior - People having sex without condom (%)
Sexual Behavior - Average number of male sex partners in lifetime (females 18+)
Sexual Behavior - Average number of male vaginal sex partners in lifetime (females 18+)
Sexual Behavior - Average number of female sex partners in lifetime (females 18+)
Sexual Behavior - Circumcised males 18+ (%)
Sleep Disorders - Average hours sleeping at night
Sleep Disorders - People that has trouble sleeping (%)
Smoking-Cigarette Use - People smoking cigarettes (%)
Taste & Smell - People 40+ having problems with smell (%)
Taste & Smell - People 40+ having problems with taste (%)
Taste & Smell - People 40+ that ever had wisdom teeth removed (%)
Taste & Smell - People 40+ that ever had tonsils teeth removed (%)
Taste & Smell - People 40+ that ever had a loss of consciousness because of a head injury (%)
Taste & Smell - People 40+ that ever had a broken nose or other serious injury to face or skull (%)
Taste & Smell - People 40+ that ever had two or more sinus infections (%)
Weight - Average height (inches)
Weight - Average weight (pounds)
Weight - Average BMI
Weight - People that are obese (%)
Weight - People that ever were obese (%)
Weight - People trying to lose weight (%)
Urban population: 3,980
Rural population: 4,575
Estimated median house/condo value in 2022: $198,400
49038:
$198,400Michigan:
$224,400
Median resident age: This zip code:
45.8 yearsMichigan median age:
40.3 years
Average household size: This zip code:
2.2 peopleMichigan:
2.4 people
Averages for the 2020 tax year for zip code 49038, filed in 2021:
Average Adjusted Gross Income (AGI) in 2020: $60,014 (Individual Income Tax Returns) Here:
$60,014State:
$68,945
Salary/wage: $49,309 (reported on 77.2% of returns )Here:
$49,309State:
$57,142
(% of AGI for various income ranges: 983.2% for AGIs below $25k , 3302.2% for AGIs $25k-50k , 5993.3% for AGIs $50k-75k , 8987.8% for AGIs $75k-100k , 16064.5% for AGIs $100k-200k , 85490.0% for AGIs over 200k ) Taxable interest for individuals: $1,292 (reported on 25.3% of returns )This zip code:
$1,292Michigan:
$1,630
(% of AGI for various income ranges: 16.9% for AGIs below $25k , 15.6% for AGIs $25k-50k , 28.6% for AGIs $50k-75k , 35.2% for AGIs $75k-100k , 140.0% for AGIs $100k-200k , 1563.3% for AGIs over 200k ) Ordinary dividends: $6,325 (reported on 15.9% of returns )(% of AGI for various income ranges: 31.3% for AGIs below $25k , 31.8% for AGIs $25k-50k , 50.6% for AGIs $50k-75k , 153.3% for AGIs $75k-100k , 395.8% for AGIs $100k-200k , 6590.0% for AGIs over 200k ) Net capital gain/loss in AGI: +$17,803 (reported on 13.9% of returns )Here:
+$17,803State:
+$20,064
(% of AGI for various income ranges: 17.3% for AGIs below $25k , 17.6% for AGIs $25k-50k , 72.2% for AGIs $50k-75k , 200.4% for AGIs $75k-100k , 645.8% for AGIs $100k-200k , 25983.3% for AGIs over 200k ) Profit/loss from business: +$12,837 (reported on 12.8% of returns )Here:
+$12,837State:
+$11,172
(% of AGI for various income ranges: 83.8% for AGIs below $25k , 129.7% for AGIs $25k-50k , 217.6% for AGIs $50k-75k , 415.2% for AGIs $75k-100k , 338.7% for AGIs $100k-200k , 6646.7% for AGIs over 200k ) Taxable individual retirement arrangement distribution: $18,576 (reported on 11.2% of returns )49038:
$18,576Michigan:
$19,803
(% of AGI for various income ranges: 106.5% for AGIs below $25k , 159.7% for AGIs $25k-50k , 225.1% for AGIs $50k-75k , 437.4% for AGIs $75k-100k , 1419.7% for AGIs $100k-200k ) Total itemized deductions: $34,788 (reported on 3.6% of returns )Here:
$34,788State:
$34,117
(% of AGI for various income ranges: 209.2% for AGIs $50k-75k , 225.9% for AGIs $75k-100k , 597.7% for AGIs $100k-200k , 6926.7% for AGIs over 200k ) Charity contributions: $7,762 (reported on 2.9% of returns )(% of AGI for various income ranges: 22.7% for AGIs $50k-75k , 141.3% for AGIs $100k-200k , 1533.3% for AGIs over 200k ) Taxes paid: $8,294 (reported on 3.6% of returns )(% of AGI for various income ranges: 41.0% for AGIs $50k-75k , 63.0% for AGIs $75k-100k , 173.5% for AGIs $100k-200k , 1393.3% for AGIs over 200k ) Earned income credit: $2,195 (reported on 14.1% of returns )(% of AGI for various income ranges: 71.3% for AGIs below $25k , 68.2% for AGIs $25k-50k ) Percentage of individuals using paid preparers for their 2020 taxes: 94.4%(% for various income ranges: 94.2% for AGIs below $25k , 94.2% for AGIs $25k-50k , 94.0% for AGIs $50k-75k , 92.5% for AGIs $75k-100k , 96.2% for AGIs $100k-200k , 100.0% for AGIs over 200k )
Averages for the 2012 tax year for zip code 49038, filed in 2013:
Average Adjusted Gross Income (AGI) in 2012: $43,375 (Individual Income Tax Returns) Here:
$43,375State:
$55,609
Salary/wage: $38,266 (reported on 78.2% of returns )Here:
$38,266State:
$46,782
(% of AGI for various income ranges: 68.9% for AGIs below $25k , 74.5% for AGIs $25k-50k , 74.6% for AGIs $50k-75k , 75.0% for AGIs $75k-100k , 74.1% for AGIs $100k-200k , 30.7% for AGIs over 200k ) Taxable interest for individuals: $1,087 (reported on 31.6% of returns )This zip code:
$1,087Michigan:
$1,491
(% of AGI for various income ranges: 1.5% for AGIs below $25k , 0.7% for AGIs $25k-50k , 0.6% for AGIs $50k-75k , 0.4% for AGIs $75k-100k , 0.5% for AGIs $100k-200k , 1.6% for AGIs over 200k ) Ordinary dividends: $3,420 (reported on 17.3% of returns )(% of AGI for various income ranges: 1.9% for AGIs below $25k , 0.8% for AGIs $25k-50k , 1.3% for AGIs $50k-75k , 0.9% for AGIs $75k-100k , 0.9% for AGIs $100k-200k , 3.4% for AGIs over 200k ) Net capital gain/loss in AGI: +$4,859 (reported on 12.6% of returns )Here:
+$4,859State:
+$9,326
(% of AGI for various income ranges: 0.1% for AGIs $25k-50k , 0.3% for AGIs $50k-75k , 0.6% for AGIs $75k-100k , 1.2% for AGIs $100k-200k , 9.2% for AGIs over 200k ) Profit/loss from business: +$9,675 (reported on 13.1% of returns )Here:
+$9,675State:
+$11,523
(% of AGI for various income ranges: 6.4% for AGIs below $25k , 3.3% for AGIs $25k-50k , 1.7% for AGIs $50k-75k , 2.3% for AGIs $75k-100k , 3.9% for AGIs $100k-200k ) Taxable individual retirement arrangement distribution: $17,005 (reported on 13.3% of returns )49038:
$17,005Michigan:
$15,298
(% of AGI for various income ranges: 5.1% for AGIs below $25k , 4.2% for AGIs $25k-50k , 3.8% for AGIs $50k-75k , 4.9% for AGIs $75k-100k , 4.7% for AGIs $100k-200k , 11.4% for AGIs over 200k ) Total itemized deductions: $18,346 (21% of AGI, reported on 22.5% of returns )Here:
$18,346State:
$21,628
Here:
21.0% of AGIState:
18.4% of AGI
(% of AGI for various income ranges: 7.7% for AGIs below $25k , 8.0% for AGIs $25k-50k , 7.9% for AGIs $50k-75k , 10.2% for AGIs $75k-100k , 12.2% for AGIs $100k-200k , 10.8% for AGIs over 200k ) Charity contributions: $3,273 (reported on 16.4% of returns )(% of AGI for various income ranges: 0.5% for AGIs below $25k , 1.0% for AGIs $25k-50k , 1.0% for AGIs $50k-75k , 1.3% for AGIs $75k-100k , 1.8% for AGIs $100k-200k , 1.8% for AGIs over 200k ) Taxes paid: $6,314 (reported on 22.5% of returns )(% of AGI for various income ranges: 1.4% for AGIs below $25k , 2.0% for AGIs $25k-50k , 2.5% for AGIs $50k-75k , 3.3% for AGIs $75k-100k , 4.9% for AGIs $100k-200k , 6.1% for AGIs over 200k ) Earned income credit: $2,288 (reported on 18.3% of returns )(% of AGI for various income ranges: 6.3% for AGIs below $25k , 1.1% for AGIs $25k-50k ) Percentage of individuals using paid preparers for their 2012 taxes: 52.5%(% for various income ranges: 47.7% for AGIs below $25k , 51.5% for AGIs $25k-50k , 60.3% for AGIs $50k-75k , 58.3% for AGIs $75k-100k , 58.6% for AGIs $100k-200k , 80.0% for AGIs over 200k )
Averages for the 2004 tax year for zip code 49038, filed in 2005:
Average Adjusted Gross Income (AGI) in 2004: $36,888 (Individual Income Tax Returns) Here:
$36,888State:
$48,204
Salary/wage: $34,170 (reported on 83.8% of returns )Here:
$34,170State:
$42,791
(% of AGI for various income ranges: 101.3% for AGIs below $10k , 73.8% for AGIs $10k-25k , 80.8% for AGIs $25k-50k , 82.6% for AGIs $50k-75k , 81.9% for AGIs $75k-100k , 63.9% for AGIs over 100k ) Taxable interest for individuals: $1,311 (reported on 40.5% of returns )This zip code:
$1,311Michigan:
$1,725
(% of AGI for various income ranges: 7.2% for AGIs below $10k , 2.8% for AGIs $10k-25k , 1.1% for AGIs $25k-50k , 0.9% for AGIs $50k-75k , 0.8% for AGIs $75k-100k , 1.7% for AGIs over 100k ) Taxable dividends: $2,307 (reported on 20.8% of returns )(% of AGI for various income ranges: 2.6% for AGIs below $10k , 1.2% for AGIs $10k-25k , 0.8% for AGIs $25k-50k , 0.8% for AGIs $50k-75k , 0.6% for AGIs $75k-100k , 3.0% for AGIs over 100k ) Net capital gain/loss: +$5,976 (reported on 16.0% of returns )Here:
+$5,976State:
+$8,532
(% of AGI for various income ranges: -0.5% for AGIs below $10k , 0.0% for AGIs $10k-25k , 0.5% for AGIs $25k-50k , 0.7% for AGIs $50k-75k , 2.0% for AGIs $75k-100k , 9.6% for AGIs over 100k ) Profit/loss from business: +$7,237 (reported on 15.2% of returns )Here:
+$7,237State:
+$9,547
(% of AGI for various income ranges: 6.8% for AGIs below $10k , 4.9% for AGIs $10k-25k , 2.7% for AGIs $25k-50k , 2.8% for AGIs $50k-75k , 1.5% for AGIs $75k-100k , 3.3% for AGIs over 100k ) IRA payment deduction: $2,914 (reported on 2.3% of returns )49038:
$2,914Michigan:
$2,875
(% of AGI for various income ranges: 0.3% for AGIs $10k-25k , 0.2% for AGIs $25k-50k , 0.2% for AGIs $50k-75k , 0.2% for AGIs $75k-100k , 0.2% for AGIs over 100k ) Self-employed pension: $5,824 (reported on 0.4% of returns )Here:
$5,824Michigan:
$13,826
Total itemized deductions: $14,865 (22% of AGI, reported on 26.3% of returns )Here:
$14,865State:
$18,509
Here:
21.8% of AGIState:
20.7% of AGI
(% of AGI for various income ranges: 6.6% for AGIs below $10k , 7.8% for AGIs $10k-25k , 10.2% for AGIs $25k-50k , 10.0% for AGIs $50k-75k , 12.7% for AGIs $75k-100k , 12.0% for AGIs over 100k ) Charity contributions deductions: $2,565 (4% of AGI, reported on 21.8% of returns )Here:
3.5% of AGIState:
3.6% of AGI
(% of AGI for various income ranges: 0.4% for AGIs below $10k , 0.7% for AGIs $10k-25k , 1.2% for AGIs $25k-50k , 1.5% for AGIs $50k-75k , 1.7% for AGIs $75k-100k , 2.4% for AGIs over 100k ) Total tax: $4,918 (reported on 70.9% of returns )(% of AGI for various income ranges: 3.4% for AGIs below $10k , 4.0% for AGIs $10k-25k , 6.7% for AGIs $25k-50k , 8.8% for AGIs $50k-75k , 10.6% for AGIs $75k-100k , 16.4% for AGIs over 100k ) Earned income credit: $1,695 (reported on 16.4% of returns )Percentage of individuals using paid preparers for their 2004 taxes: 57.0%(% for various income ranges: 50.4% for AGIs below $10k , 57.8% for AGIs $10k-25k , 57.7% for AGIs $25k-50k , 59.5% for AGIs $50k-75k , 62.7% for AGIs $75k-100k , 64.0% for AGIs over 100k )
Estimated median household income in 2022: This zip code:
$59,873Michigan:
$66,986
Nearest zip codes: 49084 ,
49098 ,
49043 ,
49022 ,
49057 ,
49111 .
Paw Paw Lake Zip Code Map
Percentage of family households: This zip code:
40.4%Michigan:
43.3%
Percentage of households with unmarried partners: This zip code:
11.6%Michigan:
45.7%
No gay or lesbian households reported
Household received Food Stamps/SNAP in the past 12 months: 600Household did not receive Food Stamps/SNAP in the past 12 months: 3,253
Women who had a birth in the past 12 months: 88 (60 now married , 28 unmarried) Women who did not have a birth in the past 12 months: 1,561 (824 now married , 731 unmarried)
Housing units in zip code 49038 with a mortgage: 1,583 (208
second mortgage , 213
both second mortgage and home equity loan )
Houses without a mortgage: 3
Median monthly owner costs for units with a mortgage: $1,244
Median monthly owner costs for units without a mortgage: $499
Residents with income below the poverty level in 2022:
This zip code:
13.0%Whole state:
13.4%
Residents with income below 50% of the poverty level in 2022:
This zip code:
6.9%Whole state:
6.9%
Median number of rooms in houses and condos: Median number of rooms in apartments: Notable locations in this zip code not listed on our city pages
Click to draw/clear zip code borders Notable locations in zip code 49038: (A) , Dune Lake Campground (B) , Coloma Emergency Ambulance Service (C) , North Berrien Historical Museum (D) , Coloma Township Police Department (E) , Coloma Public Library (F) , Coloma City Hall (G) , Coloma City - Hagar Fire Department (H) . Display/hide their locations on the map
Churches in zip code 49038 include: (A) , First General Church (B) , First Missionary Baptist Church (C) , Salem Lutheran Church (D) , Coloma Bible Church (E) , Central Assembly of God Church (F) , Living Word Church of God (G) , Lakeshore Bible Church (H) , Lake Michigan Beach Community Church (I) . Display/hide their locations on the map
Cemeteries: (1) , Harris Cemetery (2) , Curtis Cemetery (3) , Boyer Cemetery (4) , Coloma Cemetery (5) , North Shore Memory Garden (6) . Display/hide their locations on the map
Lakes: (A) , Paw Paw Lake (B) , Kibler Lake (C) , Jacobs Chapel Lake (D) , Hibbard Lake (E) , Harris Lake (F) . Display/hide their locations on the map
Streams, rivers, and creeks: (A) . Display/hide its location on the map
Parks in zip code 49038 include: (1) , Randall Park (2) , Lions Club Park (3) , FOP Sports Park (4) . Display/hide their locations on the map
Year house built (houses)
0 2020 or later184 2010 to 2019444 2000 to 2009538 1990 to 1999653 1980 to 1989732 1970 to 1979474 1960 to 1969918 1950 to 1959420 1940 to 1949743 1939 or earlier
Zip code 49038 household income distribution in 2022 277 Less than $10,000219 $10,000 to $14,999214 $15,000 to $19,999203 $20,000 to $24,999191 $25,000 to $29,999173 $30,000 to $34,999141 $35,000 to $39,999102 $40,000 to $44,99980 $45,000 to $49,999302 $50,000 to $59,999296 $60,000 to $74,999614 $75,000 to $99,999349 $100,000 to $124,999267 $125,000 to $149,999198 $150,000 to $199,999214 $200,000 or moreEstimate of home value of owner-occupied houses/condos in 2022 in zip code 49038 12 Less than $10,0002 $10,000 to $14,99946 $15,000 to $19,99927 $20,000 to $24,99912 $30,000 to $34,99941 $40,000 to $49,99920 $50,000 to $59,99971 $60,000 to $69,99970 $70,000 to $79,999126 $80,000 to $89,99982 $90,000 to $99,999239 $100,000 to $124,999145 $125,000 to $149,999390 $150,000 to $174,999241 $175,000 to $199,999553 $200,000 to $249,999359 $250,000 to $299,999176 $300,000 to $399,99937 $400,000 to $499,99972 $500,000 to $749,99971 $750,000 to $999,9993 $1,000,000 to $1,499,99911 $2,000,000 or moreRent paid by renters in 2022 in zip code 49038 20 Less than $10069 $300 to $3499 $400 to $4492 $450 to $49940 $500 to $54915 $550 to $599185 $600 to $649142 $650 to $69975 $700 to $74952 $750 to $799124 $800 to $89990 $900 to $99929 $1,000 to $1,24920 $1,250 to $1,49944 No cash rent
Median gross rent in 2022: $930.
Median price asked for vacant for-sale houses and condos in 2022: $357,238.
Estimated median house (or condo) value in 2022 for: White Non-Hispanic householders: $200,404Black or African American householders: $128,036American Indian or Alaska Native householders: $306,173Asian householders: $295,039Some other race householders: $193,724Two or more races householders: $144,736Hispanic or Latino householders: $152,084Estimated median house or condo value in 2022: $198,400
49038:
$198,400Michigan:
$224,400
Lower value quartile - upper value quartile: $126,382 - $269,767
Mean price in 2022: Detached houses: $245,746Here:
$245,746State:
$280,038
In 3-to-4-unit structures: $442,629Here:
$442,629State:
$207,067
Mobile homes: $480,078Here:
$480,078State:
$72,868
Housing units in structures:
One, detached: 4,237One, attached: 46Two: 1103 or 4: 4125 to 9: 5210 to 19: 11Mobile homes: 273Unemployment : 3.8%
Means of transportation to work in zip code 49038 79.5% 3,224 Drove a car alone6.2% 253 Carpooled0.4% 16 Bus or trolley bus2.9% 119 Walked0.8% 32 Other means8.7% 354 Worked at homeTravel time to work (commute) in zip code 49038 181 Less than 5 minutes352 5 to 9 minutes467 10 to 14 minutes742 15 to 19 minutes571 20 to 24 minutes343 25 to 29 minutes397 30 to 34 minutes72 35 to 39 minutes103 40 to 44 minutes190 45 to 59 minutes140 60 to 89 minutes81 90 or more minutes
Percentage of zip code residents living and working in this county: 79.3%
Household type by relationship:
Households: 8,556
Male householders: 1,849 (691 living alone ), Female householders: 2,000 (694 living alone )1,833 spouses (1,810 opposite-sex spouses ), 283 unmarried partners , (273 opposite-sex unmarried partners ), 1,996 children (1,707 natural , 98 adopted , 189 stepchildren ), 141 grandchildren , 52 brothers or sisters , 115 parents , 0 foster children , 127 other relatives , 135 non-relatives In group quarters: 53 (-1 institutionalized population )
Size of family households: 1,356 2-persons , 309 3-persons , 280 4-persons , 217 5-persons , 49 6-persons , 14 7-or-more-persons
Size of nonfamily households: 1,385 1-person , 203 2-persons , 3 3-persons , 50 4-persons
940 married couples with children. single-parent households (182 men , 456 women ).
96.8% of residents of 49038 zip code speak English at home. of residents speak Spanish at home (39% very well, 31% well, 30% not well ).of residents speak other Indo-European language at home (86% very well, 14% not well ).
Foreign born population: 193 (2.3%)
(12.7%
of them are naturalized citizens )
This zip code:
2.3%Whole state:
6.9%
29% Honduras 18% Bolivia 7% Haiti 6% Norway 5% France 4% Greece 3% Latvia 26% German 12% American 11% English 11% Irish 7% European 4% Polish 4% Dutch
Year of entry for the foreign-born population
101 2010 or later 71 2000 to 2009 61 1990 to 1999 49 Before 1990
Major facilities with environmental interests located in this zip code:
MI DEPT/TRANSPORTATION BRIDGE (I-196 UNDER OLD US-12 in COLOMA, MI)
(Resource Conservation and Recovery Act (tracking hazardous waste)) Organizations: MICH DEPT OF TRANSPORTATION (CONTACT/OPERATOR)
Alternative names: MIDOT BRIDGE I-196 UNDER OLD US-12
GROWER SERVICE CORP (248 WASHINGTON AVE in COLOMA, MI)
(Resource Conservation and Recovery Act (tracking hazardous waste)) Organizations: GROWER SERVICE CORPORATION (CONTACT/OPERATOR)
ASSEMBLED COMPONENTS (390 JPARK ST in COLOMA, MI)
(Resource Conservation and Recovery Act (tracking hazardous waste))
MENASHA CORP COLOMA CONTAINER (333 WEST CENTER in COLOMA, MI)
CRITERIA AND HAZARDOUS AIR POLLUTANT INVENTORY (Inventory of air pollution sources) Conditionally Exempt Small Quantity Generators, less than 100 kg/month of hazardous waste (Resource Conservation and Recovery Act (tracking hazardous waste)) - notification Business SIC classification: CORRUGATED AND SOLID FIBER BOXESBusiness NAICS classification: CORRUGATED AND SOLID FIBER BOX MANUFACTURING.
MI DEPT/STATE POLICE (3617 OHIO ST in COLOMA, MI)
(Resource Conservation and Recovery Act (tracking hazardous waste)) Alternative names: MI DEPT/STATE POLICE (E)
APL LOGISTICS (4412 COLOMA ROAD in COLOMA, MI)
Conditionally Exempt Small Quantity Generators, less than 100 kg/month of hazardous waste (Resource Conservation and Recovery Act (tracking hazardous waste)) - notification Organizations: GATX LOGISTICS (CONTACT/OWNER)
Alternative names: GATX LOGISTICS
Housing units lacking complete kitchen facilities: 0.7%
57.6% Utility gas 24.0% Electricity 13.8% Bottled, tank, or LP gas 3.2% Fuel oil, kerosene, etc. 1.2% Wood
Population in 1990: 9,987. Population change in the 1990s: +88 (+0.9%).
Place of birth for U.S.-born residents:
This state: 6,310Northeast: 94Midwest: 1,173South: 435West: 269
63% of the 49038 zip code residents lived in the same house 5 years ago.
Out of people who lived in different houses, 68% lived in this county.
Out of people who lived in different counties, 50% lived in Michigan.
85% of the 49038 zip code residents lived in the same house 1 year ago.
Out of people who lived in different houses, 58% moved from this county.
Out of people who lived in different houses, 22% moved from different county within same state.
Out of people who lived in different houses, 18% moved from different state.
Private vs. public school enrollment:
Students in private schools in grades 1 to 8 (elementary and middle school): 51
Students in private schools in grades 9 to 12 (high school): 31
Students in private undergraduate colleges: 29
Occupation by median earnings in the past 12 months ($)
170,957 Computer and mathematical occupations 127,327 Health diagnosing and treating practitioners and other technical occupations 115,949 Community and social service occupations 84,915 Arts, design, entertainment, sports, and media occupations 82,718 Fire fighting and prevention, and other protective service workers including supervisors 67,450 Architecture and engineering occupations
Companies with federal contracts located in this zip code:
MODERN LIGHT METALS, INC (920 BOYER ROAD in COLOMA, MI; small business)
$10,700 with Army for Freight Elevators. Signed on 2002-09-26. Completion date: 2002-10-25.
Top industries in this zip code by the number of employees in 2005:
Accommodation and Food Services: Limited-Service Restaurants (20-49 employees: 2 establishments, 10-19 employees: 4 establishments, 5-9 employees: 1 establishment, 1-4 employees: 1 establishment)Accommodation and Food Services: Full-Service Restaurants (20-49: 1, 10-19: 1, 5-9: 4, 1-4: 8)Wholesale Trade: Flower, Nursery Stock, and Florists' Supplies Merchant Wholesalers (50-99: 1)
People in group quarters in 2010:
48 people in workers' group living quarters and job corps centers
6 people in residential treatment centers for adults
People in group quarters in 2000:
58 people in agriculture workers' dormitories on farms
42 people in unknown juvenile institutions
11 people in other noninstitutional group quarters
Fatal accident statistics in 2013:
Fatal accident count: 1Vehicles involved in fatal accidents: 1Fatal accidents caused by drunken drivers: 0Fatalities: 1Persons involved in fatal accidents: 1Pedestrians involved in fatal accidents: 0
Fatal accident statistics in 2012:
Fatal accident count: 1Vehicles involved in fatal accidents: 1Fatal accidents caused by drunken drivers: 0Fatalities: 1Persons involved in fatal accidents: 1Pedestrians involved in fatal accidents: 0
Home Mortgage Disclosure Act Aggregated Statistics For Year 2009(Based on 6 partial tracts) A) FHA, FSA/RHS & VA B) Conventional C) Refinancings D) Home Improvement Loans E) Loans on Dwellings For 5+ Families F) Non-occupant Loans on G) Loans On Manufactured Number Average Value Number Average Value Number Average Value Number Average Value Number Average Value Number Average Value Number Average Value
LOANS ORIGINATED 62 $103,217 56 $135,763 372 $163,562 75 $38,486 5 $169,580 95 $235,213 10 $60,672 APPLICATIONS APPROVED, NOT ACCEPTED 2 $53,755 8 $116,346 45 $140,926 5 $21,466 0 $0 3 $54,630 5 $107,674 APPLICATIONS DENIED 7 $115,273 15 $93,725 115 $158,034 32 $47,027 0 $0 42 $201,080 1 $46,870 APPLICATIONS WITHDRAWN 8 $66,252 6 $245,047 58 $131,356 15 $46,601 0 $0 6 $70,638 0 $0 FILES CLOSED FOR INCOMPLETENESS 0 $0 0 $0 19 $115,262 1 $43,650 0 $0 7 $129,451 0 $0
Aggregated Statistics For Year 2008(Based on 6 partial tracts) A) FHA, FSA/RHS & VA B) Conventional C) Refinancings D) Home Improvement Loans E) Loans on Dwellings For 5+ Families F) Non-occupant Loans on G) Loans On Manufactured Number Average Value Number Average Value Number Average Value Number Average Value Number Average Value Number Average Value Number Average Value
LOANS ORIGINATED 53 $101,392 96 $175,756 282 $139,820 101 $39,355 0 $0 88 $181,414 13 $79,161 APPLICATIONS APPROVED, NOT ACCEPTED 2 $114,115 9 $119,518 37 $160,987 7 $50,559 0 $0 16 $156,718 1 $30,470 APPLICATIONS DENIED 8 $95,709 46 $143,645 137 $147,741 45 $26,243 1 $374,100 32 $212,747 6 $102,358 APPLICATIONS WITHDRAWN 0 $0 5 $104,892 60 $141,538 18 $54,804 0 $0 12 $165,822 0 $0 FILES CLOSED FOR INCOMPLETENESS 0 $0 5 $140,780 27 $140,014 4 $10,845 0 $0 4 $246,620 2 $109,400
Aggregated Statistics For Year 2007(Based on 6 partial tracts) A) FHA, FSA/RHS & VA B) Conventional C) Refinancings D) Home Improvement Loans E) Loans on Dwellings For 5+ Families F) Non-occupant Loans on G) Loans On Manufactured Number Average Value Number Average Value Number Average Value Number Average Value Number Average Value Number Average Value Number Average Value
LOANS ORIGINATED 27 $113,294 199 $181,962 315 $136,258 109 $60,681 1 $1,402,880 116 $264,339 20 $69,566 APPLICATIONS APPROVED, NOT ACCEPTED 0 $0 16 $271,968 70 $139,242 8 $48,278 0 $0 7 $195,053 2 $39,385 APPLICATIONS DENIED 2 $175,790 59 $107,454 272 $133,690 59 $74,101 0 $0 38 $169,336 11 $38,072 APPLICATIONS WITHDRAWN 2 $51,870 18 $119,441 111 $120,527 22 $103,937 0 $0 13 $86,253 0 $0 FILES CLOSED FOR INCOMPLETENESS 0 $0 5 $88,224 20 $103,908 2 $80,165 0 $0 4 $61,772 0 $0
Aggregated Statistics For Year 2006(Based on 6 partial tracts) A) FHA, FSA/RHS & VA B) Conventional C) Refinancings D) Home Improvement Loans E) Loans on Dwellings For 5+ Families F) Non-occupant Loans on G) Loans On Manufactured Number Average Value Number Average Value Number Average Value Number Average Value Number Average Value Number Average Value Number Average Value
LOANS ORIGINATED 30 $119,378 334 $136,957 396 $125,125 114 $46,131 1 $87,290 123 $185,965 18 $116,413 APPLICATIONS APPROVED, NOT ACCEPTED 0 $0 31 $123,224 73 $120,479 12 $26,067 0 $0 18 $231,832 4 $22,980 APPLICATIONS DENIED 4 $97,448 67 $92,096 340 $108,892 71 $54,230 0 $0 27 $139,642 25 $53,280 APPLICATIONS WITHDRAWN 0 $0 39 $81,948 175 $121,480 31 $59,439 0 $0 20 $146,148 5 $77,294 FILES CLOSED FOR INCOMPLETENESS 7 $108,000 4 $145,938 53 $121,848 1 $112,230 0 $0 4 $119,528 0 $0
Aggregated Statistics For Year 2005(Based on 6 partial tracts) A) FHA, FSA/RHS & VA B) Conventional C) Refinancings D) Home Improvement Loans E) Loans on Dwellings For 5+ Families F) Non-occupant Loans on G) Loans On Manufactured Number Average Value Number Average Value Number Average Value Number Average Value Number Average Value Number Average Value Number Average Value
LOANS ORIGINATED 40 $108,019 303 $133,699 467 $116,008 122 $45,828 2 $547,000 152 $175,892 22 $86,448 APPLICATIONS APPROVED, NOT ACCEPTED 2 $93,365 48 $134,193 89 $130,213 14 $41,621 0 $0 12 $327,669 12 $54,908 APPLICATIONS DENIED 2 $43,240 59 $117,208 362 $106,120 66 $48,281 0 $0 19 $149,575 30 $62,794 APPLICATIONS WITHDRAWN 4 $109,870 34 $89,569 252 $109,024 36 $82,030 1 $250,650 11 $109,132 8 $89,122 FILES CLOSED FOR INCOMPLETENESS 4 $83,465 0 $0 65 $128,362 0 $0 0 $0 2 $679,050 0 $0
Aggregated Statistics For Year 2004(Based on 6 partial tracts) A) FHA, FSA/RHS & VA B) Conventional C) Refinancings D) Home Improvement Loans E) Loans on Dwellings For 5+ Families F) Non-occupant Loans on G) Loans On Manufactured Number Average Value Number Average Value Number Average Value Number Average Value Number Average Value Number Average Value Number Average Value
LOANS ORIGINATED 25 $107,515 202 $132,232 553 $113,351 149 $38,765 2 $120,715 138 $183,806 21 $61,811 APPLICATIONS APPROVED, NOT ACCEPTED 6 $83,758 23 $126,378 108 $104,922 7 $41,771 1 $1,200,860 18 $143,519 5 $70,620 APPLICATIONS DENIED 15 $85,377 68 $101,898 408 $101,782 66 $22,255 0 $0 19 $146,205 26 $66,515 APPLICATIONS WITHDRAWN 0 $0 19 $130,385 173 $98,738 14 $42,579 0 $0 7 $80,796 3 $93,013 FILES CLOSED FOR INCOMPLETENESS 0 $0 5 $74,808 45 $103,568 4 $18,862 0 $0 5 $86,468 3 $100,457
Aggregated Statistics For Year 2003(Based on 6 partial tracts) A) FHA, FSA/RHS & VA B) Conventional C) Refinancings D) Home Improvement Loans E) Loans on Dwellings For 5+ Families F) Non-occupant Loans on Number Average Value Number Average Value Number Average Value Number Average Value Number Average Value Number Average Value
LOANS ORIGINATED 19 $95,257 246 $124,396 1,073 $107,947 123 $28,699 1 $533,720 176 $161,404 APPLICATIONS APPROVED, NOT ACCEPTED 2 $102,800 24 $99,375 111 $115,768 8 $18,088 0 $0 13 $146,978 APPLICATIONS DENIED 13 $93,529 36 $91,596 373 $88,536 81 $27,717 0 $0 19 $93,486 APPLICATIONS WITHDRAWN 3 $109,127 27 $86,501 217 $99,352 20 $34,509 0 $0 22 $110,110 FILES CLOSED FOR INCOMPLETENESS 2 $120,590 6 $100,427 46 $82,854 0 $0 0 $0 3 $88,300
Aggregated Statistics For Year 2002(Based on 6 partial tracts) A) FHA, FSA/RHS & VA B) Conventional C) Refinancings D) Home Improvement Loans E) Loans on Dwellings For 5+ Families F) Non-occupant Loans on Number Average Value Number Average Value Number Average Value Number Average Value Number Average Value Number Average Value
LOANS ORIGINATED 24 $108,712 188 $112,673 689 $105,652 188 $30,584 4 $208,425 124 $136,619 APPLICATIONS APPROVED, NOT ACCEPTED 0 $0 23 $60,180 118 $88,062 11 $44,417 0 $0 3 $18,657 APPLICATIONS DENIED 4 $65,545 71 $98,943 273 $90,308 69 $15,625 0 $0 17 $72,118 APPLICATIONS WITHDRAWN 8 $106,335 14 $134,559 130 $87,055 20 $17,509 0 $0 8 $77,934 FILES CLOSED FOR INCOMPLETENESS 2 $55,645 0 $0 39 $89,150 0 $0 0 $0 0 $0
Aggregated Statistics For Year 2001(Based on 6 partial tracts) A) FHA, FSA/RHS & VA B) Conventional C) Refinancings D) Home Improvement Loans F) Non-occupant Loans on Number Average Value Number Average Value Number Average Value Number Average Value Number Average Value
LOANS ORIGINATED 32 $87,264 208 $96,138 659 $94,061 189 $25,727 96 $98,066 APPLICATIONS APPROVED, NOT ACCEPTED 2 $96,605 19 $49,916 113 $84,478 18 $15,010 15 $76,396 APPLICATIONS DENIED 6 $88,348 74 $55,847 286 $73,422 80 $16,347 14 $43,651 APPLICATIONS WITHDRAWN 4 $83,418 13 $78,805 127 $86,115 21 $38,036 10 $124,209 FILES CLOSED FOR INCOMPLETENESS 0 $0 2 $173,530 42 $101,455 0 $0 2 $173,530
Aggregated Statistics For Year 2000(Based on 6 partial tracts) A) FHA, FSA/RHS & VA B) Conventional C) Refinancings D) Home Improvement Loans E) Loans on Dwellings For 5+ Families F) Non-occupant Loans on Number Average Value Number Average Value Number Average Value Number Average Value Number Average Value Number Average Value
LOANS ORIGINATED 32 $96,352 251 $97,890 283 $72,350 172 $19,984 1 $31,180 78 $97,594 APPLICATIONS APPROVED, NOT ACCEPTED 3 $95,520 28 $75,199 95 $73,041 29 $19,961 0 $0 6 $147,878 APPLICATIONS DENIED 6 $85,822 112 $65,548 217 $60,054 85 $21,406 0 $0 20 $68,576 APPLICATIONS WITHDRAWN 5 $101,194 19 $66,412 89 $57,351 16 $24,949 0 $0 6 $70,103 FILES CLOSED FOR INCOMPLETENESS 2 $67,905 9 $75,272 32 $74,195 0 $0 0 $0 4 $114,588
Aggregated Statistics For Year 1999(Based on 3 partial tracts) A) FHA, FSA/RHS & VA B) Conventional C) Refinancings D) Home Improvement Loans F) Non-occupant Loans on Number Average Value Number Average Value Number Average Value Number Average Value Number Average Value
LOANS ORIGINATED 16 $80,782 126 $85,769 220 $75,117 100 $18,381 39 $121,454 APPLICATIONS APPROVED, NOT ACCEPTED 0 $0 11 $58,951 47 $76,222 15 $11,412 2 $136,560 APPLICATIONS DENIED 2 $99,865 56 $51,524 86 $68,006 57 $12,887 6 $61,508 APPLICATIONS WITHDRAWN 1 $99,530 11 $84,693 69 $69,663 9 $35,954 2 $168,715 FILES CLOSED FOR INCOMPLETENESS 0 $0 2 $71,950 10 $49,941 1 $18,490 1 $111,920
Detailed HMDA statistics for the following Tracts:
0101.00
,
0102.00 ,
0106.00
Private Mortgage Insurance Companies Aggregated Statistics For Year 2009(Based on 6 partial tracts) A) Conventional B) Refinancings C) Non-occupant Loans on Number Average Value Number Average Value Number Average Value
LOANS ORIGINATED 6 $74,273 7 $182,474 1 $147,150 APPLICATIONS APPROVED, NOT ACCEPTED 4 $171,575 11 $143,341 0 $0 APPLICATIONS DENIED 0 $0 2 $97,060 0 $0 APPLICATIONS WITHDRAWN 0 $0 0 $0 0 $0 FILES CLOSED FOR INCOMPLETENESS 2 $47,155 0 $0 0 $0
Aggregated Statistics For Year 2008(Based on 6 partial tracts) A) Conventional B) Refinancings C) Non-occupant Loans on Number Average Value Number Average Value Number Average Value
LOANS ORIGINATED 24 $122,470 18 $160,624 8 $112,762 APPLICATIONS APPROVED, NOT ACCEPTED 17 $191,365 8 $162,342 9 $220,107 APPLICATIONS DENIED 4 $174,545 1 $199,520 2 $207,625 APPLICATIONS WITHDRAWN 0 $0 0 $0 0 $0 FILES CLOSED FOR INCOMPLETENESS 0 $0 0 $0 0 $0
Aggregated Statistics For Year 2007(Based on 6 partial tracts) A) Conventional B) Refinancings C) Non-occupant Loans on D) Loans On Manufactured Number Average Value Number Average Value Number Average Value Number Average Value
LOANS ORIGINATED 71 $124,509 26 $160,712 16 $176,241 2 $107,515 APPLICATIONS APPROVED, NOT ACCEPTED 8 $85,724 9 $111,587 0 $0 0 $0 APPLICATIONS DENIED 2 $188,765 1 $329,210 1 $355,400 0 $0 APPLICATIONS WITHDRAWN 2 $130,150 2 $102,800 0 $0 0 $0 FILES CLOSED FOR INCOMPLETENESS 0 $0 0 $0 0 $0 0 $0
Aggregated Statistics For Year 2006(Based on 6 partial tracts) A) Conventional B) Refinancings C) Non-occupant Loans on D) Loans On Manufactured Number Average Value Number Average Value Number Average Value Number Average Value
LOANS ORIGINATED 78 $124,107 21 $133,831 22 $138,955 2 $230,820 APPLICATIONS APPROVED, NOT ACCEPTED 5 $119,986 13 $138,572 4 $146,835 0 $0 APPLICATIONS DENIED 3 $203,320 0 $0 1 $392,810 0 $0 APPLICATIONS WITHDRAWN 1 $64,580 0 $0 0 $0 0 $0 FILES CLOSED FOR INCOMPLETENESS 0 $0 0 $0 0 $0 0 $0
Aggregated Statistics For Year 2005(Based on 6 partial tracts) A) Conventional B) Refinancings C) Non-occupant Loans on Number Average Value Number Average Value Number Average Value
LOANS ORIGINATED 49 $114,609 36 $110,650 26 $97,773 APPLICATIONS APPROVED, NOT ACCEPTED 8 $137,872 8 $150,189 2 $70,940 APPLICATIONS DENIED 0 $0 2 $100,910 0 $0 APPLICATIONS WITHDRAWN 0 $0 2 $114,725 0 $0 FILES CLOSED FOR INCOMPLETENESS 0 $0 0 $0 0 $0
Aggregated Statistics For Year 2004(Based on 6 partial tracts) A) Conventional B) Refinancings C) Non-occupant Loans on D) Loans On Manufactured Number Average Value Number Average Value Number Average Value Number Average Value
LOANS ORIGINATED 47 $104,737 32 $116,274 10 $114,502 2 $84,880 APPLICATIONS APPROVED, NOT ACCEPTED 4 $89,475 5 $91,370 4 $83,935 0 $0 APPLICATIONS DENIED 0 $0 0 $0 0 $0 0 $0 APPLICATIONS WITHDRAWN 2 $103,740 0 $0 0 $0 0 $0 FILES CLOSED FOR INCOMPLETENESS 0 $0 2 $98,080 0 $0 0 $0
Aggregated Statistics For Year 2003(Based on 6 partial tracts) A) Conventional B) Refinancings C) Non-occupant Loans on Number Average Value Number Average Value Number Average Value
LOANS ORIGINATED 66 $121,395 60 $115,308 22 $131,872 APPLICATIONS APPROVED, NOT ACCEPTED 2 $110,740 20 $130,979 0 $0 APPLICATIONS DENIED 2 $49,040 1 $66,090 0 $0 APPLICATIONS WITHDRAWN 3 $143,123 2 $120,120 2 $122,300 FILES CLOSED FOR INCOMPLETENESS 0 $0 0 $0 0 $0
Aggregated Statistics For Year 2002(Based on 6 partial tracts) A) Conventional B) Refinancings C) Non-occupant Loans on Number Average Value Number Average Value Number Average Value
LOANS ORIGINATED 77 $105,862 56 $115,425 12 $74,919 APPLICATIONS APPROVED, NOT ACCEPTED 10 $118,915 11 $151,669 2 $71,490 APPLICATIONS DENIED 6 $69,678 2 $82,050 1 $25,520 APPLICATIONS WITHDRAWN 2 $233,190 2 $133,430 2 $233,190 FILES CLOSED FOR INCOMPLETENESS 0 $0 0 $0 0 $0
Aggregated Statistics For Year 2001(Based on 6 partial tracts) A) Conventional B) Refinancings C) Non-occupant Loans on Number Average Value Number Average Value Number Average Value
LOANS ORIGINATED 66 $97,633 39 $101,992 8 $101,359 APPLICATIONS APPROVED, NOT ACCEPTED 10 $116,260 12 $125,488 1 $101,010 APPLICATIONS DENIED 6 $129,533 4 $240,300 2 $327,255 APPLICATIONS WITHDRAWN 3 $68,463 0 $0 0 $0 FILES CLOSED FOR INCOMPLETENESS 0 $0 2 $95,655 0 $0
Aggregated Statistics For Year 2000(Based on 6 partial tracts) A) Conventional B) Refinancings C) Non-occupant Loans on Number Average Value Number Average Value Number Average Value
LOANS ORIGINATED 68 $96,473 9 $63,299 11 $82,665 APPLICATIONS APPROVED, NOT ACCEPTED 13 $137,519 2 $114,115 8 $120,245 APPLICATIONS DENIED 0 $0 0 $0 0 $0 APPLICATIONS WITHDRAWN 3 $153,887 0 $0 0 $0 FILES CLOSED FOR INCOMPLETENESS 0 $0 0 $0 0 $0
Aggregated Statistics For Year 1999(Based on 3 partial tracts) A) Conventional B) Refinancings C) Non-occupant Loans on Number Average Value Number Average Value Number Average Value
LOANS ORIGINATED 28 $89,402 9 $85,122 1 $82,760 APPLICATIONS APPROVED, NOT ACCEPTED 1 $38,560 1 $63,950 0 $0 APPLICATIONS DENIED 0 $0 0 $0 0 $0 APPLICATIONS WITHDRAWN 0 $0 1 $35,130 0 $0 FILES CLOSED FOR INCOMPLETENESS 0 $0 0 $0 0 $0
Detailed PMIC statistics for the following Tracts:
0101.00
,
0102.00 ,
0106.00
2002 - 2018 National Fire Incident Reporting System (NFIRS) incidents See full 2006 National Fire Incident Reporting System statistics for zip code 49038, Michigan
Most common first names in zip code 49038 among deceased individuals Name Count Lived (average)
John 89 76.6 years William 59 74.7 years Mary 55 77.2 years James 52 66.9 years Robert 48 71.9 years Edward 40 74.8 years Dorothy 36 78.3 years Charles 35 76.8 years Ruth 34 78.5 years Joseph 34 74.6 years
Most common last names in zip code 49038 among deceased individuals Last name Count Lived (average)
Smith 25 74.5 years Miller 23 76.6 years Martin 16 74.5 years Johnson 16 78.4 years Warman 14 84.6 years Jones 12 81.5 years Bishop 10 83.1 years Arent 10 79.0 years Hosbein 10 76.8 years Rose 9 70.9 years
Businesses in zip code 49038
Name Count Name Count
Dairy Queen 1 Pizza Hut 1 GNC 1 Rite Aid 1 Lane Furniture 1 Subway 1 McDonald's 1 True Value 1

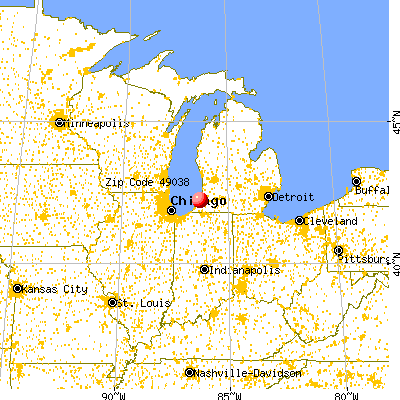


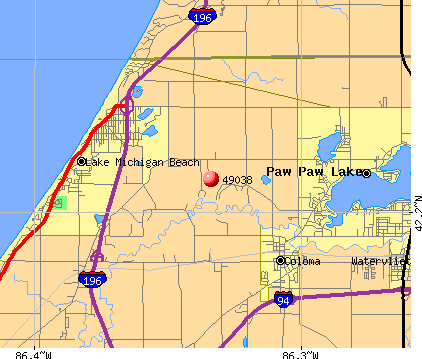 Nearest zip codes: 49084, 49098, 49043, 49022, 49057, 49111.


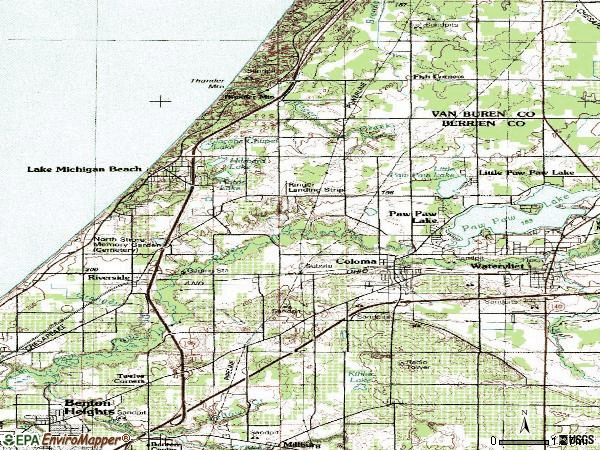


 According to the data from the years 2002 - 2018 the average number of fire incidents per year is 34. The highest number of reported fires - 67 took place in 2005, and the least - 6 in 2015. The data has a rising trend.
 When looking into fire subcategories, the most reports belonged to: Structure Fires (43.7%), and Outside Fires (38.1%).