Estimated zip code population in 2022: 1,813 Zip code population in 2010: 1,622 Zip code population in 2000: 1,634
Houses and condos: 780 Renter-occupied apartments: 77
% of renters here:
12%
State:
27%
March 2022 cost of living index in zip code 49061: 81.8 (low, U.S. average is 100)
Land area: 37.5 sq. mi. Water area: 1.3 sq. mi.
Population density: 48 people per square mile
(very low).
OSM Map
General Map
Google Map
MSN Map
OSM Map
General Map
Google Map
MSN Map
OSM Map
General Map
Google Map
MSN Map
OSM Map
General Map
Google Map
MSN Map
Please wait while loading the map...
Real estate property taxes paid for housing units in 2022:
This zip code:
1.0% ($1,930)
Michigan:
1.2% ($2,746)
Median real estate property taxes paid for housing units with mortgages in 2022: $2,443 (1.1%) Median real estate property taxes paid for housing units with no mortgage in 2022: $1,407 (0.9%)
Averages for the 2020 tax year for zip code 49061, filed in 2021:
Average Adjusted Gross Income (AGI) in 2020: $56,092 (Individual Income Tax Returns)
Here:
$56,092
State:
$68,945
Salary/wage: $44,702 (reported on 82.3% of returns)
Here:
$44,702
State:
$57,142
(% of AGI for various income ranges: 1026.8% for AGIs below $25k, 3324.1% for AGIs $25k-50k, 6055.0% for AGIs $50k-75k, 8366.7% for AGIs $75k-100k, 17298.3% for AGIs $100k-200k)
Taxable interest for individuals: $852 (reported on 29.1% of returns)
This zip code:
$852
Michigan:
$1,630
(% of AGI for various income ranges: 3.2% for AGIs below $25k, 31.8% for AGIs $25k-50k, 11.0% for AGIs $50k-75k, 13.3% for AGIs $75k-100k, 195.0% for AGIs $100k-200k)
Ordinary dividends: $4,250 (reported on 12.7% of returns)
Here:
$4,250
State:
$6,972
(% of AGI for various income ranges: 48.8% for AGIs $25k-50k, 35.0% for AGIs $50k-75k, 511.7% for AGIs $100k-200k)
Net capital gain/loss in AGI: +$17,060 (reported on 12.7% of returns)
Here:
+$17,060
State:
+$20,064
(% of AGI for various income ranges: 3.2% for AGIs below $25k, 43.5% for AGIs $25k-50k, 30.0% for AGIs $50k-75k, 2660.0% for AGIs $100k-200k)
Profit/loss from business: +$15,900 (reported on 12.7% of returns)
Here:
+$15,900
State:
+$11,172
(% of AGI for various income ranges: 229.5% for AGIs below $25k, 119.0% for AGIs $50k-75k, 1725.0% for AGIs $100k-200k)
Taxable individual retirement arrangement distribution: $17,088 (reported on 10.1% of returns)
49061:
$17,088
Michigan:
$19,803
(% of AGI for various income ranges: 50.5% for AGIs below $25k, 259.4% for AGIs $25k-50k, 1383.3% for AGIs $75k-100k)
Total itemized deductions: $31,400 (reported on 3.8% of returns)
Here:
$31,400
State:
$34,117
(% of AGI for various income ranges: 1570.0% for AGIs $75k-100k)
Taxes paid: $7,233 (reported on 3.8% of returns)
49061:
$7,233
State:
$7,972
(% of AGI for various income ranges: 217.0% for AGIs $50k-75k)
Earned income credit: $1,915 (reported on 16.5% of returns)
Here:
$1,915
State:
$2,251
(% of AGI for various income ranges: 81.6% for AGIs below $25k, 55.3% for AGIs $25k-50k)
Percentage of individuals using paid preparers for their 2020 taxes: 98.7%
Here:
99%
State:
93%
(% for various income ranges: 96.3% for AGIs below $25k, 100.0% for AGIs $25k-50k, 100.0% for AGIs $50k-75k, 100.0% for AGIs $75k-100k, 100.0% for AGIs $100k-200k)
Averages for the 2012 tax year for zip code 49061, filed in 2013:
Average Adjusted Gross Income (AGI) in 2012: $42,111 (Individual Income Tax Returns)
Here:
$42,111
State:
$55,609
Salary/wage: $38,169 (reported on 81.9% of returns)
Here:
$38,169
State:
$46,782
(% of AGI for various income ranges: 73.7% for AGIs below $25k, 77.1% for AGIs $25k-50k, 82.5% for AGIs $50k-75k, 74.6% for AGIs $75k-100k, 63.4% for AGIs $100k-200k)
Taxable interest for individuals: $590 (reported on 29.2% of returns)
This zip code:
$590
Michigan:
$1,491
(% of AGI for various income ranges: 0.4% for AGIs below $25k, 0.9% for AGIs $25k-50k, 0.1% for AGIs $50k-75k, 0.1% for AGIs $75k-100k, 0.4% for AGIs $100k-200k)
Ordinary dividends: $1,578 (reported on 12.5% of returns)
Here:
$1,578
State:
$6,225
(% of AGI for various income ranges: 0.4% for AGIs $25k-50k, 0.6% for AGIs $50k-75k, 0.9% for AGIs $100k-200k)
Net capital gain/loss in AGI: +$3,425 (reported on 11.1% of returns)
Here:
+$3,425
State:
+$9,326
(% of AGI for various income ranges: 2.2% for AGIs below $25k, 0.5% for AGIs $50k-75k, 2.0% for AGIs $100k-200k)
Profit/loss from business: +$4,620 (reported on 13.9% of returns)
Here:
+$4,620
State:
+$11,523
(% of AGI for various income ranges: 5.2% for AGIs below $25k, 2.1% for AGIs $25k-50k, 2.9% for AGIs $75k-100k)
Taxable individual retirement arrangement distribution: $8,400 (reported on 6.9% of returns)
49061:
$8,400
Michigan:
$15,298
Total itemized deductions: $15,562 (22% of AGI, reported on 22.2% of returns)
Here:
$15,562
State:
$21,628
Here:
21.6% of AGI
State:
18.4% of AGI
(% of AGI for various income ranges: 9.1% for AGIs $25k-50k, 7.3% for AGIs $50k-75k, 10.0% for AGIs $75k-100k, 11.0% for AGIs $100k-200k)
Charity contributions: $3,011 (reported on 12.5% of returns)
Here:
$3,011
State:
$4,225
(% of AGI for various income ranges: 1.5% for AGIs below $25k, 0.6% for AGIs $50k-75k, 1.6% for AGIs $75k-100k, 1.2% for AGIs $100k-200k)
Taxes paid: $5,467 (reported on 20.8% of returns)
49061:
$5,467
State:
$8,327
(% of AGI for various income ranges: 1.9% for AGIs $25k-50k, 2.1% for AGIs $50k-75k, 3.5% for AGIs $75k-100k, 4.7% for AGIs $100k-200k)
Earned income credit: $2,383 (reported on 16.7% of returns)
Here:
$2,383
State:
$2,306
(% of AGI for various income ranges: 5.5% for AGIs below $25k, 1.4% for AGIs $25k-50k)
Percentage of individuals using paid preparers for their 2012 taxes: 62.5%
Here:
62%
State:
57%
(% for various income ranges: 58.6% for AGIs below $25k, 63.2% for AGIs $25k-50k, 69.2% for AGIs $50k-75k, 66.7% for AGIs $75k-100k, 60.0% for AGIs $100k-200k)
Averages for the 2004 tax year for zip code 49061, filed in 2005:
Average Adjusted Gross Income (AGI) in 2004: $40,312 (Individual Income Tax Returns)
Here:
$40,312
State:
$48,204
Salary/wage: $36,620 (reported on 87.8% of returns)
Here:
$36,620
State:
$42,791
(% of AGI for various income ranges: 122.3% for AGIs below $10k, 79.3% for AGIs $10k-25k, 84.4% for AGIs $25k-50k, 83.1% for AGIs $50k-75k, 95.6% for AGIs $75k-100k, 55.6% for AGIs over 100k)
Taxable interest for individuals: $1,093 (reported on 37.5% of returns)
This zip code:
$1,093
Michigan:
$1,725
(% of AGI for various income ranges: 3.3% for AGIs below $10k, 2.3% for AGIs $10k-25k, 1.1% for AGIs $25k-50k, 1.3% for AGIs $50k-75k, 0.1% for AGIs $75k-100k, 0.4% for AGIs over 100k)
Taxable dividends: $858 (reported on 13.8% of returns)
Here:
$858
State:
$3,420
(% of AGI for various income ranges: 0.6% for AGIs $10k-25k, 0.3% for AGIs $25k-50k, 0.3% for AGIs $50k-75k, 0.4% for AGIs $75k-100k)
Net capital gain/loss: +$6,196 (reported on 13.2% of returns)
Here:
+$6,196
State:
+$8,532
(% of AGI for various income ranges: 0.0% for AGIs below $10k, 2.4% for AGIs $10k-25k, 1.3% for AGIs $25k-50k, 1.0% for AGIs $50k-75k, 5.6% for AGIs over 100k)
Profit/loss from business: +$5,130 (reported on 16.0% of returns)
Here:
+$5,130
State:
+$9,547
(% of AGI for various income ranges: 11.3% for AGIs below $10k, 5.4% for AGIs $10k-25k, 1.7% for AGIs $25k-50k, 2.6% for AGIs $50k-75k, 0.9% for AGIs $75k-100k)
IRA payment deduction: $1,727 (reported on 1.4% of returns)
49061:
$1,727
Michigan:
$2,875
Total itemized deductions: $13,803 (19% of AGI, reported on 24.4% of returns)
Here:
$13,803
State:
$18,509
Here:
19.3% of AGI
State:
20.7% of AGI
(% of AGI for various income ranges: 4.3% for AGIs $10k-25k, 7.7% for AGIs $25k-50k, 9.4% for AGIs $50k-75k, 12.7% for AGIs $75k-100k, 7.8% for AGIs over 100k)
Charity contributions deductions: $2,859 (4% of AGI, reported on 16.6% of returns)
Here:
$2,859
State:
$3,365
Here:
3.6% of AGI
State:
3.6% of AGI
(% of AGI for various income ranges: 1.0% for AGIs $25k-50k, 1.2% for AGIs $50k-75k, 1.2% for AGIs $75k-100k, 2.1% for AGIs over 100k)
Total tax: $5,418 (reported on 76.5% of returns)
49061:
$5,418
State:
$7,691
(% of AGI for various income ranges: 2.5% for AGIs below $10k, 3.9% for AGIs $10k-25k, 7.1% for AGIs $25k-50k, 8.6% for AGIs $50k-75k, 9.9% for AGIs $75k-100k, 20.7% for AGIs over 100k)
Earned income credit: $1,856 (reported on 15.3% of returns)
Here:
$1,856
State:
$1,737
Percentage of individuals using paid preparers for their 2004 taxes: 67.4%
Here:
67%
State:
60%
(% for various income ranges: 62.0% for AGIs below $10k, 67.6% for AGIs $10k-25k, 64.0% for AGIs $25k-50k, 74.6% for AGIs $50k-75k, 72.5% for AGIs $75k-100k, 80.8% for AGIs over 100k)
Household received Food Stamps/SNAP in the past 12 months: 50 Household did not receive Food Stamps/SNAP in the past 12 months: 614
Women who had a birth in the past 12 months: 33 (4 now married, 27 unmarried) Women who did not have a birth in the past 12 months: 425 (209 now married, 215 unmarried)
Housing units in zip code 49061 with a mortgage: 307 (22 second mortgage, 23 both second mortgage and home equity loan) Houses without a mortgage: 5
Median monthly owner costs for units with a mortgage: $1,299 Median monthly owner costs for units without a mortgage: $474
Residents with income below the poverty level in 2022:
This zip code:
11.2%
Whole state:
13.4%
Residents with income below 50% of the poverty level in 2022:
This zip code:
6.1%
Whole state:
6.9%
Median number of rooms in houses and condos:
Here:
6.4
State:
6.5
Median number of rooms in apartments:
Here:
6.6
State:
4.3
Notable locations in this zip code not listed on our city pages
Notable locations in zip code 49061: Camp Tamarack (A), Swiss Valley Ski Area (B), Shady Point Campgrounds (C), M40 Speedway (D), Lakeside Campground (E), Newberg Township Fire and Emergency Medical Services (F). Display/hide their locations on the map
Lakes: Little Wood Lake (A), Lilly Lake (B), Wood Lake (C), Fox Lake (D), Hutchens Lake (E), Forked Lake (F), Driskels Lake (G), Carters Lake (H). Display/hide their locations on the map
Size of family households: 224 2-persons, 143 3-persons, 109 4-persons, 16 5-persons, 20 6-persons, 13 7-or-more-persons
Size of nonfamily households: 131 1-person, 4 2-persons
287 married couples with children.
128 single-parent households (7 men, 121 women).
98.0% of residents of 49061 zip code speak English at home.
1.2% of residents speak Spanish at home (76% very well, 24% well).
0.2% of residents speak other Indo-European language at home (100% very well).
Foreign born population: 32 (1.8%) (100.0% of them are naturalized citizens)
This zip code:
1.8%
Whole state:
6.9%
84%Honduras
9%Germany
35%German
21%English
13%American
7%Irish
4%European
4%French Canadian
3%French
Year of entry for the foreign-born population
312010 or later
02000 to 2009
01990 to 1999
7Before 1990
Facilities with environmental interests located in this zip code:
AT&T LONG LINES JONES (ST RD 119 1.3M N OF JONES in JONES, MI)
(Resource Conservation and Recovery Act (tracking hazardous waste)) Organizations: AT & T (CONTACT/OPERATOR)
MI DEPT/NATURAL RESOURCES (60887 M-40 in JONES, MI)
(Resource Conservation and Recovery Act (tracking hazardous waste)) Organizations: STATE OF MICHIGAN (CONTACT/OWNER)
MI DEPT/STATE POLICE (14338 TEASDALE LAKE RD in JONES, MI)
(Resource Conservation and Recovery Act (tracking hazardous waste)) Alternative names: MI DEPT/STATE POLICE (E)
Housing units lacking complete plumbing facilities: 2.6% Housing units lacking complete kitchen facilities: 2.9%
54.8%Bottled, tank, or LP gas
31.7%Wood
7.5%Electricity
6.3%Fuel oil, kerosene, etc.
Population in 1990: 2,121.
Place of birth for U.S.-born residents:
This state: 968
Northeast: 19
Midwest: 615
South: 90
West: 95
59% of the 49061 zip code residents lived in the same house 5 years ago. Out of people who lived in different houses, 41% lived in this county. Out of people who lived in different counties, 50% lived in Michigan.
85% of the 49061 zip code residents lived in the same house 1 year ago. Out of people who lived in different houses, 42% moved from this county. Out of people who lived in different houses, 23% moved from different county within same state. Out of people who lived in different houses, 36% moved from different state.
Private vs. public school enrollment:
Students in private schools in grades 1 to 8 (elementary and middle school): 4
Here:
1.9%
Michigan:
12.4%
Students in private schools in grades 9 to 12 (high school): 4
Here:
3.1%
Michigan:
9.8%
Students in private undergraduate colleges: 25
Here:
48.0%
Michigan:
14.9%
Occupation by median earnings in the past 12 months ($)
89,960Architecture and engineering occupations
74,437Management occupations
67,248Community and social service occupations
67,076Office and administrative support occupations
52,823Installation, maintenance, and repair occupations
43,871Health diagnosing and treating practitioners and other technical occupations
Top industries in this zip code by the number of employees in 2005:
Arts, Entertainment, and Recreation: Skiing Facilities (100-249 employees: 1 establishment)
Other Services (except Public Administration): Religious Organizations (10-19: 1)
Construction: Other Building Finishing Contractors (5-9: 1)
Construction: All Other Specialty Trade Contractors (1-4: 2)
Arts, Entertainment, and Recreation: Other Spectator Sports (1-4: 1)
Wholesale Trade: Motor Vehicle Supplies and New Parts Merchant Wholesalers (1-4: 1)
Construction: New Single-Family Housing Construction (except Operative Builders) (1-4: 1)
Construction: Poured Concrete Foundation and Structure Contractors (1-4: 1)
Fatal accident statistics in 2014:
Fatal accident count: 2
Vehicles involved in fatal accidents: 4
Fatal accidents caused by drunken drivers: 1
Fatalities: 2
Persons involved in fatal accidents: 6
Pedestrians involved in fatal accidents: 0
Fatal accident statistics in 2012:
Fatal accident count: 1
Vehicles involved in fatal accidents: 1
Fatal accidents caused by drunken drivers: 0
Fatalities: 2
Persons involved in fatal accidents: 3
Pedestrians involved in fatal accidents: 0
Home Mortgage Disclosure Act Aggregated Statistics For Year 2009 (Based on 4 partial tracts)
A) FHA, FSA/RHS & VA Home Purchase Loans
B) Conventional Home Purchase Loans
C) Refinancings
D) Home Improvement Loans
F) Non-occupant Loans on < 5 Family Dwellings (A B C & D)
G) Loans On Manufactured Home Dwelling (A B C & D)
Number
Average Value
Number
Average Value
Number
Average Value
Number
Average Value
Number
Average Value
Number
Average Value
LOANS ORIGINATED
7
$92,427
20
$196,164
134
$183,058
6
$60,027
39
$218,416
6
$63,172
APPLICATIONS APPROVED, NOT ACCEPTED
0
$0
0
$0
13
$144,734
4
$14,740
1
$61,670
3
$22,560
APPLICATIONS DENIED
2
$44,470
4
$144,592
48
$169,362
7
$40,237
11
$150,185
3
$56,150
APPLICATIONS WITHDRAWN
1
$92,210
4
$92,668
18
$154,807
1
$22,170
3
$138,477
3
$76,637
FILES CLOSED FOR INCOMPLETENESS
0
$0
1
$30,270
4
$110,038
0
$0
0
$0
1
$84,760
Aggregated Statistics For Year 2008 (Based on 4 partial tracts)
A) FHA, FSA/RHS & VA Home Purchase Loans
B) Conventional Home Purchase Loans
C) Refinancings
D) Home Improvement Loans
F) Non-occupant Loans on < 5 Family Dwellings (A B C & D)
G) Loans On Manufactured Home Dwelling (A B C & D)
Number
Average Value
Number
Average Value
Number
Average Value
Number
Average Value
Number
Average Value
Number
Average Value
LOANS ORIGINATED
11
$93,841
26
$220,466
80
$170,889
6
$140,932
28
$231,849
12
$77,708
APPLICATIONS APPROVED, NOT ACCEPTED
3
$132,440
2
$116,615
13
$163,844
1
$6,810
1
$83,550
3
$71,570
APPLICATIONS DENIED
1
$144,170
8
$229,648
40
$139,055
7
$72,280
6
$196,100
7
$68,877
APPLICATIONS WITHDRAWN
3
$111,503
4
$351,812
17
$170,916
3
$64,210
4
$167,930
2
$103,935
FILES CLOSED FOR INCOMPLETENESS
0
$0
1
$314,830
4
$121,300
1
$5,400
0
$0
0
$0
Aggregated Statistics For Year 2007 (Based on 4 partial tracts)
A) FHA, FSA/RHS & VA Home Purchase Loans
B) Conventional Home Purchase Loans
C) Refinancings
D) Home Improvement Loans
F) Non-occupant Loans on < 5 Family Dwellings (A B C & D)
G) Loans On Manufactured Home Dwelling (A B C & D)
Number
Average Value
Number
Average Value
Number
Average Value
Number
Average Value
Number
Average Value
Number
Average Value
LOANS ORIGINATED
8
$108,632
55
$167,356
78
$146,353
14
$66,660
22
$180,536
9
$64,933
APPLICATIONS APPROVED, NOT ACCEPTED
1
$111,000
4
$107,978
13
$156,481
2
$77,900
1
$230,940
3
$115,723
APPLICATIONS DENIED
1
$83,250
7
$98,334
46
$121,541
11
$53,145
2
$186,580
9
$82,152
APPLICATIONS WITHDRAWN
0
$0
9
$168,163
32
$152,968
2
$109,730
5
$170,464
1
$112,890
FILES CLOSED FOR INCOMPLETENESS
0
$0
2
$235,390
8
$182,629
0
$0
0
$0
0
$0
Aggregated Statistics For Year 2006 (Based on 4 partial tracts)
A) FHA, FSA/RHS & VA Home Purchase Loans
B) Conventional Home Purchase Loans
C) Refinancings
D) Home Improvement Loans
F) Non-occupant Loans on < 5 Family Dwellings (A B C & D)
G) Loans On Manufactured Home Dwelling (A B C & D)
Number
Average Value
Number
Average Value
Number
Average Value
Number
Average Value
Number
Average Value
Number
Average Value
LOANS ORIGINATED
9
$90,639
64
$156,773
90
$119,084
18
$55,233
28
$186,948
15
$76,180
APPLICATIONS APPROVED, NOT ACCEPTED
2
$104,060
3
$153,760
13
$179,514
1
$12,680
1
$206,070
2
$107,755
APPLICATIONS DENIED
1
$113,520
13
$86,498
63
$138,429
14
$56,443
4
$81,388
10
$58,984
APPLICATIONS WITHDRAWN
1
$84,000
2
$137,540
31
$160,410
3
$60,577
1
$96,340
2
$64,940
FILES CLOSED FOR INCOMPLETENESS
0
$0
0
$0
15
$145,645
1
$51,460
0
$0
0
$0
Aggregated Statistics For Year 2005 (Based on 4 partial tracts)
A) FHA, FSA/RHS & VA Home Purchase Loans
B) Conventional Home Purchase Loans
C) Refinancings
D) Home Improvement Loans
E) Loans on Dwellings For 5+ Families
F) Non-occupant Loans on < 5 Family Dwellings (A B C & D)
G) Loans On Manufactured Home Dwelling (A B C & D)
Number
Average Value
Number
Average Value
Number
Average Value
Number
Average Value
Number
Average Value
Number
Average Value
Number
Average Value
LOANS ORIGINATED
2
$109,240
62
$147,625
113
$133,748
16
$58,659
1
$105,950
28
$178,476
13
$85,852
APPLICATIONS APPROVED, NOT ACCEPTED
2
$73,030
12
$97,564
17
$114,668
1
$69,910
0
$0
2
$103,915
3
$70,190
APPLICATIONS DENIED
1
$142,790
15
$86,104
78
$113,452
9
$39,131
0
$0
2
$95,375
12
$82,672
APPLICATIONS WITHDRAWN
1
$127,660
5
$166,600
41
$134,675
5
$130,836
0
$0
3
$153,260
1
$100,610
FILES CLOSED FOR INCOMPLETENESS
0
$0
1
$254,410
23
$151,751
1
$52,980
0
$0
3
$135,777
1
$7,570
Aggregated Statistics For Year 2004 (Based on 4 partial tracts)
A) FHA, FSA/RHS & VA Home Purchase Loans
B) Conventional Home Purchase Loans
C) Refinancings
D) Home Improvement Loans
F) Non-occupant Loans on < 5 Family Dwellings (A B C & D)
G) Loans On Manufactured Home Dwelling (A B C & D)
Detailed PMIC statistics for the following Tracts:0001.00
, 0010.00
2002 - 2018 National Fire Incident Reporting System (NFIRS) incidents
According to the data from the years 2002 - 2018 the average number of fire incidents per year is 10. The highest number of fire incidents - 24 took place in 2003, and the least - 0 in 2007. The data has an increasing trend.
When looking into fire subcategories, the most incidents belonged to: Structure Fires (43.4%), and Outside Fires (35.5%).
Fire incident types reported to NFIRS in Zip Code 49061

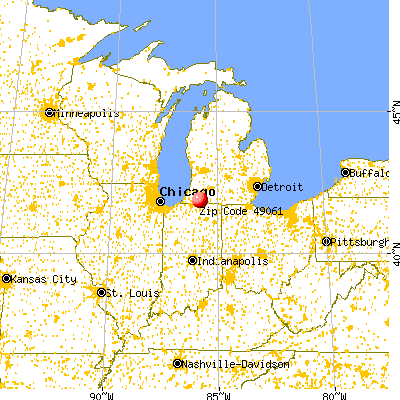


 Nearest zip codes: 49095, 49130, 49042, 49067, 46507, 49031.


 According to the data from the years 2002 - 2018 the average number of fire incidents per year is 10. The highest number of fire incidents - 24 took place in 2003, and the least - 0 in 2007. The data has an increasing trend.
 When looking into fire subcategories, the most incidents belonged to: Structure Fires (43.4%), and Outside Fires (35.5%).