Estimated zip code population in 2022: 6,153 Zip code population in 2010: 6,126 Zip code population in 2000: 5,488
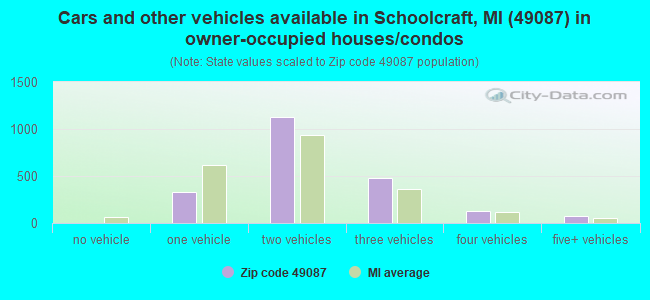
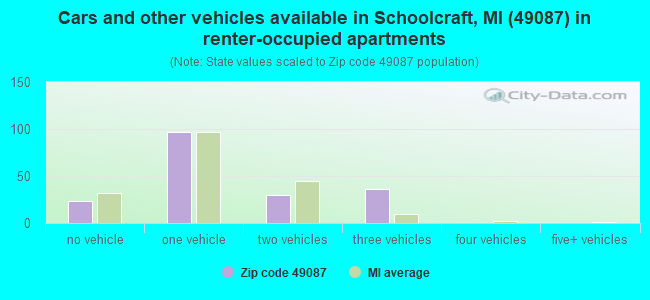
Houses and condos: 2,467 Renter-occupied apartments: 187
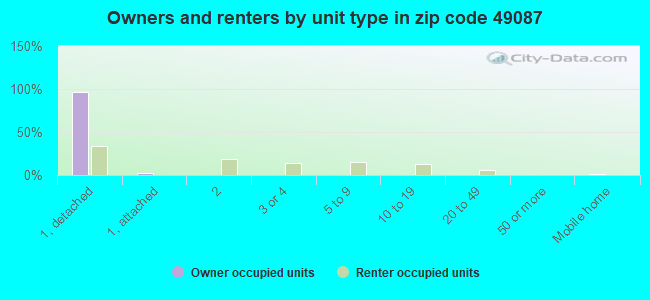
% of renters here:
8%
State:
27%
March 2022 cost of living index in zip code 49087: 81.7 (low, U.S. average is 100)
Land area: 60.7 sq. mi. Water area: 1.7 sq. mi.
Population density: 101 people per square mile
(very low).
OSM Map
General Map
Google Map
MSN Map
OSM Map
General Map
Google Map
MSN Map
OSM Map
General Map
Google Map
MSN Map
OSM Map
General Map
Google Map
MSN Map
Please wait while loading the map...
Real estate property taxes paid for housing units in 2022:
This zip code:
1.1% ($3,357)
Michigan:
1.2% ($2,746)
Median real estate property taxes paid for housing units with mortgages in 2022: $3,507 (1.1%) Median real estate property taxes paid for housing units with no mortgage in 2022: $3,165 (1.2%)
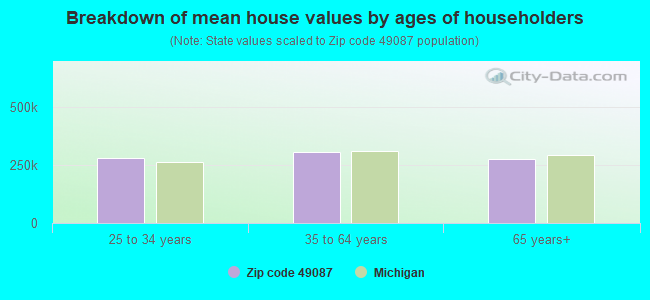
Estimated median house/condo value in 2022: $299,163
49087:
$299,163
Michigan:
$224,400
According to our research of Michigan and other state lists, there were 12 registered sex offenders living in 49087 zip code as of May 14, 2024. The ratio of all residents to sex offenders in zip code 49087 is 538 to 1. The ratio of registered sex offenders to all residents in this zip code is lower than the state average.
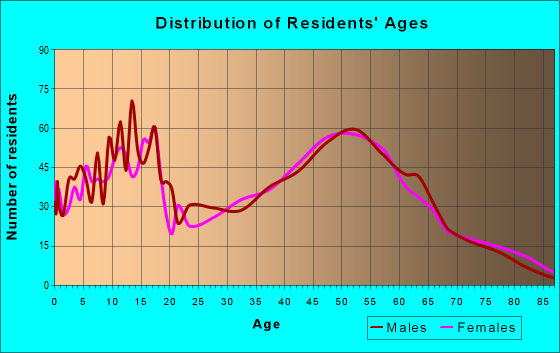
Median resident age:
This zip code:
45.6 years
Michigan median age:
40.3 years
Average household size:
This zip code:
2.6 people
Michigan:
2.4 people
Averages for the 2020 tax year for zip code 49087, filed in 2021:
Average Adjusted Gross Income (AGI) in 2020: $88,935 (Individual Income Tax Returns)
Here:
$88,935
State:
$68,945
Salary/wage: $72,327 (reported on 78.4% of returns)
Here:
$72,327
State:
$57,142
(% of AGI for various income ranges: 962.5% for AGIs below $25k, 3185.1% for AGIs $25k-50k, 6225.9% for AGIs $50k-75k, 8817.7% for AGIs $75k-100k, 17368.8% for AGIs $100k-200k, 72053.3% for AGIs over 200k)
Taxable interest for individuals: $2,100 (reported on 45.1% of returns)
This zip code:
$2,100
Michigan:
$1,630
(% of AGI for various income ranges: 18.5% for AGIs below $25k, 34.4% for AGIs $25k-50k, 60.0% for AGIs $50k-75k, 48.5% for AGIs $75k-100k, 120.7% for AGIs $100k-200k, 3106.7% for AGIs over 200k)
Ordinary dividends: $5,499 (reported on 25.8% of returns)
Here:
$5,499
State:
$6,972
(% of AGI for various income ranges: 41.5% for AGIs below $25k, 68.0% for AGIs $25k-50k, 104.1% for AGIs $50k-75k, 150.4% for AGIs $75k-100k, 237.6% for AGIs $100k-200k, 3630.0% for AGIs over 200k)
Net capital gain/loss in AGI: +$11,641 (reported on 24.2% of returns)
Here:
+$11,641
State:
+$20,064
(% of AGI for various income ranges: 21.9% for AGIs below $25k, 44.1% for AGIs $25k-50k, 128.6% for AGIs $50k-75k, 185.4% for AGIs $75k-100k, 439.3% for AGIs $100k-200k, 9435.0% for AGIs over 200k)
Profit/loss from business: +$17,824 (reported on 15.0% of returns)
Here:
+$17,824
State:
+$11,172
(% of AGI for various income ranges: 100.6% for AGIs below $25k, 197.6% for AGIs $25k-50k, 253.4% for AGIs $50k-75k, 266.5% for AGIs $75k-100k, 781.0% for AGIs $100k-200k, 3710.0% for AGIs over 200k)
Taxable individual retirement arrangement distribution: $24,609 (reported on 14.7% of returns)
49087:
$24,609
Michigan:
$19,803
(% of AGI for various income ranges: 137.4% for AGIs below $25k, 216.6% for AGIs $25k-50k, 421.7% for AGIs $50k-75k, 706.2% for AGIs $75k-100k, 1118.3% for AGIs $100k-200k, 3023.3% for AGIs over 200k)
Self-employed (Keogh) retirement plans: $22,100 (reported on 1.0% of returns)
49087:
$22,100
Michigan:
$25,132
(% of AGI for various income ranges: 161.7% for AGIs $100k-200k)
Total itemized deductions: $32,391 (reported on 7.2% of returns)
Here:
$32,391
State:
$34,117
(% of AGI for various income ranges: 90.8% for AGIs below $25k, 161.7% for AGIs $50k-75k, 282.3% for AGIs $75k-100k, 662.2% for AGIs $100k-200k, 4545.0% for AGIs over 200k)
Charity contributions: $12,106 (reported on 5.9% of returns)
Here:
$12,106
State:
$13,548
(% of AGI for various income ranges: 16.0% for AGIs below $25k, 60.8% for AGIs $75k-100k, 190.0% for AGIs $100k-200k, 1928.3% for AGIs over 200k)
Taxes paid: $8,295 (reported on 7.2% of returns)
49087:
$8,295
State:
$7,972
(% of AGI for various income ranges: 15.3% for AGIs below $25k, 39.3% for AGIs $50k-75k, 85.4% for AGIs $75k-100k, 183.7% for AGIs $100k-200k, 1091.7% for AGIs over 200k)
Earned income credit: $1,887 (reported on 7.5% of returns)
Here:
$1,887
State:
$2,251
(% of AGI for various income ranges: 43.8% for AGIs below $25k, 49.3% for AGIs $25k-50k)
Percentage of individuals using paid preparers for their 2020 taxes: 93.1%
Here:
93%
State:
93%
(% for various income ranges: 90.1% for AGIs below $25k, 92.9% for AGIs $25k-50k, 95.2% for AGIs $50k-75k, 94.6% for AGIs $75k-100k, 93.0% for AGIs $100k-200k, 100.0% for AGIs over 200k)
Averages for the 2012 tax year for zip code 49087, filed in 2013:
Average Adjusted Gross Income (AGI) in 2012: $64,201 (Individual Income Tax Returns)
Here:
$64,201
State:
$55,609
Salary/wage: $54,862 (reported on 83.5% of returns)
Here:
$54,862
State:
$46,782
(% of AGI for various income ranges: 69.0% for AGIs below $25k, 71.1% for AGIs $25k-50k, 78.1% for AGIs $50k-75k, 78.3% for AGIs $75k-100k, 78.6% for AGIs $100k-200k, 51.1% for AGIs over 200k)
Taxable interest for individuals: $1,250 (reported on 41.8% of returns)
This zip code:
$1,250
Michigan:
$1,491
(% of AGI for various income ranges: 1.2% for AGIs below $25k, 0.8% for AGIs $25k-50k, 1.0% for AGIs $50k-75k, 0.7% for AGIs $75k-100k, 0.7% for AGIs $100k-200k, 0.9% for AGIs over 200k)
Ordinary dividends: $6,356 (reported on 23.9% of returns)
Here:
$6,356
State:
$6,225
(% of AGI for various income ranges: 2.5% for AGIs below $25k, 1.8% for AGIs $25k-50k, 0.6% for AGIs $50k-75k, 0.9% for AGIs $75k-100k, 1.3% for AGIs $100k-200k, 6.7% for AGIs over 200k)
Net capital gain/loss in AGI: +$8,398 (reported on 19.5% of returns)
Here:
+$8,398
State:
+$9,326
(% of AGI for various income ranges: 0.5% for AGIs $50k-75k, 0.9% for AGIs $75k-100k, 1.1% for AGIs $100k-200k, 9.7% for AGIs over 200k)
Profit/loss from business: +$9,604 (reported on 16.2% of returns)
Here:
+$9,604
State:
+$11,523
(% of AGI for various income ranges: 4.7% for AGIs below $25k, 3.8% for AGIs $25k-50k, 2.5% for AGIs $50k-75k, 1.6% for AGIs $75k-100k, 2.7% for AGIs $100k-200k, 1.4% for AGIs over 200k)
Taxable individual retirement arrangement distribution: $17,692 (reported on 13.5% of returns)
49087:
$17,692
Michigan:
$15,298
(% of AGI for various income ranges: 5.6% for AGIs below $25k, 4.9% for AGIs $25k-50k, 4.0% for AGIs $50k-75k, 5.4% for AGIs $75k-100k, 4.4% for AGIs $100k-200k)
Self-employment retirement plans: $14,000 (reported on 1.0% of returns)
49087:
$14,000
Michigan:
$20,834
Total itemized deductions: $19,925 (18% of AGI, reported on 39.7% of returns)
Here:
$19,925
State:
$21,628
Here:
17.7% of AGI
State:
18.4% of AGI
(% of AGI for various income ranges: 8.2% for AGIs below $25k, 11.8% for AGIs $25k-50k, 12.4% for AGIs $50k-75k, 13.4% for AGIs $75k-100k, 14.4% for AGIs $100k-200k, 9.7% for AGIs over 200k)
Charity contributions: $3,834 (reported on 33.3% of returns)
Here:
$3,834
State:
$4,225
(% of AGI for various income ranges: 0.6% for AGIs below $25k, 1.5% for AGIs $25k-50k, 1.9% for AGIs $50k-75k, 2.0% for AGIs $75k-100k, 2.6% for AGIs $100k-200k, 1.8% for AGIs over 200k)
Taxes paid: $7,942 (reported on 39.7% of returns)
49087:
$7,942
State:
$8,327
(% of AGI for various income ranges: 1.8% for AGIs below $25k, 3.4% for AGIs $25k-50k, 4.2% for AGIs $50k-75k, 5.0% for AGIs $75k-100k, 6.0% for AGIs $100k-200k, 5.4% for AGIs over 200k)
Earned income credit: $1,970 (reported on 10.1% of returns)
Here:
$1,970
State:
$2,306
(% of AGI for various income ranges: 3.5% for AGIs below $25k, 1.0% for AGIs $25k-50k)
Percentage of individuals using paid preparers for their 2012 taxes: 55.2%
Here:
55%
State:
57%
(% for various income ranges: 49.1% for AGIs below $25k, 53.6% for AGIs $25k-50k, 57.1% for AGIs $50k-75k, 55.3% for AGIs $75k-100k, 64.4% for AGIs $100k-200k, 80.0% for AGIs over 200k)
Averages for the 2004 tax year for zip code 49087, filed in 2005:
Average Adjusted Gross Income (AGI) in 2004: $58,935 (Individual Income Tax Returns)
Here:
$58,935
State:
$48,204
Salary/wage: $49,523 (reported on 86.7% of returns)
Here:
$49,523
State:
$42,791
(% of AGI for various income ranges: 156.9% for AGIs below $10k, 74.5% for AGIs $10k-25k, 77.2% for AGIs $25k-50k, 84.1% for AGIs $50k-75k, 85.3% for AGIs $75k-100k, 61.4% for AGIs over 100k)
Taxable interest for individuals: $2,057 (reported on 54.4% of returns)
This zip code:
$2,057
Michigan:
$1,725
(% of AGI for various income ranges: 8.5% for AGIs below $10k, 2.8% for AGIs $10k-25k, 1.4% for AGIs $25k-50k, 0.8% for AGIs $50k-75k, 1.1% for AGIs $75k-100k, 2.5% for AGIs over 100k)
Taxable dividends: $2,134 (reported on 28.6% of returns)
Here:
$2,134
State:
$3,420
(% of AGI for various income ranges: 9.3% for AGIs below $10k, 0.8% for AGIs $10k-25k, 0.7% for AGIs $25k-50k, 0.5% for AGIs $50k-75k, 0.8% for AGIs $75k-100k, 1.3% for AGIs over 100k)
Net capital gain/loss: +$6,323 (reported on 22.2% of returns)
Here:
+$6,323
State:
+$8,532
(% of AGI for various income ranges: -5.7% for AGIs below $10k, 0.3% for AGIs $10k-25k, -0.5% for AGIs $25k-50k, 1.0% for AGIs $50k-75k, 1.4% for AGIs $75k-100k, 4.3% for AGIs over 100k)
Profit/loss from business: +$11,082 (reported on 16.4% of returns)
Here:
+$11,082
State:
+$9,547
(% of AGI for various income ranges: -10.2% for AGIs below $10k, 4.7% for AGIs $10k-25k, 4.6% for AGIs $25k-50k, 3.7% for AGIs $50k-75k, 1.8% for AGIs $75k-100k, 3.0% for AGIs over 100k)
IRA payment deduction: $2,962 (reported on 2.8% of returns)
49087:
$2,962
Michigan:
$2,875
(% of AGI for various income ranges: 0.3% for AGIs $10k-25k, 0.2% for AGIs $25k-50k, 0.3% for AGIs $50k-75k, 0.1% for AGIs $75k-100k, 0.1% for AGIs over 100k)
Self-employed pension: $7,750 (reported on 1.3% of returns)
Here:
$7,750
Michigan:
$13,826
Total itemized deductions: $16,850 (17% of AGI, reported on 44.3% of returns)
Here:
$16,850
State:
$18,509
Here:
17.5% of AGI
State:
20.7% of AGI
(% of AGI for various income ranges: 22.9% for AGIs below $10k, 9.2% for AGIs $10k-25k, 13.4% for AGIs $25k-50k, 15.9% for AGIs $50k-75k, 16.2% for AGIs $75k-100k, 10.2% for AGIs over 100k)
Charity contributions deductions: $2,741 (3% of AGI, reported on 39.7% of returns)
Here:
$2,741
State:
$3,365
Here:
2.7% of AGI
State:
3.6% of AGI
(% of AGI for various income ranges: 1.6% for AGIs below $10k, 1.1% for AGIs $10k-25k, 1.5% for AGIs $25k-50k, 2.1% for AGIs $50k-75k, 2.3% for AGIs $75k-100k, 1.7% for AGIs over 100k)
Total tax: $9,755 (reported on 78.6% of returns)
49087:
$9,755
State:
$7,691
(% of AGI for various income ranges: 4.3% for AGIs below $10k, 4.9% for AGIs $10k-25k, 6.8% for AGIs $25k-50k, 8.2% for AGIs $50k-75k, 9.6% for AGIs $75k-100k, 18.6% for AGIs over 100k)
Earned income credit: $1,350 (reported on 7.7% of returns)
Here:
$1,350
State:
$1,737
Percentage of individuals using paid preparers for their 2004 taxes: 57.3%
Here:
57%
State:
60%
(% for various income ranges: 50.8% for AGIs below $10k, 51.7% for AGIs $10k-25k, 63.2% for AGIs $25k-50k, 58.7% for AGIs $50k-75k, 59.6% for AGIs $75k-100k, 62.8% for AGIs over 100k)
Household received Food Stamps/SNAP in the past 12 months: 95 Household did not receive Food Stamps/SNAP in the past 12 months: 2,224
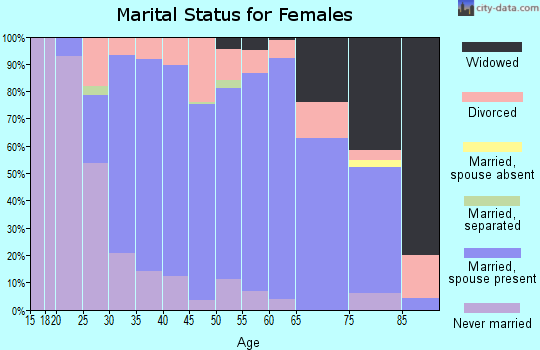
Women who had a birth in the past 12 months: 42 (43 now married, 0 unmarried) Women who did not have a birth in the past 12 months: 1,133 (637 now married, 492 unmarried)
Housing units in zip code 49087 with a mortgage: 1,307 (162 second mortgage, 4 home equity loan, 128 both second mortgage and home equity loan) Houses without a mortgage: 16
Median monthly owner costs for units with a mortgage: $1,623 Median monthly owner costs for units without a mortgage: $604
Residents with income below the poverty level in 2022:
This zip code:
5.4%
Whole state:
13.4%
Residents with income below 50% of the poverty level in 2022:
This zip code:
2.5%
Whole state:
6.9%
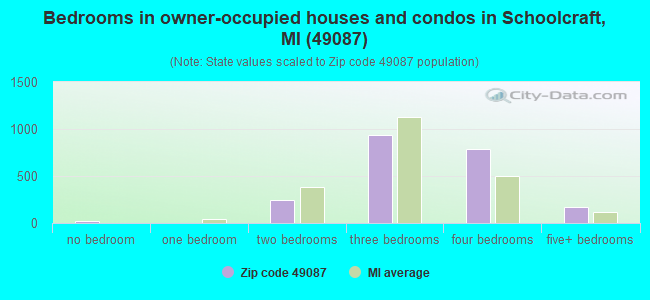
Median number of rooms in houses and condos:
Here:
7.3
State:
6.5
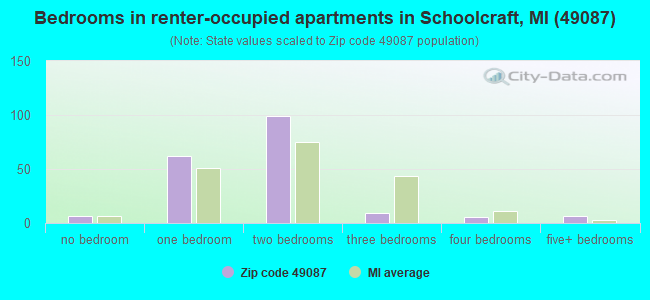
Median number of rooms in apartments:
Here:
3.7
State:
4.3
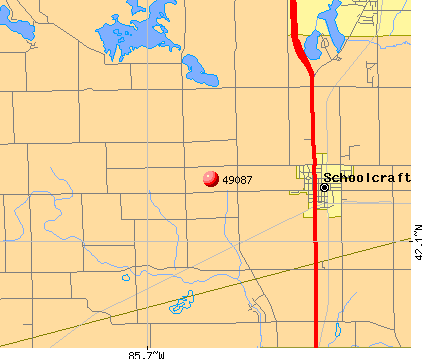
Notable locations in this zip code not listed on our city pages
Notable locations in zip code 49087: Schoolcraft Station (A), Olde Mill Golf Club (B), States Golf Club (C), Schoolcraft Police Department (D), Schoolcraft Fire Department (E), Schoolcraft Community Library (F), South Kalamazoo County Fire Authority Station 1 (G). Display/hide their locations on the map
Churches in zip code 49087 include: Pleasant Valley Church (A), Schoolcraft United Methodist Church (B), Schoolcraft Assembly of God Church (C). Display/hide their locations on the map
Cemeteries: Harrison Cemetery (1), Kern Cemetery (2), Schoolcraft Cemetery (3), Shaver Cemetery (4), Pleasant Valley Cemetery (5). Display/hide their locations on the map
In group quarters: 14 (-1 institutionalized population)
Size of family households: 933 2-persons, 290 3-persons, 283 4-persons, 236 5-persons, 44 6-persons, 15 7-or-more-persons
Size of nonfamily households: 458 1-person, 58 2-persons, 5 6-persons
1,216 married couples with children.
138 single-parent households (29 men, 109 women).
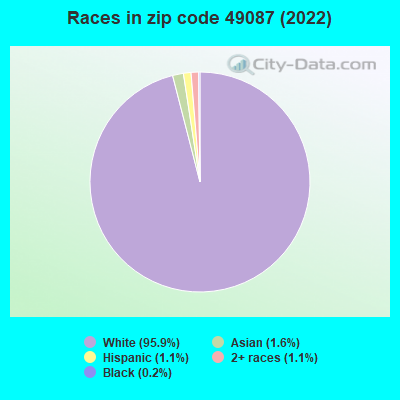
97.3% of residents of 49087 zip code speak English at home.
0.7% of residents speak Spanish at home (93% very well, 7% not well).
1.3% of residents speak other Indo-European language at home (100% very well).
0.5% of residents speak Asian or Pacific Island language at home (100% very well).
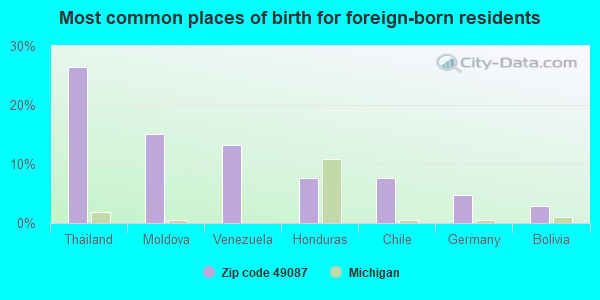
Foreign born population: 107 (1.7%) (76.4% of them are naturalized citizens)
This zip code:
1.7%
Whole state:
6.9%
26%Thailand
15%Moldova
13%Venezuela
8%Honduras
8%Chile
5%Germany
3%Bolivia
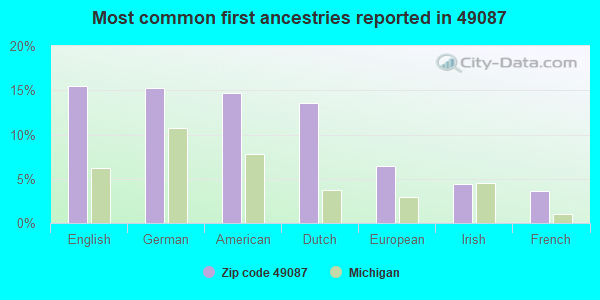
15%English
15%German
15%American
14%Dutch
6%European
4%Irish
4%French
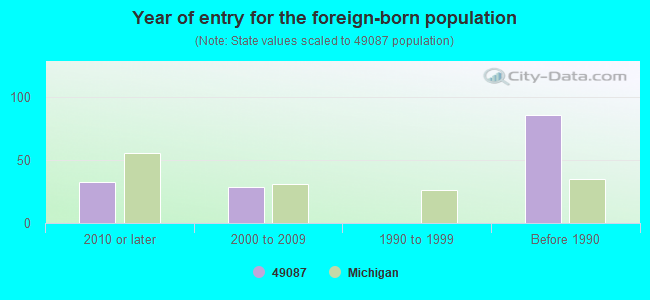
Year of entry for the foreign-born population
332010 or later
292000 to 2009
01990 to 1999
86Before 1990
Facilities with environmental interests located in this zip code:
MDEQ-ERD-ARCO IND CORP (ARCO INDUSTRIES CORP in SCHOOLCRAFT, MI)
National Pollutant Discharge Elimination System NON-MAJOR (Tracking pollutant discharge elimination systems) - permit Business SIC classification: NONCLASSIFIABLE ESTABLISHMENTS
MI DEPT/ENVIRONMENTAL QUALITY (429 S GRAND ST in SCHOOLCRAFT, MI)
(Resource Conservation and Recovery Act (tracking hazardous waste)) Organizations: HOWARD HILDEBRAND (CONTACT/OWNER)
Alternative names: SCHOOLCRAFT ORGANICS PLUME E/DEQ-ERD
MI DEPT/NATURAL RESOURCES (HALF MI S W AVE ON 16TH ST in SCHOOLCRAFT, MI)
(Resource Conservation and Recovery Act (tracking hazardous waste)) Organizations: STATE OF MICHIGAN DNR (CONTACT/OPERATOR)
Alternative names: MIDNR SCHOOLCRAFT TREATMENT SITE
DRAKES FUEL SVC INC (225 ELM in SCHOOLCRAFT, MI)
(Resource Conservation and Recovery Act (tracking hazardous waste)) Business NAICS classification: HEATING OIL DEALERS.
A TECH MOLDS INC (11825 SHAVER RD in SCHOOLCRAFT, MI)
(Resource Conservation and Recovery Act (tracking hazardous waste))
ARCO INDUSTRIES CORP (432 E ELIZA ST in SCHOOLCRAFT, MI)
(Resource Conservation and Recovery Act (tracking hazardous waste))
BALKEMA EXCAVATING (4TH STREET AGGREGATES PLANT in SCHOOLCRAFT, MI)
AIR MINOR (AIRS/AFS) Business SIC classification: CONSTRUCTION SAND AND GRAVEL
MI DEPT/STATE POLICE (11473 SHAVER RD LOT 40 in SCHOOLCRAFT, MI)
(Resource Conservation and Recovery Act (tracking hazardous waste)) Alternative names: MI DEPT/STATE POLICE (E)
METAL MECHANICS INC (3093 HAGER RD in SCHOOLCRAFT, MI)
Conditionally Exempt Small Quantity Generators, less than 100 kg/month of hazardous waste (Resource Conservation and Recovery Act (tracking hazardous waste)) - notification Organizations: BARBARA & JAMES DAILEY (CONTACT/OWNER)
4TH STREET AGGREGATES (8964 PAW PAW LAKE DRIVE in SCHOOLCRAFT, MI)
CRITERIA AND HAZARDOUS AIR POLLUTANT INVENTORY (Inventory of air pollution sources) Business SIC classification: CONSTRUCTION SAND AND GRAVEL
Housing units lacking complete plumbing facilities: 2.5% Housing units lacking complete kitchen facilities: 2.7%
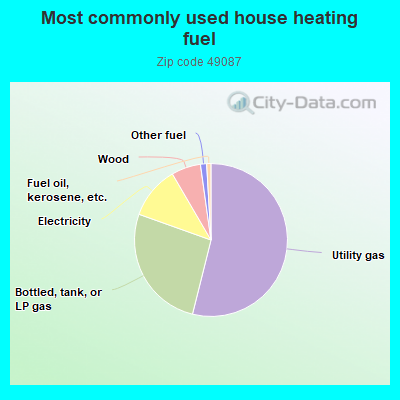
53.8%Utility gas
26.5%Bottled, tank, or LP gas
11.1%Electricity
6.2%Wood
1.3%Other fuel
0.9%Fuel oil, kerosene, etc.
Population in 1990: 5,324. Population change in the 1990s: +164 (+3.1%).
Place of birth for U.S.-born residents:
This state: 4,908
Northeast: 51
Midwest: 577
South: 217
West: 251
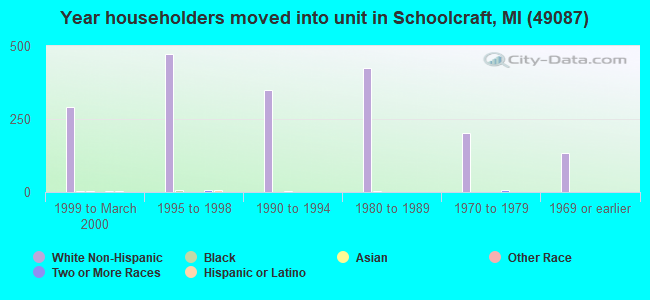
64% of the 49087 zip code residents lived in the same house 5 years ago. Out of people who lived in different houses, 60% lived in this county. Out of people who lived in different counties, 50% lived in Michigan.
93% of the 49087 zip code residents lived in the same house 1 year ago. Out of people who lived in different houses, 61% moved from this county. Out of people who lived in different houses, 32% moved from different county within same state. Out of people who lived in different houses, 7% moved from different state.
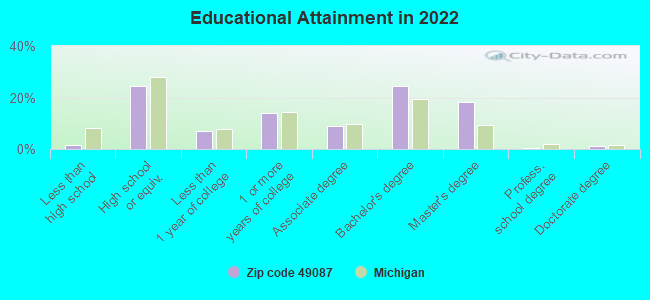
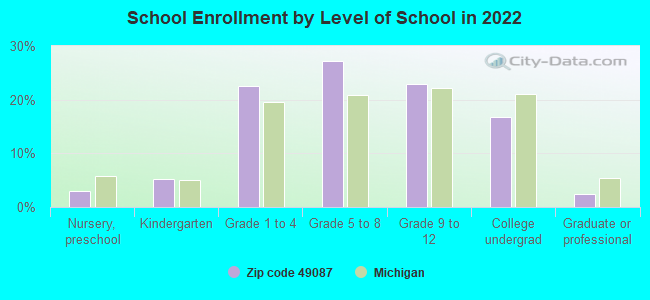
Private vs. public school enrollment:
Students in private schools in grades 1 to 8 (elementary and middle school): 99
Here:
12.8%
Michigan:
12.4%
Students in private schools in grades 9 to 12 (high school): 19
Here:
5.5%
Michigan:
9.8%
Students in private undergraduate colleges: 5
Here:
2.2%
Michigan:
14.9%
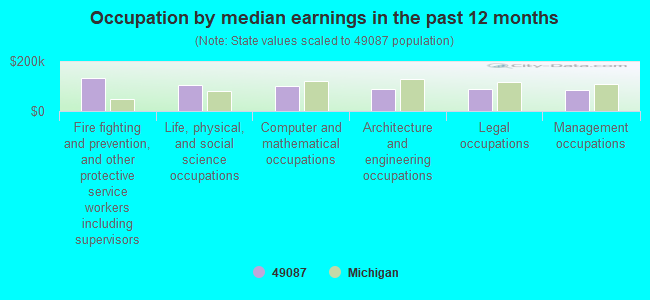
Occupation by median earnings in the past 12 months ($)
133,471Fire fighting and prevention, and other protective service workers including supervisors
103,724Life, physical, and social science occupations
100,812Computer and mathematical occupations
87,625Architecture and engineering occupations
87,290Legal occupations
85,990Management occupations
Top industries in this zip code by the number of employees in 2005:
Wholesale Trade: Men's and Boys' Clothing and Furnishings Merchant Wholesalers (250-499 employees: 1 establishment)
Accommodation and Food Services: Limited-Service Restaurants (50-99: 1, 20-49: 1)
Health Care and Social Assistance: Nursing Care Facilities (50-99: 1)
Arts, Entertainment, and Recreation: Independent Artists, Writers, and Performers (50-99: 1)
Accommodation and Food Services: Full-Service Restaurants (20-49: 2)
People in group quarters in 2010:
6 people in residential treatment centers for adults
5 people in nursing facilities/skilled-nursing facilities
People in group quarters in 2000:
12 people in other noninstitutional group quarters
5 people in other workers' dormitories
2 people in homes for the mentally ill
2 people in homes for the mentally retarded
2 people in other group homes
Fatal accident statistics in 2014:
Fatal accident count: 3
Vehicles involved in fatal accidents: 11
Fatal accidents caused by drunken drivers: 0
Fatalities: 3
Persons involved in fatal accidents: 12
Pedestrians involved in fatal accidents: 0
Fatal accident statistics in 2012:
Fatal accident count: 1
Vehicles involved in fatal accidents: 1
Fatal accidents caused by drunken drivers: 0
Fatalities: 1
Persons involved in fatal accidents: 1
Pedestrians involved in fatal accidents: 1
Home Mortgage Disclosure Act Aggregated Statistics For Year 2009 (Based on 3 full and 6 partial tracts)
A) FHA, FSA/RHS & VA Home Purchase Loans
B) Conventional Home Purchase Loans
C) Refinancings
D) Home Improvement Loans
F) Non-occupant Loans on < 5 Family Dwellings (A B C & D)
G) Loans On Manufactured Home Dwelling (A B C & D)
Number
Average Value
Number
Average Value
Number
Average Value
Number
Average Value
Number
Average Value
Number
Average Value
LOANS ORIGINATED
108
$155,033
97
$183,699
500
$195,398
17
$70,415
11
$183,779
6
$43,145
APPLICATIONS APPROVED, NOT ACCEPTED
3
$213,267
4
$147,308
45
$206,751
0
$0
1
$224,900
1
$6,870
APPLICATIONS DENIED
10
$151,828
6
$249,962
119
$179,448
9
$39,842
7
$147,716
1
$42,980
APPLICATIONS WITHDRAWN
8
$120,335
11
$189,557
93
$180,698
5
$122,132
4
$154,428
1
$131,250
FILES CLOSED FOR INCOMPLETENESS
2
$158,935
3
$64,683
21
$183,670
1
$152,600
0
$0
1
$52,230
Aggregated Statistics For Year 2008 (Based on 3 full and 6 partial tracts)
A) FHA, FSA/RHS & VA Home Purchase Loans
B) Conventional Home Purchase Loans
C) Refinancings
D) Home Improvement Loans
E) Loans on Dwellings For 5+ Families
F) Non-occupant Loans on < 5 Family Dwellings (A B C & D)
G) Loans On Manufactured Home Dwelling (A B C & D)
Number
Average Value
Number
Average Value
Number
Average Value
Number
Average Value
Number
Average Value
Number
Average Value
Number
Average Value
LOANS ORIGINATED
52
$172,053
172
$189,071
252
$170,853
21
$48,505
1
$188,000
14
$118,299
9
$38,210
APPLICATIONS APPROVED, NOT ACCEPTED
2
$175,625
13
$214,082
30
$182,243
1
$51,540
0
$0
2
$157,690
1
$17,310
APPLICATIONS DENIED
10
$119,001
15
$135,594
105
$180,447
9
$68,198
0
$0
6
$155,613
5
$19,738
APPLICATIONS WITHDRAWN
3
$169,407
11
$160,807
59
$180,282
4
$51,560
0
$0
4
$91,658
0
$0
FILES CLOSED FOR INCOMPLETENESS
1
$181,270
3
$175,677
12
$193,900
1
$17,000
0
$0
1
$207,400
0
$0
Aggregated Statistics For Year 2007 (Based on 3 full and 6 partial tracts)
A) FHA, FSA/RHS & VA Home Purchase Loans
B) Conventional Home Purchase Loans
C) Refinancings
D) Home Improvement Loans
F) Non-occupant Loans on < 5 Family Dwellings (A B C & D)
G) Loans On Manufactured Home Dwelling (A B C & D)
Number
Average Value
Number
Average Value
Number
Average Value
Number
Average Value
Number
Average Value
Number
Average Value
LOANS ORIGINATED
21
$151,685
267
$163,103
315
$147,183
52
$44,182
29
$144,360
4
$44,278
APPLICATIONS APPROVED, NOT ACCEPTED
0
$0
19
$222,089
56
$163,231
6
$37,322
7
$158,133
2
$29,170
APPLICATIONS DENIED
1
$135,020
35
$227,345
147
$149,752
17
$48,812
11
$150,478
4
$45,048
APPLICATIONS WITHDRAWN
1
$184,610
21
$147,492
50
$202,868
11
$107,284
6
$176,157
0
$0
FILES CLOSED FOR INCOMPLETENESS
0
$0
6
$135,743
10
$202,111
1
$35,000
1
$196,710
0
$0
Aggregated Statistics For Year 2006 (Based on 3 full and 6 partial tracts)
A) FHA, FSA/RHS & VA Home Purchase Loans
B) Conventional Home Purchase Loans
C) Refinancings
D) Home Improvement Loans
F) Non-occupant Loans on < 5 Family Dwellings (A B C & D)
G) Loans On Manufactured Home Dwelling (A B C & D)
Number
Average Value
Number
Average Value
Number
Average Value
Number
Average Value
Number
Average Value
Number
Average Value
LOANS ORIGINATED
19
$177,148
293
$167,944
312
$139,038
68
$60,785
28
$204,172
10
$53,091
APPLICATIONS APPROVED, NOT ACCEPTED
0
$0
29
$190,374
74
$153,523
7
$50,094
6
$166,658
2
$46,085
APPLICATIONS DENIED
2
$79,500
28
$142,407
185
$152,653
28
$71,392
5
$307,392
16
$77,911
APPLICATIONS WITHDRAWN
1
$78,050
26
$155,260
90
$158,686
8
$85,739
6
$326,258
2
$26,210
FILES CLOSED FOR INCOMPLETENESS
0
$0
4
$170,692
35
$180,679
0
$0
0
$0
0
$0
Aggregated Statistics For Year 2005 (Based on 3 full and 6 partial tracts)
A) FHA, FSA/RHS & VA Home Purchase Loans
B) Conventional Home Purchase Loans
C) Refinancings
D) Home Improvement Loans
E) Loans on Dwellings For 5+ Families
F) Non-occupant Loans on < 5 Family Dwellings (A B C & D)
G) Loans On Manufactured Home Dwelling (A B C & D)
Number
Average Value
Number
Average Value
Number
Average Value
Number
Average Value
Number
Average Value
Number
Average Value
Number
Average Value
LOANS ORIGINATED
8
$141,988
379
$167,863
420
$153,701
42
$62,279
1
$40,910
28
$127,382
22
$49,610
APPLICATIONS APPROVED, NOT ACCEPTED
1
$45,950
26
$184,317
49
$155,779
5
$64,258
0
$0
3
$100,610
7
$46,881
APPLICATIONS DENIED
2
$84,210
37
$94,548
176
$159,360
29
$55,735
0
$0
13
$114,198
24
$55,478
APPLICATIONS WITHDRAWN
1
$108,580
25
$184,910
119
$168,738
8
$66,280
0
$0
5
$152,866
4
$107,668
FILES CLOSED FOR INCOMPLETENESS
0
$0
17
$102,135
52
$170,793
1
$13,740
0
$0
2
$124,750
2
$99,960
Aggregated Statistics For Year 2004 (Based on 3 full and 6 partial tracts)
A) FHA, FSA/RHS & VA Home Purchase Loans
B) Conventional Home Purchase Loans
C) Refinancings
D) Home Improvement Loans
F) Non-occupant Loans on < 5 Family Dwellings (A B C & D)
G) Loans On Manufactured Home Dwelling (A B C & D)
Number
Average Value
Number
Average Value
Number
Average Value
Number
Average Value
Number
Average Value
Number
Average Value
LOANS ORIGINATED
12
$120,637
303
$179,843
520
$144,238
42
$79,991
26
$132,022
22
$66,135
APPLICATIONS APPROVED, NOT ACCEPTED
0
$0
32
$176,688
82
$136,804
6
$21,290
1
$98,610
6
$52,085
APPLICATIONS DENIED
1
$91,000
31
$99,143
171
$128,133
26
$36,941
10
$131,171
25
$46,958
APPLICATIONS WITHDRAWN
1
$86,860
23
$240,091
96
$154,895
9
$81,457
8
$178,378
1
$22,680
FILES CLOSED FOR INCOMPLETENESS
0
$0
2
$176,935
42
$156,161
1
$78,670
0
$0
2
$112,955
Aggregated Statistics For Year 2003 (Based on 3 full and 6 partial tracts)
A) FHA, FSA/RHS & VA Home Purchase Loans
B) Conventional Home Purchase Loans
C) Refinancings
D) Home Improvement Loans
E) Loans on Dwellings For 5+ Families
F) Non-occupant Loans on < 5 Family Dwellings (A B C & D)
Number
Average Value
Number
Average Value
Number
Average Value
Number
Average Value
Number
Average Value
Number
Average Value
LOANS ORIGINATED
13
$122,499
282
$172,419
1,379
$145,694
53
$38,373
1
$547,540
29
$118,121
APPLICATIONS APPROVED, NOT ACCEPTED
1
$148,000
30
$162,455
159
$147,221
4
$16,465
0
$0
3
$110,417
APPLICATIONS DENIED
0
$0
31
$103,864
271
$129,610
15
$20,390
0
$0
14
$129,729
APPLICATIONS WITHDRAWN
1
$119,570
26
$154,964
156
$144,469
4
$60,580
0
$0
3
$137,577
FILES CLOSED FOR INCOMPLETENESS
0
$0
5
$119,032
30
$153,012
4
$57,755
0
$0
3
$154,470
Aggregated Statistics For Year 2002 (Based on 3 full and 2 partial tracts)
A) FHA, FSA/RHS & VA Home Purchase Loans
B) Conventional Home Purchase Loans
C) Refinancings
D) Home Improvement Loans
E) Loans on Dwellings For 5+ Families
F) Non-occupant Loans on < 5 Family Dwellings (A B C & D)
Number
Average Value
Number
Average Value
Number
Average Value
Number
Average Value
Number
Average Value
Number
Average Value
LOANS ORIGINATED
11
$124,773
118
$173,655
499
$116,498
26
$14,602
1
$224,000
12
$101,409
APPLICATIONS APPROVED, NOT ACCEPTED
0
$0
11
$125,955
69
$116,096
2
$48,465
0
$0
1
$117,700
APPLICATIONS DENIED
3
$119,387
13
$100,217
118
$119,796
20
$29,292
0
$0
4
$40,912
APPLICATIONS WITHDRAWN
2
$138,945
15
$128,360
61
$137,671
4
$21,928
0
$0
1
$52,000
FILES CLOSED FOR INCOMPLETENESS
0
$0
6
$84,330
20
$136,738
1
$28,320
0
$0
1
$103,000
Aggregated Statistics For Year 2001 (Based on 3 full and 2 partial tracts)
A) FHA, FSA/RHS & VA Home Purchase Loans
B) Conventional Home Purchase Loans
C) Refinancings
D) Home Improvement Loans
E) Loans on Dwellings For 5+ Families
F) Non-occupant Loans on < 5 Family Dwellings (A B C & D)
Number
Average Value
Number
Average Value
Number
Average Value
Number
Average Value
Number
Average Value
Number
Average Value
LOANS ORIGINATED
19
$105,538
126
$131,519
380
$111,667
49
$27,894
0
$0
19
$115,829
APPLICATIONS APPROVED, NOT ACCEPTED
0
$0
10
$108,198
60
$89,628
6
$21,327
0
$0
2
$136,945
APPLICATIONS DENIED
3
$195,700
12
$57,892
94
$107,858
9
$25,161
1
$6,290
2
$53,815
APPLICATIONS WITHDRAWN
0
$0
6
$186,367
50
$86,525
5
$33,994
0
$0
1
$101,960
FILES CLOSED FOR INCOMPLETENESS
0
$0
2
$69,250
19
$104,001
0
$0
0
$0
1
$35,250
Aggregated Statistics For Year 2000 (Based on 3 full and 2 partial tracts)
A) FHA, FSA/RHS & VA Home Purchase Loans
B) Conventional Home Purchase Loans
C) Refinancings
D) Home Improvement Loans
F) Non-occupant Loans on < 5 Family Dwellings (A B C & D)
Number
Average Value
Number
Average Value
Number
Average Value
Number
Average Value
Number
Average Value
LOANS ORIGINATED
16
$111,528
107
$117,047
116
$77,934
136
$17,801
6
$61,403
APPLICATIONS APPROVED, NOT ACCEPTED
0
$0
7
$70,374
27
$77,234
12
$24,078
1
$61,680
APPLICATIONS DENIED
2
$136,945
22
$58,100
48
$66,611
22
$20,885
4
$32,870
APPLICATIONS WITHDRAWN
1
$62,310
6
$127,065
21
$85,267
2
$102,505
0
$0
FILES CLOSED FOR INCOMPLETENESS
0
$0
1
$53,500
5
$71,070
0
$0
0
$0
Aggregated Statistics For Year 1999 (Based on 2 full and 2 partial tracts)
A) FHA, FSA/RHS & VA Home Purchase Loans
B) Conventional Home Purchase Loans
C) Refinancings
D) Home Improvement Loans
E) Loans on Dwellings For 5+ Families
F) Non-occupant Loans on < 5 Family Dwellings (A B C & D)
2002 - 2018 National Fire Incident Reporting System (NFIRS) incidents
Based on the data from the years 2002 - 2018 the average number of fire incidents per year is 26. The highest number of fire incidents - 55 took place in 2003, and the least - 2 in 2002. The data has a rising trend.
When looking into fire subcategories, the most incidents belonged to: Outside Fires (38.5%), and Structure Fires (38.0%).
Fire incident types reported to NFIRS in Zip Code 49087


 Nearest zip codes: 49024, 49071, 49067, 49065, 49002, 49093.


 Based on the data from the years 2002 - 2018 the average number of fire incidents per year is 26. The highest number of fire incidents - 55 took place in 2003, and the least - 2 in 2002. The data has a rising trend.
 When looking into fire subcategories, the most incidents belonged to: Outside Fires (38.5%), and Structure Fires (38.0%).