Estimated zip code population in 2022: 11,109 Zip code population in 2010: 11,082 Zip code population in 2000: 12,756
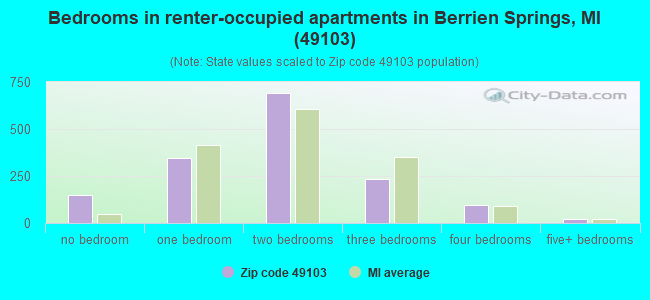
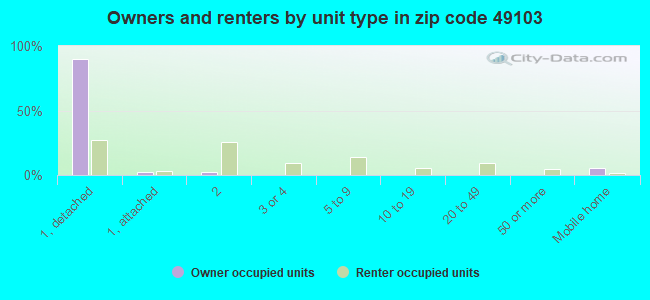
Houses and condos: 4,853 Renter-occupied apartments: 1,554
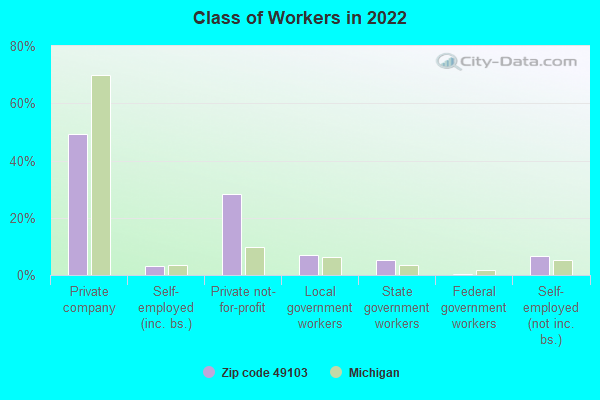
% of renters here:
37%
State:
27%
March 2022 cost of living index in zip code 49103: 82.5 (low, U.S. average is 100)
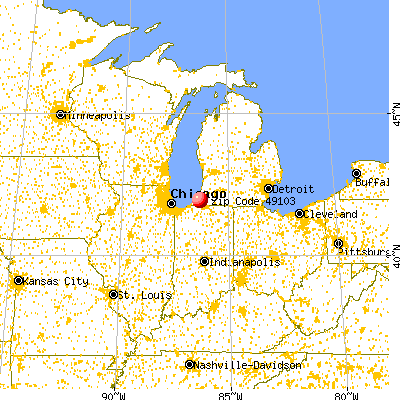
Land area: 44.5 sq. mi. Water area: 2.0 sq. mi.
Population density: 250 people per square mile
(very low).
OSM Map
General Map
Google Map
MSN Map
OSM Map
General Map
Google Map
MSN Map
OSM Map
General Map
Google Map
MSN Map
OSM Map
General Map
Google Map
MSN Map
Please wait while loading the map...
Real estate property taxes paid for housing units in 2022:
This zip code:
0.9% ($2,149)
Michigan:
1.2% ($2,746)
Median real estate property taxes paid for housing units with mortgages in 2022: $2,288 (0.9%) Median real estate property taxes paid for housing units with no mortgage in 2022: $2,010 (0.9%)
Business Search- 14 Million verified businesses
Males: 5,371
(48.3%)
Females: 5,738
(51.7%)
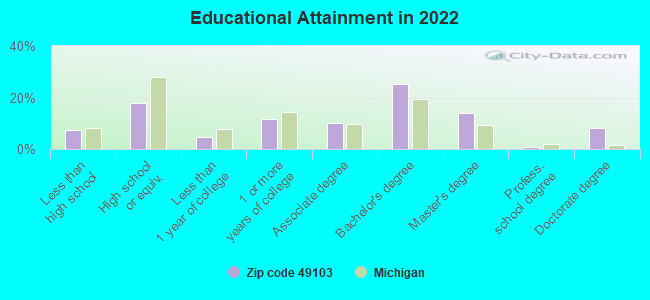
For population 25 years and over in 49103:
High school or higher: 93.8%
Bachelor's degree or higher: 48.8%
Graduate or professional degree: 23.4%
Unemployed: 3.2%
Mean travel time to work (commute): 22.7 minutes
For population 15 years and over in 49103:
Never married: 35.5%
Now married: 52.4%
Separated: 0.4%
Widowed: 3.6%
Divorced: 8.1%
Zip code 49103 compared to state average:
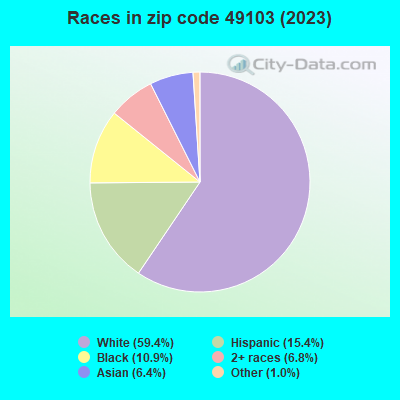
Hispanic race population percentage above state average.
Foreign-born population percentage significantly above state average.
Length of stay since moving in above state average.
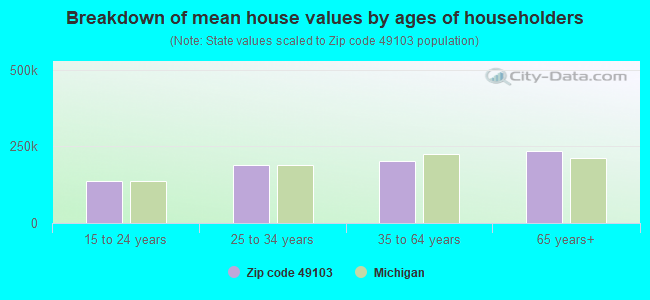
Estimated median house/condo value in 2022: $229,979
49103:
$229,979
Michigan:
$224,400
According to our research of Michigan and other state lists, there were 31 registered sex offenders living in 49103 zip code as of May 28, 2024. The ratio of all residents to sex offenders in zip code 49103 is 366 to 1. The ratio of registered sex offenders to all residents in this zip code is near the state average.
Median resident age:
This zip code:
37.8 years
Michigan median age:
40.3 years
Average household size:
This zip code:
2.4 people
Michigan:
2.4 people
Averages for the 2020 tax year for zip code 49103, filed in 2021:
Average Adjusted Gross Income (AGI) in 2020: $55,465 (Individual Income Tax Returns)
Here:
$55,465
State:
$68,945
Salary/wage: $46,590 (reported on 82.1% of returns)
Here:
$46,590
State:
$57,142
(% of AGI for various income ranges: 1188.8% for AGIs below $25k, 3570.7% for AGIs $25k-50k, 6535.1% for AGIs $50k-75k, 9594.7% for AGIs $75k-100k, 17201.9% for AGIs $100k-200k, 71547.5% for AGIs over 200k)
Taxable interest for individuals: $1,569 (reported on 28.6% of returns)
This zip code:
$1,569
Michigan:
$1,630
(% of AGI for various income ranges: 20.9% for AGIs below $25k, 23.5% for AGIs $25k-50k, 52.7% for AGIs $50k-75k, 54.7% for AGIs $75k-100k, 185.0% for AGIs $100k-200k, 1900.0% for AGIs over 200k)
Ordinary dividends: $3,372 (reported on 15.5% of returns)
Here:
$3,372
State:
$6,972
(% of AGI for various income ranges: 14.2% for AGIs below $25k, 44.3% for AGIs $25k-50k, 55.3% for AGIs $50k-75k, 67.3% for AGIs $75k-100k, 269.4% for AGIs $100k-200k, 1780.0% for AGIs over 200k)
Net capital gain/loss in AGI: +$10,841 (reported on 15.1% of returns)
Here:
+$10,841
State:
+$20,064
(% of AGI for various income ranges: 11.2% for AGIs below $25k, 29.5% for AGIs $25k-50k, 104.7% for AGIs $50k-75k, 175.3% for AGIs $75k-100k, 707.5% for AGIs $100k-200k, 11280.0% for AGIs over 200k)
Profit/loss from business: +$12,026 (reported on 17.3% of returns)
Here:
+$12,026
State:
+$11,172
(% of AGI for various income ranges: 112.7% for AGIs below $25k, 180.9% for AGIs $25k-50k, 275.5% for AGIs $50k-75k, 461.7% for AGIs $75k-100k, 775.3% for AGIs $100k-200k, 5392.5% for AGIs over 200k)
Taxable individual retirement arrangement distribution: $18,559 (reported on 9.7% of returns)
49103:
$18,559
Michigan:
$19,803
(% of AGI for various income ranges: 59.7% for AGIs below $25k, 89.5% for AGIs $25k-50k, 235.5% for AGIs $50k-75k, 445.7% for AGIs $75k-100k, 1080.3% for AGIs $100k-200k, 3867.5% for AGIs over 200k)
Self-employed (Keogh) retirement plans: $15,800 (reported on 0.4% of returns)
49103:
$15,800
Michigan:
$25,132
(% of AGI for various income ranges: 62.0% for AGIs $50k-75k)
Total itemized deductions: $39,400 (reported on 7.4% of returns)
Here:
$39,400
State:
$34,117
(% of AGI for various income ranges: 42.8% for AGIs below $25k, 122.7% for AGIs $25k-50k, 320.4% for AGIs $50k-75k, 547.7% for AGIs $75k-100k, 1494.7% for AGIs $100k-200k, 12225.0% for AGIs over 200k)
Charity contributions: $21,357 (reported on 7.0% of returns)
Here:
$21,357
State:
$13,548
(% of AGI for various income ranges: 49.1% for AGIs $25k-50k, 144.7% for AGIs $50k-75k, 278.0% for AGIs $75k-100k, 793.8% for AGIs $100k-200k, 7327.5% for AGIs over 200k)
Taxes paid: $6,978 (reported on 7.4% of returns)
49103:
$6,978
State:
$7,972
(% of AGI for various income ranges: 4.1% for AGIs below $25k, 18.6% for AGIs $25k-50k, 59.0% for AGIs $50k-75k, 130.3% for AGIs $75k-100k, 333.1% for AGIs $100k-200k, 1517.5% for AGIs over 200k)
Earned income credit: $1,852 (reported on 16.7% of returns)
Here:
$1,852
State:
$2,251
(% of AGI for various income ranges: 69.8% for AGIs below $25k, 74.0% for AGIs $25k-50k, 2.4% for AGIs $50k-75k)
Percentage of individuals using paid preparers for their 2020 taxes: 91.3%
Here:
91%
State:
93%
(% for various income ranges: 90.5% for AGIs below $25k, 92.2% for AGIs $25k-50k, 91.5% for AGIs $50k-75k, 91.1% for AGIs $75k-100k, 91.7% for AGIs $100k-200k, 92.3% for AGIs over 200k)
Averages for the 2012 tax year for zip code 49103, filed in 2013:
Average Adjusted Gross Income (AGI) in 2012: $44,261 (Individual Income Tax Returns)
Here:
$44,261
State:
$55,609
Salary/wage: $39,508 (reported on 83.4% of returns)
Here:
$39,508
State:
$46,782
(% of AGI for various income ranges: 76.6% for AGIs below $25k, 78.0% for AGIs $25k-50k, 75.3% for AGIs $50k-75k, 76.4% for AGIs $75k-100k, 73.1% for AGIs $100k-200k, 66.1% for AGIs over 200k)
Taxable interest for individuals: $1,010 (reported on 35.5% of returns)
This zip code:
$1,010
Michigan:
$1,491
(% of AGI for various income ranges: 1.0% for AGIs below $25k, 0.8% for AGIs $25k-50k, 0.8% for AGIs $50k-75k, 0.7% for AGIs $75k-100k, 0.7% for AGIs $100k-200k, 1.0% for AGIs over 200k)
Ordinary dividends: $3,689 (reported on 15.2% of returns)
Here:
$3,689
State:
$6,225
(% of AGI for various income ranges: 1.2% for AGIs below $25k, 0.9% for AGIs $25k-50k, 1.0% for AGIs $50k-75k, 0.6% for AGIs $75k-100k, 1.6% for AGIs $100k-200k, 2.3% for AGIs over 200k)
Net capital gain/loss in AGI: +$4,170 (reported on 12.5% of returns)
Here:
+$4,170
State:
+$9,326
(% of AGI for various income ranges: 0.1% for AGIs $25k-50k, 0.4% for AGIs $50k-75k, 1.6% for AGIs $75k-100k, 2.1% for AGIs $100k-200k, 2.6% for AGIs over 200k)
Profit/loss from business: +$9,637 (reported on 17.2% of returns)
Here:
+$9,637
State:
+$11,523
(% of AGI for various income ranges: 5.8% for AGIs below $25k, 3.8% for AGIs $25k-50k, 2.9% for AGIs $50k-75k, 3.6% for AGIs $75k-100k, 5.5% for AGIs $100k-200k)
Taxable individual retirement arrangement distribution: $12,647 (reported on 10.5% of returns)
49103:
$12,647
Michigan:
$15,298
(% of AGI for various income ranges: 3.1% for AGIs below $25k, 2.4% for AGIs $25k-50k, 3.3% for AGIs $50k-75k, 2.7% for AGIs $75k-100k, 4.9% for AGIs $100k-200k)
Self-employment retirement plans: $11,033 (reported on 0.6% of returns)
49103:
$11,033
Michigan:
$20,834
Total itemized deductions: $22,052 (25% of AGI, reported on 29.7% of returns)
Here:
$22,052
State:
$21,628
Here:
25.4% of AGI
State:
18.4% of AGI
(% of AGI for various income ranges: 9.8% for AGIs below $25k, 12.2% for AGIs $25k-50k, 14.7% for AGIs $50k-75k, 16.2% for AGIs $75k-100k, 15.7% for AGIs $100k-200k, 19.7% for AGIs over 200k)
Charity contributions: $9,545 (reported on 26.2% of returns)
Here:
$9,545
State:
$4,225
(% of AGI for various income ranges: 2.5% for AGIs below $25k, 4.1% for AGIs $25k-50k, 5.5% for AGIs $50k-75k, 6.0% for AGIs $75k-100k, 5.8% for AGIs $100k-200k, 10.2% for AGIs over 200k)
Taxes paid: $5,780 (reported on 29.7% of returns)
49103:
$5,780
State:
$8,327
(% of AGI for various income ranges: 1.6% for AGIs below $25k, 2.5% for AGIs $25k-50k, 3.5% for AGIs $50k-75k, 4.4% for AGIs $75k-100k, 5.0% for AGIs $100k-200k, 5.6% for AGIs over 200k)
Earned income credit: $1,996 (reported on 20.9% of returns)
Here:
$1,996
State:
$2,306
(% of AGI for various income ranges: 6.3% for AGIs below $25k, 1.3% for AGIs $25k-50k)
Percentage of individuals using paid preparers for their 2012 taxes: 48.4%
Here:
48%
State:
57%
(% for various income ranges: 42.9% for AGIs below $25k, 50.0% for AGIs $25k-50k, 53.8% for AGIs $50k-75k, 53.7% for AGIs $75k-100k, 53.8% for AGIs $100k-200k, 87.5% for AGIs over 200k)
Averages for the 2004 tax year for zip code 49103, filed in 2005:
Average Adjusted Gross Income (AGI) in 2004: $37,930 (Individual Income Tax Returns)
Here:
$37,930
State:
$48,204
Salary/wage: $33,633 (reported on 86.0% of returns)
Here:
$33,633
State:
$42,791
(% of AGI for various income ranges: 145.2% for AGIs below $10k, 77.1% for AGIs $10k-25k, 82.9% for AGIs $25k-50k, 81.3% for AGIs $50k-75k, 82.7% for AGIs $75k-100k, 58.7% for AGIs over 100k)
Taxable interest for individuals: $1,251 (reported on 45.5% of returns)
This zip code:
$1,251
Michigan:
$1,725
(% of AGI for various income ranges: 5.6% for AGIs below $10k, 2.5% for AGIs $10k-25k, 1.5% for AGIs $25k-50k, 1.0% for AGIs $50k-75k, 0.8% for AGIs $75k-100k, 1.6% for AGIs over 100k)
Taxable dividends: $2,550 (reported on 17.1% of returns)
Here:
$2,550
State:
$3,420
(% of AGI for various income ranges: 2.7% for AGIs below $10k, 1.2% for AGIs $10k-25k, 0.7% for AGIs $25k-50k, 0.7% for AGIs $50k-75k, 0.7% for AGIs $75k-100k, 1.9% for AGIs over 100k)
Net capital gain/loss: +$7,751 (reported on 14.4% of returns)
Here:
+$7,751
State:
+$8,532
(% of AGI for various income ranges: -1.9% for AGIs below $10k, 0.1% for AGIs $10k-25k, 1.1% for AGIs $25k-50k, 1.0% for AGIs $50k-75k, 1.4% for AGIs $75k-100k, 8.2% for AGIs over 100k)
Profit/loss from business: +$9,489 (reported on 17.2% of returns)
Here:
+$9,489
State:
+$9,547
(% of AGI for various income ranges: 0.1% for AGIs below $10k, 5.4% for AGIs $10k-25k, 3.3% for AGIs $25k-50k, 4.2% for AGIs $50k-75k, 3.4% for AGIs $75k-100k, 5.5% for AGIs over 100k)
Profit/loss from farming: +$779 (reported on 1.6% of returns)
Here:
+$779
State:
-$4,492
(% of AGI for various income ranges: -4.1% for AGIs below $10k, -0.0% for AGIs $10k-25k, 0.2% for AGIs $25k-50k, 0.1% for AGIs $50k-75k, 0.2% for AGIs $75k-100k)
IRA payment deduction: $3,119 (reported on 2.4% of returns)
49103:
$3,119
Michigan:
$2,875
(% of AGI for various income ranges: 0.2% for AGIs $10k-25k, 0.2% for AGIs $25k-50k, 0.3% for AGIs $50k-75k, 0.2% for AGIs $75k-100k, 0.1% for AGIs over 100k)
Self-employed pension: $11,438 (reported on 0.7% of returns)
Here:
$11,438
Michigan:
$13,826
Total itemized deductions: $18,402 (26% of AGI, reported on 33.6% of returns)
Here:
$18,402
State:
$18,509
Here:
25.7% of AGI
State:
20.7% of AGI
(% of AGI for various income ranges: 16.4% for AGIs below $10k, 12.8% for AGIs $10k-25k, 15.8% for AGIs $25k-50k, 17.4% for AGIs $50k-75k, 16.6% for AGIs $75k-100k, 17.0% for AGIs over 100k)
Charity contributions deductions: $7,185 (10% of AGI, reported on 30.6% of returns)
Here:
$7,185
State:
$3,365
Here:
9.7% of AGI
State:
3.6% of AGI
(% of AGI for various income ranges: 2.4% for AGIs below $10k, 3.7% for AGIs $10k-25k, 5.6% for AGIs $25k-50k, 6.0% for AGIs $50k-75k, 6.2% for AGIs $75k-100k, 6.6% for AGIs over 100k)
Total tax: $5,700 (reported on 67.1% of returns)
49103:
$5,700
State:
$7,691
(% of AGI for various income ranges: 3.3% for AGIs below $10k, 3.9% for AGIs $10k-25k, 6.0% for AGIs $25k-50k, 8.5% for AGIs $50k-75k, 10.0% for AGIs $75k-100k, 17.3% for AGIs over 100k)
Earned income credit: $1,638 (reported on 15.5% of returns)
Here:
$1,638
State:
$1,737
Percentage of individuals using paid preparers for their 2004 taxes: 48.6%
Here:
49%
State:
60%
(% for various income ranges: 37.5% for AGIs below $10k, 48.1% for AGIs $10k-25k, 50.9% for AGIs $25k-50k, 56.7% for AGIs $50k-75k, 53.4% for AGIs $75k-100k, 66.9% for AGIs over 100k)
Household received Food Stamps/SNAP in the past 12 months: 414 Household did not receive Food Stamps/SNAP in the past 12 months: 3,833
Women who had a birth in the past 12 months: 116 (111 now married, 7 unmarried) Women who did not have a birth in the past 12 months: 2,702 (1,003 now married, 1,700 unmarried)
Housing units in zip code 49103 with a mortgage: 1,296 (197 second mortgage, 160 both second mortgage and home equity loan) Houses without a mortgage: 35
Median monthly owner costs for units with a mortgage: $1,470 Median monthly owner costs for units without a mortgage: $522
Residents with income below the poverty level in 2022:
This zip code:
18.1%
Whole state:
13.4%
Residents with income below 50% of the poverty level in 2022:
This zip code:
8.7%
Whole state:
6.9%
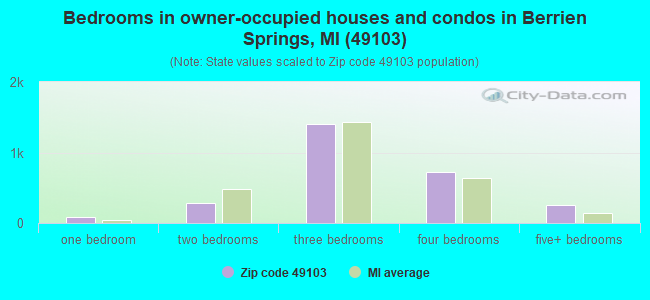
Median number of rooms in houses and condos:
Here:
7.0
State:
6.5
Median number of rooms in apartments:
Here:
3.5
State:
4.3
Notable locations in this zip code not listed on our city pages
Notable locations in zip code 49103: Camp Oronoko (A), Camp Betz (B), Oronoko Lakes Campground (C), Berrien County Youth Fairgrounds (D), Andrews University Sledding Hill (E), Michiana Camp (F), Berrien Springs - Oronoko Township Fire Department (G), Medic 1 Emergency Medical Services South (H), Information Services Building (I), Horn Archeological Institute and Museum (J), Tucker Building (K), Seamount Building (L), Griggs Hall (M), Beaty Gym and Pool (N), Johnson Gym (O), Nethery Hall (P), Bell Hall (Q), Service Center (R), Forsyth Honors House (S), Architecture Building (T). Display/hide their locations on the map
Churches in zip code 49103 include: Saint Gabriel Catholic Church (A), Berrien Springs United Methodist Church (B), Pioneer Memorial Church (C), Hinchman United Methodist Church (D), Trinity Lutheran Church (E), Seventh-Day Adventist Church (F), First Baptist Church (G), Full Gospel Pentecostal Church of God (H), All Nations Seventh-Day Adventists (I). Display/hide their locations on the map
Cemeteries: Burke Cemetery (1), Long Lake Cemetery (2), Rose Hill Cemetery (3), Feather Cemetery (4), Salem Cemetery (5), Oak Grove Cemetery (6). Display/hide their locations on the map
Parks in zip code 49103 include: Berrien Springs Courthouse Historical Marker (1), Andrews University Historical Marker (2), Shamrock Park (3), Police Memorial Park (4), Rotary Park (5), Indian Fields Grove Park (6), Memorial Park (7), Lions Park (8). Display/hide their locations on the map
1,429 married couples with children.
467 single-parent households (64 men, 403 women).
75.6% of residents of 49103 zip code speak English at home.
13.5% of residents speak Spanish at home (80% very well, 11% well, 3% not well, 5% not at all).
3.5% of residents speak other Indo-European language at home (68% very well, 22% well, 8% not well, 1% not at all).
4.3% of residents speak Asian or Pacific Island language at home (43% very well, 40% well, 16% not well).
3.5% of residents speak other language at home (89% very well, 5% well, 5% not well, 1% not at all).
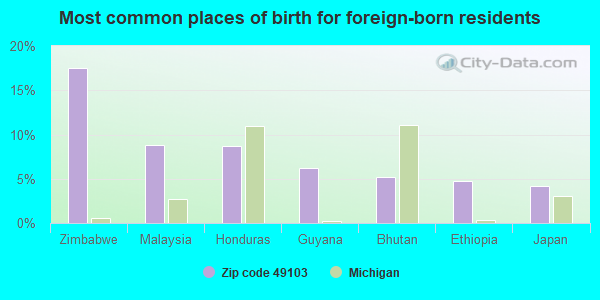
Foreign born population: 1,995 (18.0%) (54.8% of them are naturalized citizens)
This zip code:
18.0%
Whole state:
6.9%
17%Zimbabwe
9%Malaysia
9%Honduras
6%Guyana
5%Bhutan
5%Ethiopia
4%Japan
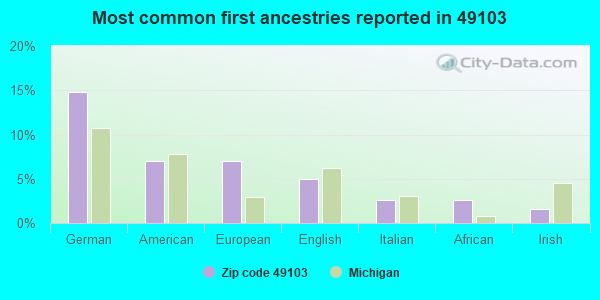
15%German
7%American
7%European
5%English
3%Italian
3%African
2%Irish
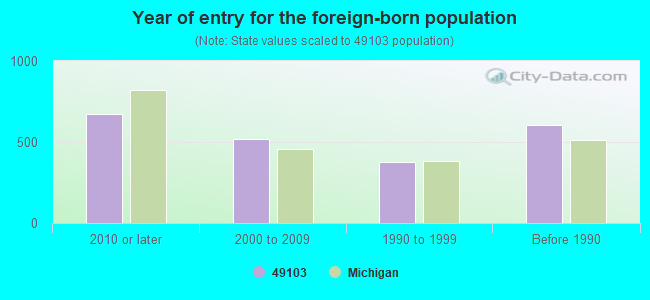
Year of entry for the foreign-born population
6702010 or later
5182000 to 2009
3771990 to 1999
604Before 1990
Major facilities with environmental interests located in this zip code:
BERRIEN SPRINGS ALTERNATIVE EDUCATION CENTER (TUDOR ROAD in BERRIEN SPRINGS, MI)
(National Center for Education Statistics) - STATE ID-09086 Organizations: BERRIEN SPRINGS PUBLIC SCHOOLS (SCHOOL DISTRICT)
BERRIEN SPRINGS HIGH SCHOOL (ONE SYLVESTER AVENUE in BERRIEN SPRINGS, MI)
(National Center for Education Statistics) - STATE ID-00297 Organizations: BERRIEN SPRINGS PUBLIC SCHOOLS (SCHOOL DISTRICT)
BERRIEN SPRINGS MIDDLE SCHOOL (ONE SYLVESTER AVENUE in BERRIEN SPRINGS, MI)
(National Center for Education Statistics) - STATE ID-00296 Organizations: BERRIEN SPRINGS PUBLIC SCHOOLS (SCHOOL DISTRICT)
BLOSSOMLAND LEARNING CENTER (711 ST. JOSEPH AVENUE in BERRIEN SPRINGS, MI)
(National Center for Education Statistics) - STATE ID-06922 Organizations: BERRIEN ISD (SCHOOL DISTRICT)
BERRIEN COUNTY INTERMEDIATE SCHOOL DISTR (711 ST JOSEPH AVE in BERRIEN SPRINGS, MI)
COMPLIANCE ACTIVITY (Tracking inspections of insecticide, fungicide, and rodenticide, and toxic substances) Conditionally Exempt Small Quantity Generators, less than 100 kg/month of hazardous waste (Resource Conservation and Recovery Act (tracking hazardous waste)) Organizations: BERRIEN COUNTY INT SCHOOL DISTRICT (CONTACT/OPERATOR)
Alternative names: BERRIEN COUNTY INTERMEDIATE S D, BERRIEN COUNTY INTERMEDIATE SD
EMRO MARKETING UNIT 7177 (6518 US 31 TO 33 in BERRIEN SPRINGS, MI)
AMOCO PRE-MART (8736 N US 31 in BERRIEN SPRINGS, MI)
(Resource Conservation and Recovery Act (tracking hazardous waste))
ANDREWS UNIVERSITY (N/A in BERRIEN SPRINGS, MI)
(Resource Conservation and Recovery Act (tracking hazardous waste))
AUTOZONE INC (9099 HWY US31 in BERRIEN SPRINGS, MI)
Conditionally Exempt Small Quantity Generators, less than 100 kg/month of hazardous waste (Resource Conservation and Recovery Act (tracking hazardous waste)) Organizations: PIETER E & CAROL A. GELDNOF (CONTACT/OWNER)
BERRIEN COUNTY INTERMEDIATE SCHOOL (1 SYLVESTER ST in BERRIEN SPRINGS, MI)
(Resource Conservation and Recovery Act (tracking hazardous waste)) Alternative names: BERRIEN CO INTERMEDIATE SCHOOL
GROWER SERVICE CORPORATION (8030 SOUTH SCOTTDALE ROAD in BERRIEN SPRINGS, MI)
COMPLIANCE ACTIVITY (Tracking inspections of insecticide, fungicide, and rodenticide, and toxic substances) Business SIC classification: CHEMICALS AND CHEMICAL PREPARATIONS Alternative names: EVANS AGRICULTURAL SVCS INC
ESSEX GROUP INC (100 TUDOR RD in BERRIEN SPRINGS, MI)
(Resource Conservation and Recovery Act (tracking hazardous waste))
ANDREWS UNIVERSITY AIRPARK (3800 GRIGGS DR in BERRIEN SPRINGS, MI)
Conditionally Exempt Small Quantity Generators, less than 100 kg/month of hazardous waste (Resource Conservation and Recovery Act (tracking hazardous waste)) - notification Alternative names: ANDREWS UNIVERSITY AIRPORT
Housing units lacking complete plumbing facilities: 0.5% Housing units lacking complete kitchen facilities: 2.0%
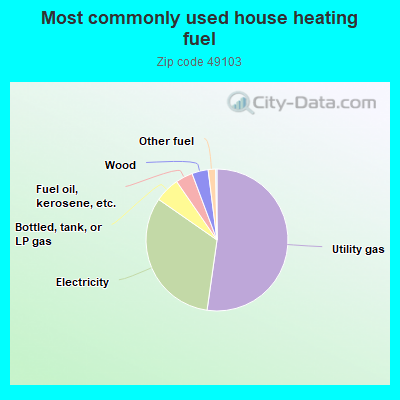
52.2%Utility gas
32.4%Electricity
5.7%Bottled, tank, or LP gas
3.9%Fuel oil, kerosene, etc.
3.7%Wood
1.7%Other fuel
Population in 1990: 11,600. Population change in the 1990s: +1,156 (+10.0%).
Place of birth for U.S.-born residents:
This state: 4,576
Northeast: 502
Midwest: 2,002
South: 1,112
West: 793
53% of the 49103 zip code residents lived in the same house 5 years ago. Out of people who lived in different houses, 51% lived in this county. Out of people who lived in different counties, 50% lived in Michigan.
90% of the 49103 zip code residents lived in the same house 1 year ago. Out of people who lived in different houses, 61% moved from this county. Out of people who lived in different houses, 8% moved from different county within same state. Out of people who lived in different houses, 19% moved from different state. Out of people who lived in different houses, 13% moved from abroad.
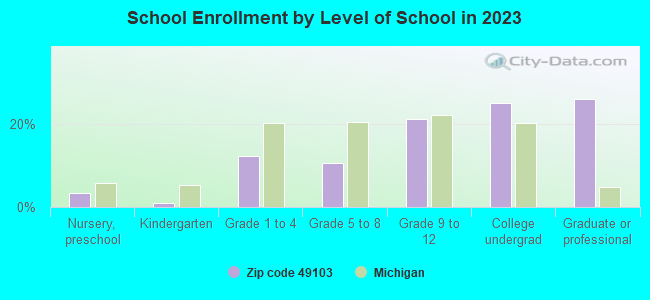
Private vs. public school enrollment:
Students in private schools in grades 1 to 8 (elementary and middle school): 259
Here:
31.7%
Michigan:
12.4%
Students in private schools in grades 9 to 12 (high school): 259
Here:
39.3%
Michigan:
9.8%
Students in private undergraduate colleges: 596
Here:
74.2%
Michigan:
14.9%
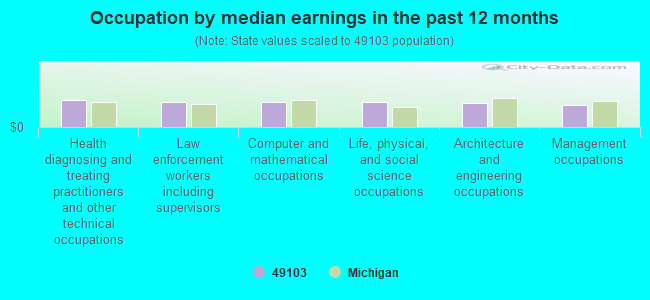
Occupation by median earnings in the past 12 months ($)
80,754Health diagnosing and treating practitioners and other technical occupations
75,428Architecture and engineering occupations
67,012Life, physical, and social science occupations
66,683Law enforcement workers including supervisors
66,446Computer and mathematical occupations
58,229Management occupations
Top industries in this zip code by the number of employees in 2005:
2002 - 2018 National Fire Incident Reporting System (NFIRS) incidents
According to the data from the years 2002 - 2018 the average number of fires per year is 42. The highest number of fires - 65 took place in 2009, and the least - 28 in 2006. The data has a growing trend.
When looking into fire subcategories, the most reports belonged to: Structure Fires (56.9%), and Outside Fires (25.9%).
Fire incident types reported to NFIRS in Zip Code 49103


+$779
-$4,492
(% of AGI for various income ranges: -4.1% for AGIs below $10k, -0.0% for AGIs $10k-25k, 0.2% for AGIs $25k-50k, 0.1% for AGIs $50k-75k, 0.2% for AGIs $75k-100k) Nearest zip codes: 49104, 49126, 49101, 49107, 49111, 49102.


 According to the data from the years 2002 - 2018 the average number of fires per year is 42. The highest number of fires - 65 took place in 2009, and the least - 28 in 2006. The data has a growing trend.
 When looking into fire subcategories, the most reports belonged to: Structure Fires (56.9%), and Outside Fires (25.9%).