Estimated zip code population in 2022: 5,811 Zip code population in 2010: 6,182 Zip code population in 2000: 5,958
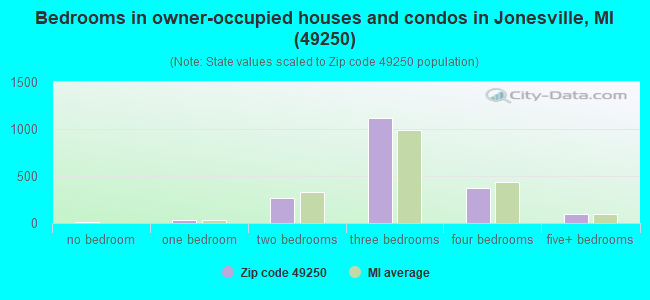
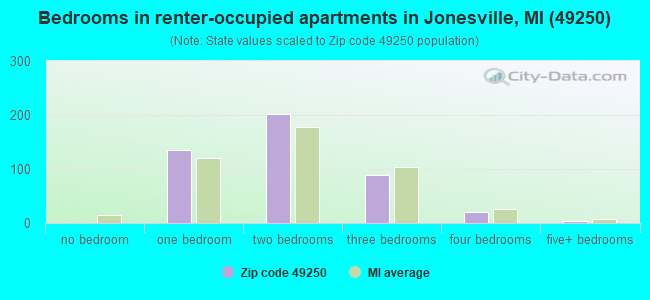
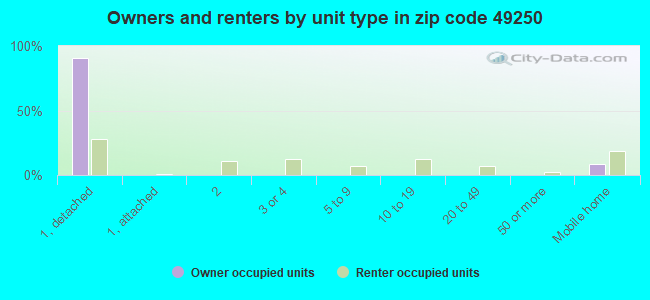
Houses and condos: 2,595 Renter-occupied apartments: 445
% of renters here:
19%
State:
27%
March 2022 cost of living index in zip code 49250: 80.9 (low, U.S. average is 100)
Land area: 78.1 sq. mi. Water area: 0.5 sq. mi.
Population density: 74 people per square mile
(very low).
OSM Map
General Map
Google Map
MSN Map
OSM Map
General Map
Google Map
MSN Map
OSM Map
General Map
Google Map
MSN Map
OSM Map
General Map
Google Map
MSN Map
Please wait while loading the map...
Real estate property taxes paid for housing units in 2022:
This zip code:
1.1% ($1,857)
Michigan:
1.2% ($2,746)
Median real estate property taxes paid for housing units with mortgages in 2022: $1,903 (1.1%) Median real estate property taxes paid for housing units with no mortgage in 2022: $1,806 (1.3%)
Business Search- 14 Million verified businesses
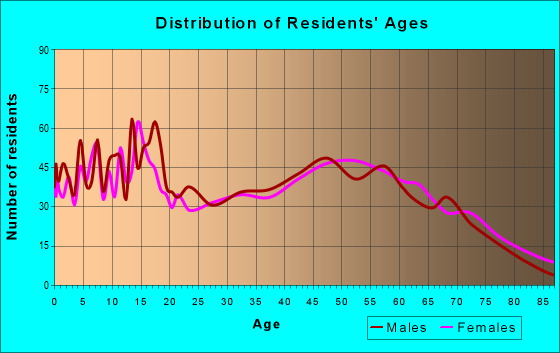
Males: 2,887
(49.7%)
Females: 2,923
(50.3%)
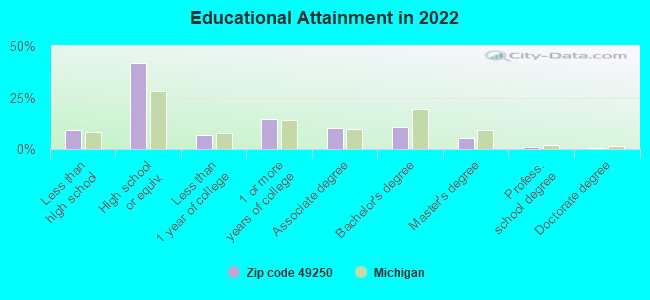
For population 25 years and over in 49250:
High school or higher: 89.9%
Bachelor's degree or higher: 17.5%
Graduate or professional degree: 6.8%
Unemployed: 3.3%
Mean travel time to work (commute): 26.2 minutes
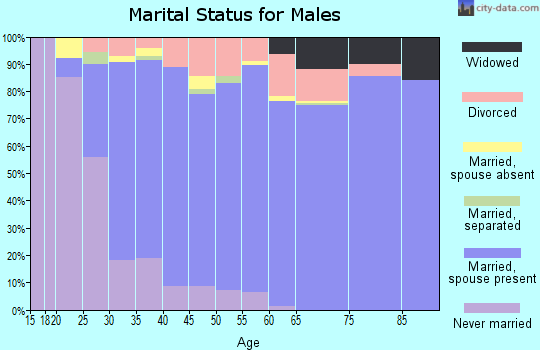
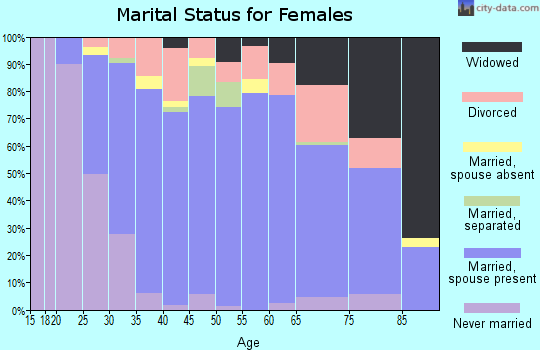
For population 15 years and over in 49250:
Never married: 27.0%
Now married: 54.0%
Separated: 1.6%
Widowed: 8.0%
Divorced: 9.4%
Zip code 49250 compared to state average:
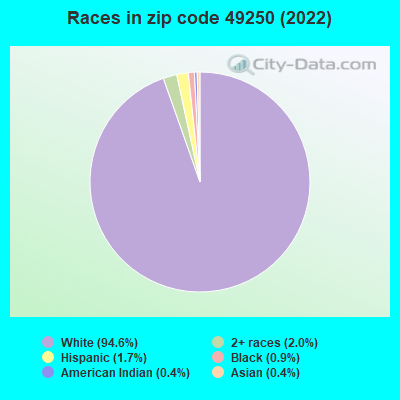
Black race population percentage significantly below state average.
Hispanic race population percentage significantly below state average.
Foreign-born population percentage significantly below state average.
Length of stay since moving in significantly above state average.
Number of college students below state average.
Percentage of population with a bachelor's degree or higher below state average.
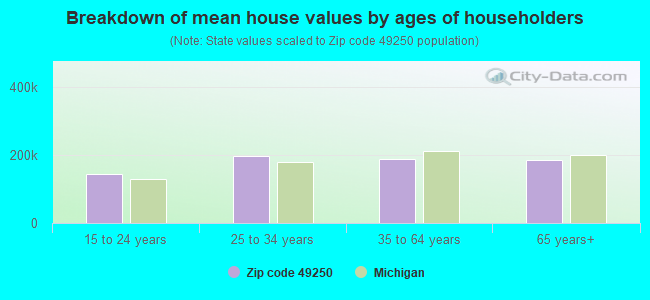
Estimated median house/condo value in 2022: $170,281
49250:
$170,281
Michigan:
$224,400
According to our research of Michigan and other state lists, there were 23 registered sex offenders living in 49250 zip code as of May 13, 2024. The ratio of all residents to sex offenders in zip code 49250 is 262 to 1. The ratio of registered sex offenders to all residents in this zip code is near the state average.
Median resident age:
This zip code:
42.1 years
Michigan median age:
40.3 years
Average household size:
This zip code:
2.4 people
Michigan:
2.4 people
Averages for the 2020 tax year for zip code 49250, filed in 2021:
Average Adjusted Gross Income (AGI) in 2020: $48,376 (Individual Income Tax Returns)
Here:
$48,376
State:
$68,945
Salary/wage: $43,864 (reported on 78.4% of returns)
Here:
$43,864
State:
$57,142
(% of AGI for various income ranges: 1008.1% for AGIs below $25k, 3419.5% for AGIs $25k-50k, 6124.1% for AGIs $50k-75k, 9506.0% for AGIs $75k-100k, 14743.3% for AGIs $100k-200k)
Taxable interest for individuals: $920 (reported on 22.6% of returns)
This zip code:
$920
Michigan:
$1,630
(% of AGI for various income ranges: 13.3% for AGIs below $25k, 16.4% for AGIs $25k-50k, 45.0% for AGIs $50k-75k, 46.5% for AGIs $75k-100k, 56.7% for AGIs $100k-200k)
Ordinary dividends: $3,308 (reported on 13.6% of returns)
Here:
$3,308
State:
$6,972
(% of AGI for various income ranges: 17.1% for AGIs below $25k, 25.6% for AGIs $25k-50k, 64.7% for AGIs $50k-75k, 114.5% for AGIs $75k-100k, 232.8% for AGIs $100k-200k)
Net capital gain/loss in AGI: +$8,017 (reported on 12.2% of returns)
Here:
+$8,017
State:
+$20,064
(% of AGI for various income ranges: 8.7% for AGIs below $25k, 36.9% for AGIs $25k-50k, 117.5% for AGIs $50k-75k, 225.0% for AGIs $75k-100k, 555.6% for AGIs $100k-200k)
Profit/loss from business: +$8,336 (reported on 12.5% of returns)
Here:
+$8,336
State:
+$11,172
(% of AGI for various income ranges: 80.1% for AGIs below $25k, 127.2% for AGIs $25k-50k, 123.1% for AGIs $50k-75k, 163.0% for AGIs $75k-100k, 524.4% for AGIs $100k-200k)
Taxable individual retirement arrangement distribution: $13,558 (reported on 10.8% of returns)
49250:
$13,558
Michigan:
$19,803
(% of AGI for various income ranges: 90.3% for AGIs below $25k, 121.8% for AGIs $25k-50k, 303.1% for AGIs $50k-75k, 399.0% for AGIs $75k-100k, 588.9% for AGIs $100k-200k)
Total itemized deductions: $28,533 (reported on 2.1% of returns)
Here:
$28,533
State:
$34,117
(% of AGI for various income ranges: 214.1% for AGIs $50k-75k, 570.6% for AGIs $100k-200k)
Charity contributions: $12,700 (reported on 1.4% of returns)
Here:
$12,700
State:
$13,548
(% of AGI for various income ranges: 282.2% for AGIs $100k-200k)
Taxes paid: $6,317 (reported on 2.1% of returns)
49250:
$6,317
State:
$7,972
(% of AGI for various income ranges: 36.9% for AGIs $50k-75k, 145.0% for AGIs $100k-200k)
Earned income credit: $2,174 (reported on 15.0% of returns)
Here:
$2,174
State:
$2,251
(% of AGI for various income ranges: 79.3% for AGIs below $25k, 62.3% for AGIs $25k-50k)
Percentage of individuals using paid preparers for their 2020 taxes: 95.5%
Here:
95%
State:
93%
(% for various income ranges: 94.3% for AGIs below $25k, 96.1% for AGIs $25k-50k, 95.5% for AGIs $50k-75k, 96.6% for AGIs $75k-100k, 96.4% for AGIs $100k-200k, 100.0% for AGIs over 200k)
Averages for the 2012 tax year for zip code 49250, filed in 2013:
Average Adjusted Gross Income (AGI) in 2012: $42,044 (Individual Income Tax Returns)
Here:
$42,044
State:
$55,609
Salary/wage: $38,500 (reported on 81.6% of returns)
Here:
$38,500
State:
$46,782
(% of AGI for various income ranges: 66.2% for AGIs below $25k, 78.6% for AGIs $25k-50k, 79.0% for AGIs $50k-75k, 78.4% for AGIs $75k-100k, 74.2% for AGIs $100k-200k, 56.9% for AGIs over 200k)
Taxable interest for individuals: $1,131 (reported on 27.2% of returns)
This zip code:
$1,131
Michigan:
$1,491
(% of AGI for various income ranges: 1.5% for AGIs below $25k, 0.7% for AGIs $25k-50k, 0.7% for AGIs $50k-75k, 0.6% for AGIs $75k-100k, 0.5% for AGIs $100k-200k, 0.9% for AGIs over 200k)
Ordinary dividends: $2,958 (reported on 15.3% of returns)
Here:
$2,958
State:
$6,225
(% of AGI for various income ranges: 1.1% for AGIs below $25k, 0.7% for AGIs $25k-50k, 0.7% for AGIs $50k-75k, 1.3% for AGIs $75k-100k, 2.1% for AGIs $100k-200k)
Net capital gain/loss in AGI: +$4,903 (reported on 11.9% of returns)
Here:
+$4,903
State:
+$9,326
(% of AGI for various income ranges: 0.3% for AGIs below $25k, 0.5% for AGIs $25k-50k, 0.9% for AGIs $50k-75k, 1.5% for AGIs $75k-100k, 3.9% for AGIs $100k-200k)
Profit/loss from business: +$7,640 (reported on 15.3% of returns)
Here:
+$7,640
State:
+$11,523
(% of AGI for various income ranges: 8.2% for AGIs below $25k, 3.3% for AGIs $25k-50k, 1.9% for AGIs $50k-75k, 3.3% for AGIs $100k-200k)
Taxable individual retirement arrangement distribution: $10,838 (reported on 11.1% of returns)
49250:
$10,838
Michigan:
$15,298
(% of AGI for various income ranges: 4.8% for AGIs below $25k, 3.1% for AGIs $25k-50k, 2.9% for AGIs $50k-75k, 3.5% for AGIs $75k-100k, 2.0% for AGIs $100k-200k)
Total itemized deductions: $16,398 (20% of AGI, reported on 18.0% of returns)
Here:
$16,398
State:
$21,628
Here:
20.4% of AGI
State:
18.4% of AGI
(% of AGI for various income ranges: 5.1% for AGIs below $25k, 6.0% for AGIs $25k-50k, 7.0% for AGIs $50k-75k, 7.3% for AGIs $75k-100k, 7.8% for AGIs $100k-200k, 10.3% for AGIs over 200k)
Charity contributions: $3,244 (reported on 12.3% of returns)
Here:
$3,244
State:
$4,225
(% of AGI for various income ranges: 0.5% for AGIs below $25k, 0.6% for AGIs $25k-50k, 0.9% for AGIs $50k-75k, 0.9% for AGIs $75k-100k, 1.1% for AGIs $100k-200k, 2.5% for AGIs over 200k)
Taxes paid: $5,485 (reported on 18.0% of returns)
49250:
$5,485
State:
$8,327
(% of AGI for various income ranges: 1.0% for AGIs below $25k, 1.3% for AGIs $25k-50k, 2.0% for AGIs $50k-75k, 2.6% for AGIs $75k-100k, 3.5% for AGIs $100k-200k, 4.9% for AGIs over 200k)
Earned income credit: $2,070 (reported on 20.3% of returns)
Here:
$2,070
State:
$2,306
(% of AGI for various income ranges: 6.1% for AGIs below $25k, 1.4% for AGIs $25k-50k)
Percentage of individuals using paid preparers for their 2012 taxes: 65.1%
Here:
65%
State:
57%
(% for various income ranges: 57.5% for AGIs below $25k, 66.2% for AGIs $25k-50k, 73.2% for AGIs $50k-75k, 71.4% for AGIs $75k-100k, 77.8% for AGIs $100k-200k, 100.0% for AGIs over 200k)
Averages for the 2004 tax year for zip code 49250, filed in 2005:
Average Adjusted Gross Income (AGI) in 2004: $36,339 (Individual Income Tax Returns)
Here:
$36,339
State:
$48,204
Salary/wage: $34,508 (reported on 84.6% of returns)
Here:
$34,508
State:
$42,791
(% of AGI for various income ranges: 132.9% for AGIs below $10k, 70.5% for AGIs $10k-25k, 83.5% for AGIs $25k-50k, 83.9% for AGIs $50k-75k, 85.4% for AGIs $75k-100k, 67.0% for AGIs over 100k)
Taxable interest for individuals: $1,520 (reported on 40.1% of returns)
This zip code:
$1,520
Michigan:
$1,725
(% of AGI for various income ranges: 6.8% for AGIs below $10k, 3.5% for AGIs $10k-25k, 1.0% for AGIs $25k-50k, 1.1% for AGIs $50k-75k, 1.3% for AGIs $75k-100k, 2.2% for AGIs over 100k)
Taxable dividends: $2,341 (reported on 20.0% of returns)
Here:
$2,341
State:
$3,420
(% of AGI for various income ranges: 4.2% for AGIs below $10k, 1.6% for AGIs $10k-25k, 0.7% for AGIs $25k-50k, 1.1% for AGIs $50k-75k, 0.8% for AGIs $75k-100k, 2.5% for AGIs over 100k)
Net capital gain/loss: +$5,000 (reported on 16.2% of returns)
Here:
+$5,000
State:
+$8,532
(% of AGI for various income ranges: 0.4% for AGIs below $10k, 0.6% for AGIs $10k-25k, 0.5% for AGIs $25k-50k, 1.8% for AGIs $50k-75k, 2.2% for AGIs $75k-100k, 6.5% for AGIs over 100k)
Profit/loss from business: +$7,730 (reported on 16.7% of returns)
Here:
+$7,730
State:
+$9,547
(% of AGI for various income ranges: 7.3% for AGIs below $10k, 3.8% for AGIs $10k-25k, 2.4% for AGIs $25k-50k, 3.5% for AGIs $50k-75k, 1.0% for AGIs $75k-100k, 7.3% for AGIs over 100k)
IRA payment deduction: $2,900 (reported on 1.5% of returns)
49250:
$2,900
Michigan:
$2,875
Self-employed pension: $7,667 (reported on 0.5% of returns)
Here:
$7,667
Michigan:
$13,826
Total itemized deductions: $14,307 (21% of AGI, reported on 24.6% of returns)
Here:
$14,307
State:
$18,509
Here:
21.4% of AGI
State:
20.7% of AGI
(% of AGI for various income ranges: 18.1% for AGIs below $10k, 6.6% for AGIs $10k-25k, 7.8% for AGIs $25k-50k, 10.1% for AGIs $50k-75k, 11.7% for AGIs $75k-100k, 11.2% for AGIs over 100k)
Charity contributions deductions: $2,470 (3% of AGI, reported on 18.5% of returns)
Here:
$2,470
State:
$3,365
Here:
3.4% of AGI
State:
3.6% of AGI
(% of AGI for various income ranges: 1.4% for AGIs below $10k, 0.7% for AGIs $10k-25k, 0.7% for AGIs $25k-50k, 1.2% for AGIs $50k-75k, 1.3% for AGIs $75k-100k, 2.4% for AGIs over 100k)
Total tax: $4,636 (reported on 70.7% of returns)
49250:
$4,636
State:
$7,691
(% of AGI for various income ranges: 4.2% for AGIs below $10k, 3.7% for AGIs $10k-25k, 6.3% for AGIs $25k-50k, 8.2% for AGIs $50k-75k, 10.3% for AGIs $75k-100k, 16.8% for AGIs over 100k)
Earned income credit: $1,697 (reported on 16.8% of returns)
Here:
$1,697
State:
$1,737
Percentage of individuals using paid preparers for their 2004 taxes: 69.3%
Here:
69%
State:
60%
(% for various income ranges: 60.1% for AGIs below $10k, 72.4% for AGIs $10k-25k, 70.3% for AGIs $25k-50k, 73.3% for AGIs $50k-75k, 69.9% for AGIs $75k-100k, 80.0% for AGIs over 100k)
Likely homosexual households (counted as self-reported same-sex unmarried-partner households)
Lesbian couples: 0.1% of all households
Gay men: 0.0% of all households
Household received Food Stamps/SNAP in the past 12 months: 285 Household did not receive Food Stamps/SNAP in the past 12 months: 2,053
Women who had a birth in the past 12 months: 70 (67 now married, 4 unmarried) Women who did not have a birth in the past 12 months: 1,121 (565 now married, 552 unmarried)
Housing units in zip code 49250 with a mortgage: 1,131 (99 second mortgage, 7 home equity loan, 93 both second mortgage and home equity loan) Houses without a mortgage: 64
Median monthly owner costs for units with a mortgage: $1,181 Median monthly owner costs for units without a mortgage: $477
Residents with income below the poverty level in 2022:
This zip code:
16.0%
Whole state:
13.4%
Residents with income below 50% of the poverty level in 2022:
This zip code:
11.1%
Whole state:
6.9%
Median number of rooms in houses and condos:
Here:
6.6
State:
6.5
Median number of rooms in apartments:
Here:
4.2
State:
4.3
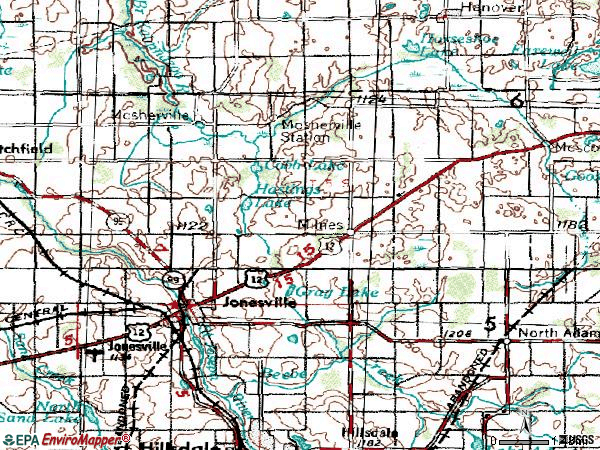
Notable locations in this zip code not listed on our city pages
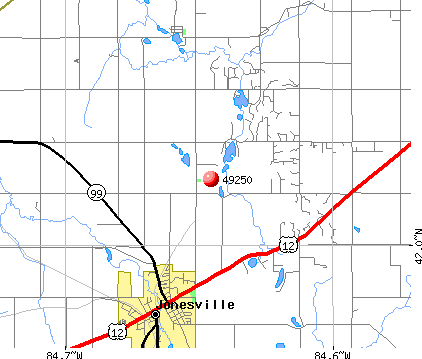
Notable locations in zip code 49250: Way Back In Campgrounds (A), Jonesville Station (B), Mill Race Golf Club (C), Wildwood Acres Campground (D), Mosherville Station (E), Moscow Township Fire Department (F), Grosvenor House Museum (G), Jonesville Fire Department (H), Jonesville Police Department (I), Jonesville District Library (J). Display/hide their locations on the map
Churches in zip code 49250 include: Moscow Plains Church (A), Grace Episcopal Church (B), Presbyterian Church (C), New Covenant Fellowship (D), Hillsdale Assembly of God Church (E), Jonesville Baptist Church (F), United Methodist Church (G), Countryside Bible Church (H). Display/hide their locations on the map
Cemeteries: Case Cemetery (1), Johnson Cemetery (2), Moscow Cemetery (3), Buck Cemetery (4), Sunset View Cemetery (5), Blackmar Cemetery (6), Moscow Plains Cemetery (7). Display/hide their locations on the map
Lakes and reservoirs: Lacore Lake (A), Mosherville Lake (B), Hastings Lake (C), Half Moon Lake (D), Gray Lake (E), Cobb Lake (F), Buck Lake (G), Mill Pond (H). Display/hide their locations on the map
Parks in zip code 49250 include: Mosherville Church Historical Marker (1), Mosherville School Historical Marker (2), Michigan and Ohio Railroad Depot Historical Marker (3), Grace Episcopal Church Historical Marker (4), Grosvenor House Historical Marker (5). Display/hide their locations on the map
1,020 married couples with children.
197 single-parent households (63 men, 134 women).
98.6% of residents of 49250 zip code speak English at home.
0.5% of residents speak Spanish at home (80% very well, 20% well).
0.5% of residents speak other Indo-European language at home (100% very well).
0.3% of residents speak Asian or Pacific Island language at home (60% very well, 40% well).
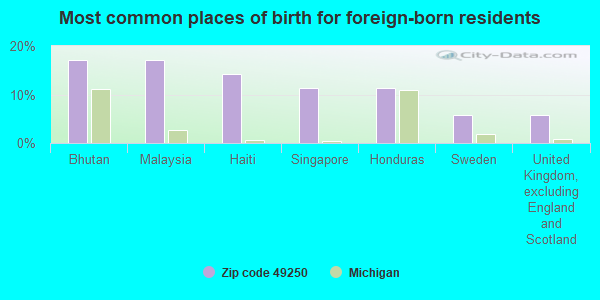
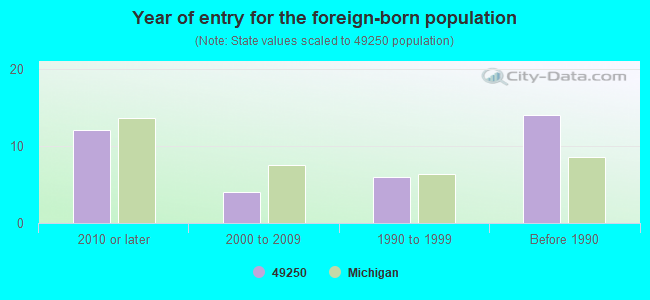
Foreign born population: 34 (0.6%) (29.6% of them are naturalized citizens)
This zip code:
0.6%
Whole state:
6.9%
17%Bhutan
17%Malaysia
14%Haiti
11%Singapore
11%Honduras
6%Sweden
6%United Kingdom, excluding England and Scotland
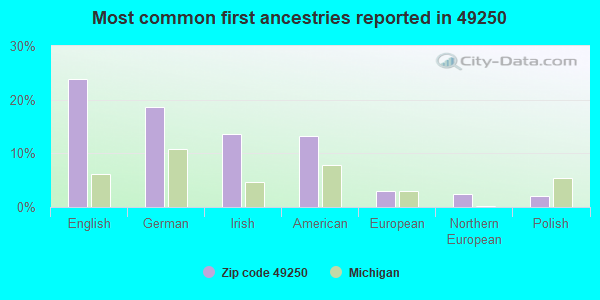
24%English
19%German
14%Irish
13%American
3%European
2%Northern European
2%Polish
Year of entry for the foreign-born population
122010 or later
42000 to 2009
61990 to 1999
14Before 1990
Facilities with environmental interests located in this zip code:
ADDISON PRODUCTS (260 GIAGE ST. in JONESVILLE, MI)
(Integrated Compliance Information System) - ICIS-05-1985-0541, FORMAL ENFORCEMENT ACTION TRI REPORTER (Tracking of toxic chemicals releasing facilities) Business SIC classification: AIR-CONDITIONING AND WARM AIR HEATING EQUIPMENT AND COMMERCIAL AND INDUSTRIAL REFRIGERATION EQUIPMENT; HOUSEHOLD APPLIANCES
ANNEX OIL CORP (1611 E CHICAGO RD in JONESVILLE, MI)
(Integrated Compliance Information System) - ICIS-05-1990-0187, FORMAL ENFORCEMENT ACTION Business SIC classification: LESSORS OF REAL PROPERTY
E P HILLSDALE TOOL DIVISION JONESVILLE PLANT (651 BECK ST. in JONESVILLE, MI)
AIR SYNTHETIC MINOR (AIRS/AFS) CRITERIA AND HAZARDOUS AIR POLLUTANT INVENTORY (Inventory of air pollution sources) HAZARDOUS WASTE BIENNIAL REPORTER (Resource Conservation and Recovery Act (tracking hazardous waste)) Small Quantity Generators, between 100 kg and 1000 kg of hazardous waste/month (Resource Conservation and Recovery Act (tracking hazardous waste)) TRI REPORTER (Tracking of toxic chemicals releasing facilities) Business SIC classification: COATING, ENGRAVING, AND ALLIED SERVICES; MOTOR VEHICLE PARTS AND ACCESSORIES Organizations: HILLSDALE TOOL & MFG CO (CONTACT/OPERATOR)
, EAGLE-PICHER HOLDINGS INC (CONTACT/OWNER)
Alternative names: HILLSDALE TOOL & MFG CO
ALPHI MANUFACTURING INC (576 BECK ST in JONESVILLE, MI)
Small Quantity Generators, between 100 kg and 1000 kg of hazardous waste/month (Resource Conservation and Recovery Act (tracking hazardous waste)) - notification Business NAICS classification: FABRICATED PIPE AND PIPE FITTING MANUFACTURING. Organizations: ALAN J. SYMONDS (CONTACT/OWNER)
, PHILLIP J MARSHALLSAY (CONTACT/OWNER)
Alternative names: TRIPLE A TUBE INC
BEST AMERICAN CAR WASHES (412 W CHICAGO ST in JONESVILLE, MI)
(Resource Conservation and Recovery Act (tracking hazardous waste)) Business NAICS classification: CAR WASHES. Organizations: R & J DISTRIBUTING LLC (CONTACT/OWNER)
MI DEPT/NATURAL RESOURCES (1121 E MOSHERVILLE RD in JONESVILLE, MI)
(Resource Conservation and Recovery Act (tracking hazardous waste)) Organizations: BRADFORD ARTHUR (CONTACT/OWNER)
Alternative names: DNR ERD
BILCOR PLASTICS INC (151 MOORE RD in JONESVILLE, MI)
(Resource Conservation and Recovery Act (tracking hazardous waste)) Business NAICS classification: PLASTICS MATERIAL AND RESIN MANUFACTURING.
MI DEPT/STATE POLICE (GENESSEE RD in JONESVILLE, MI)
(Resource Conservation and Recovery Act (tracking hazardous waste)) Alternative names: MI DEPT/STATE POLICE (E)
GODFREY BROS INC (1166 E CHICAGO RD in JONESVILLE, MI)
Small Quantity Generators, between 100 kg and 1000 kg of hazardous waste/month (Resource Conservation and Recovery Act (tracking hazardous waste)) - notification Organizations: GODFREY JACK AND GODFREY ROGER (CONTACT/OPERATOR)
GLACIAL SAND & GRAVEL (UNKNOWN in JONESVILLE, MI)
AIR SYNTHETIC MINOR (AIRS/AFS)
GLACIAL SAND & GRAVEL (1660 EAST CHICAGO ROAD (US12) in JONESVILLE, MI)
CRITERIA AND HAZARDOUS AIR POLLUTANT INVENTORY (Inventory of air pollution sources) Business SIC classification: CONSTRUCTION SAND AND GRAVEL
Housing units lacking complete plumbing facilities: 3.1% Housing units lacking complete kitchen facilities: 1.6%
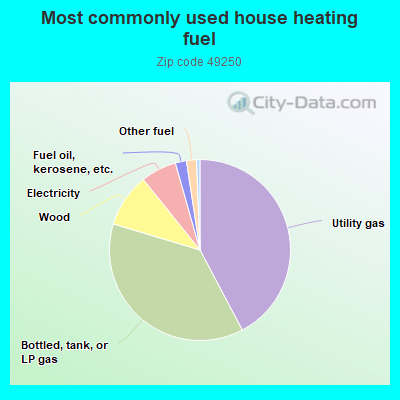
42.4%Utility gas
37.5%Bottled, tank, or LP gas
9.6%Wood
6.4%Electricity
2.0%Fuel oil, kerosene, etc.
1.8%Other fuel
0.6%No fuel used
Population in 1990: 5,671. Population change in the 1990s: +287 (+5.1%).
Place of birth for U.S.-born residents:
This state: 4,885
Northeast: 56
Midwest: 485
South: 264
West: 72
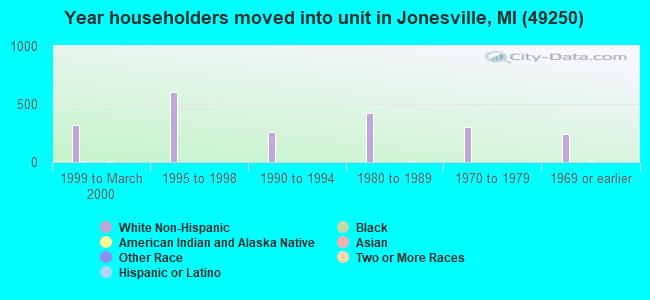
58% of the 49250 zip code residents lived in the same house 5 years ago. Out of people who lived in different houses, 60% lived in this county. Out of people who lived in different counties, 50% lived in Michigan.
93% of the 49250 zip code residents lived in the same house 1 year ago. Out of people who lived in different houses, 50% moved from this county. Out of people who lived in different houses, 35% moved from different county within same state. Out of people who lived in different houses, 15% moved from different state. Out of people who lived in different houses, 1% moved from abroad.
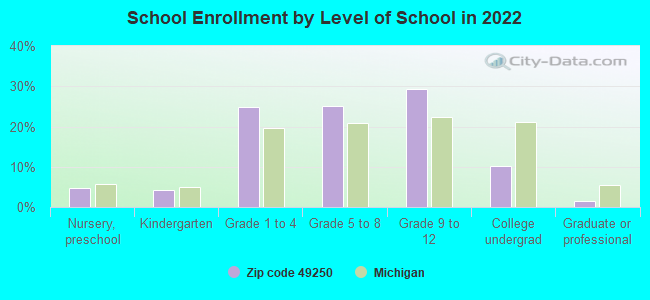
Private vs. public school enrollment:
Students in private schools in grades 1 to 8 (elementary and middle school): 63
Here:
10.8%
Michigan:
12.4%
Students in private schools in grades 9 to 12 (high school): 16
Here:
4.8%
Michigan:
9.8%
Students in private undergraduate colleges: 31
Here:
26.6%
Michigan:
14.9%
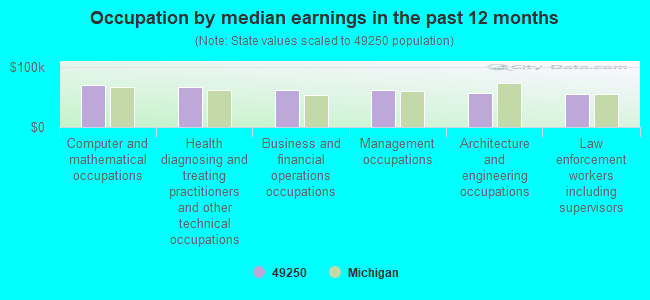
Occupation by median earnings in the past 12 months ($)
69,832Computer and mathematical occupations
66,332Health diagnosing and treating practitioners and other technical occupations
61,011Business and financial operations occupations
60,876Management occupations
56,416Architecture and engineering occupations
54,651Law enforcement workers including supervisors
Top industries in this zip code by the number of employees in 2005:
Construction: New Single-Family Housing Construction (except Operative Builders) (100-249 employees: 1 establishment, 10-19 employees: 1 establishment)
Health Care and Social Assistance: Other Community Housing Services (100-249: 1)
Finance and Insurance: Commercial Banking (50-99: 1, 10-19: 1)
People in group quarters in 2010:
50 people in residential treatment centers for juveniles (non-correctional)
36 people in residential schools for people with disabilities
27 people in group homes intended for adults
3 people in residential treatment centers for adults
People in group quarters in 2000:
96 people in homes for the mentally ill
17 people in other group homes
15 people in homes or halfway houses for drug/alcohol abuse
9 people in homes for the mentally retarded
Fatal accident statistics in 2014:
Fatal accident count: 1
Vehicles involved in fatal accidents: 2
Fatal accidents caused by drunken drivers: 0
Fatalities: 1
Persons involved in fatal accidents: 2
Pedestrians involved in fatal accidents: 0
Fatal accident statistics in 2012:
Fatal accident count: 3
Vehicles involved in fatal accidents: 5
Fatal accidents caused by drunken drivers: 1
Fatalities: 3
Persons involved in fatal accidents: 4
Pedestrians involved in fatal accidents: 1
2002 - 2018 National Fire Incident Reporting System (NFIRS) incidents
According to the data from the years 2002 - 2018 the average number of fires per year is 21. The highest number of fire incidents - 42 took place in 2004, and the least - 5 in 2018. The data has a dropping trend.
When looking into fire subcategories, the most incidents belonged to: Structure Fires (44.2%), and Outside Fires (39.0%).
Fire incident types reported to NFIRS in Zip Code 49250


 Nearest zip codes: 49241, 49242, 49252, 49237, 49246, 49227.


 According to the data from the years 2002 - 2018 the average number of fires per year is 21. The highest number of fire incidents - 42 took place in 2004, and the least - 5 in 2018. The data has a dropping trend.
 When looking into fire subcategories, the most incidents belonged to: Structure Fires (44.2%), and Outside Fires (39.0%).