Estimated zip code population in 2022: 2,677 Zip code population in 2010: 2,523 Zip code population in 2000: 2,789
Houses and condos: 1,248 Renter-occupied apartments: 64
% of renters here:
6%
State:
27%
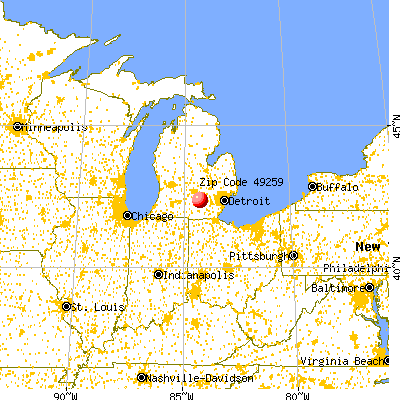
March 2022 cost of living index in zip code 49259: 81.6 (low, U.S. average is 100)
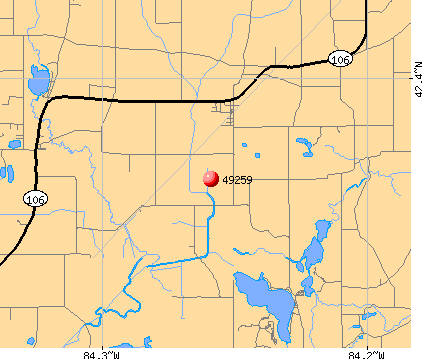
Land area: 28.0 sq. mi. Water area: 1.0 sq. mi.
Population density: 96 people per square mile
(very low).
OSM Map
General Map
Google Map
MSN Map
OSM Map
General Map
Google Map
MSN Map
OSM Map
General Map
Google Map
MSN Map
OSM Map
General Map
Google Map
MSN Map
Please wait while loading the map...
Real estate property taxes paid for housing units in 2022:
This zip code:
0.9% ($1,752)
Michigan:
1.2% ($2,746)
Median real estate property taxes paid for housing units with mortgages in 2022: $2,196 (1.0%) Median real estate property taxes paid for housing units with no mortgage in 2022: $1,299 (0.8%)
Business Search- 14 Million verified businesses
Males: 1,498
(56.0%)
Females: 1,178
(44.0%)
For population 25 years and over in 49259:
High school or higher: 95.1%
Bachelor's degree or higher: 18.0%
Graduate or professional degree: 6.3%
Unemployed: 11.9%
Mean travel time to work (commute): 29.4 minutes
For population 15 years and over in 49259:
Never married: 29.3%
Now married: 54.4%
Separated: 1.3%
Widowed: 3.7%
Divorced: 11.3%
Zip code 49259 compared to state average:
Unemployed percentage above state average.
Black race population percentage significantly below state average.
Hispanic race population percentage below state average.
Foreign-born population percentage significantly below state average.
Renting percentage significantly below state average.
Length of stay since moving in above state average.
Percentage of population with a bachelor's degree or higher below state average.
Averages for the 2020 tax year for zip code 49259, filed in 2021:
Average Adjusted Gross Income (AGI) in 2020: $56,730 (Individual Income Tax Returns)
Here:
$56,730
State:
$68,945
Salary/wage: $50,844 (reported on 78.7% of returns)
Here:
$50,844
State:
$57,142
(% of AGI for various income ranges: 811.9% for AGIs below $25k, 3276.5% for AGIs $25k-50k, 5989.4% for AGIs $50k-75k, 8983.3% for AGIs $75k-100k, 18573.6% for AGIs $100k-200k)
Taxable interest for individuals: $718 (reported on 27.9% of returns)
This zip code:
$718
Michigan:
$1,630
(% of AGI for various income ranges: 17.4% for AGIs below $25k, 5.4% for AGIs $25k-50k, 35.0% for AGIs $50k-75k, 22.2% for AGIs $75k-100k, 97.3% for AGIs $100k-200k)
Ordinary dividends: $2,089 (reported on 14.8% of returns)
Here:
$2,089
State:
$6,972
(% of AGI for various income ranges: 20.4% for AGIs below $25k, 14.2% for AGIs $25k-50k, 62.5% for AGIs $50k-75k, 82.2% for AGIs $75k-100k, 100.0% for AGIs $100k-200k)
Net capital gain/loss in AGI: +$5,873 (reported on 12.3% of returns)
Here:
+$5,873
State:
+$20,064
(% of AGI for various income ranges: 4.1% for AGIs below $25k, 10.8% for AGIs $25k-50k, 51.2% for AGIs $50k-75k, 83.3% for AGIs $75k-100k, 622.7% for AGIs $100k-200k)
Profit/loss from business: +$6,221 (reported on 11.5% of returns)
Here:
+$6,221
State:
+$11,172
(% of AGI for various income ranges: 66.7% for AGIs below $25k, 130.8% for AGIs $25k-50k, 101.9% for AGIs $50k-75k, 170.9% for AGIs $100k-200k)
Taxable individual retirement arrangement distribution: $16,792 (reported on 9.8% of returns)
49259:
$16,792
Michigan:
$19,803
(% of AGI for various income ranges: 153.0% for AGIs below $25k, 370.0% for AGIs $50k-75k, 918.2% for AGIs $100k-200k)
Total itemized deductions: $26,375 (reported on 3.3% of returns)
Here:
$26,375
State:
$34,117
(% of AGI for various income ranges: 959.1% for AGIs $100k-200k)
Charity contributions: $5,333 (reported on 2.5% of returns)
Here:
$5,333
State:
$13,548
(% of AGI for various income ranges: 145.5% for AGIs $100k-200k)
Taxes paid: $7,400 (reported on 3.3% of returns)
49259:
$7,400
State:
$7,972
(% of AGI for various income ranges: 34.1% for AGIs below $25k, 185.5% for AGIs $100k-200k)
Earned income credit: $1,976 (reported on 13.9% of returns)
Here:
$1,976
State:
$2,251
(% of AGI for various income ranges: 57.8% for AGIs below $25k, 69.2% for AGIs $25k-50k)
Percentage of individuals using paid preparers for their 2020 taxes: 91.8%
Here:
92%
State:
93%
(% for various income ranges: 91.9% for AGIs below $25k, 90.9% for AGIs $25k-50k, 90.5% for AGIs $50k-75k, 91.7% for AGIs $75k-100k, 94.7% for AGIs $100k-200k)
Averages for the 2012 tax year for zip code 49259, filed in 2013:
Average Adjusted Gross Income (AGI) in 2012: $44,421 (Individual Income Tax Returns)
Here:
$44,421
State:
$55,609
Salary/wage: $41,149 (reported on 81.7% of returns)
Here:
$41,149
State:
$46,782
(% of AGI for various income ranges: 64.2% for AGIs below $25k, 74.2% for AGIs $25k-50k, 75.4% for AGIs $50k-75k, 82.5% for AGIs $75k-100k, 75.9% for AGIs $100k-200k)
Taxable interest for individuals: $800 (reported on 31.3% of returns)
This zip code:
$800
Michigan:
$1,491
(% of AGI for various income ranges: 1.6% for AGIs below $25k, 1.0% for AGIs $25k-50k, 0.4% for AGIs $50k-75k, 0.1% for AGIs $75k-100k, 0.4% for AGIs $100k-200k)
Ordinary dividends: $1,793 (reported on 13.0% of returns)
Here:
$1,793
State:
$6,225
(% of AGI for various income ranges: 0.5% for AGIs below $25k, 0.7% for AGIs $25k-50k, 1.0% for AGIs $50k-75k, 0.2% for AGIs $75k-100k, 0.3% for AGIs $100k-200k)
Net capital gain/loss in AGI: +$400 (reported on 8.7% of returns)
Here:
+$400
State:
+$9,326
(% of AGI for various income ranges: 0.4% for AGIs $75k-100k)
Profit/loss from business: +$6,500 (reported on 13.0% of returns)
Here:
+$6,500
State:
+$11,523
(% of AGI for various income ranges: 8.2% for AGIs below $25k, 1.6% for AGIs $25k-50k, 1.4% for AGIs $50k-75k, 1.6% for AGIs $100k-200k)
Taxable individual retirement arrangement distribution: $14,792 (reported on 10.4% of returns)
49259:
$14,792
Michigan:
$15,298
(% of AGI for various income ranges: 2.7% for AGIs below $25k, 3.2% for AGIs $25k-50k, 3.0% for AGIs $50k-75k, 8.5% for AGIs $75k-100k)
Total itemized deductions: $17,253 (22% of AGI, reported on 26.1% of returns)
Here:
$17,253
State:
$21,628
Here:
21.9% of AGI
State:
18.4% of AGI
(% of AGI for various income ranges: 6.9% for AGIs below $25k, 8.2% for AGIs $25k-50k, 9.5% for AGIs $50k-75k, 10.9% for AGIs $75k-100k, 12.7% for AGIs $100k-200k)
Charity contributions: $2,161 (reported on 20.0% of returns)
Here:
$2,161
State:
$4,225
(% of AGI for various income ranges: 0.5% for AGIs $25k-50k, 1.3% for AGIs $50k-75k, 1.1% for AGIs $75k-100k, 1.4% for AGIs $100k-200k)
Taxes paid: $5,513 (reported on 26.1% of returns)
49259:
$5,513
State:
$8,327
(% of AGI for various income ranges: 1.4% for AGIs below $25k, 2.2% for AGIs $25k-50k, 2.6% for AGIs $50k-75k, 3.5% for AGIs $75k-100k, 5.0% for AGIs $100k-200k)
Earned income credit: $2,190 (reported on 17.4% of returns)
Here:
$2,190
State:
$2,306
(% of AGI for various income ranges: 6.0% for AGIs below $25k, 1.0% for AGIs $25k-50k)
Percentage of individuals using paid preparers for their 2012 taxes: 54.8%
Here:
55%
State:
57%
(% for various income ranges: 51.1% for AGIs below $25k, 53.6% for AGIs $25k-50k, 62.5% for AGIs $50k-75k, 57.1% for AGIs $75k-100k, 60.0% for AGIs $100k-200k)
Averages for the 2004 tax year for zip code 49259, filed in 2005:
Average Adjusted Gross Income (AGI) in 2004: $40,052 (Individual Income Tax Returns)
Here:
$40,052
State:
$48,204
Salary/wage: $37,850 (reported on 86.1% of returns)
Here:
$37,850
State:
$42,791
(% of AGI for various income ranges: 83.7% for AGIs below $10k, 73.1% for AGIs $10k-25k, 79.5% for AGIs $25k-50k, 84.5% for AGIs $50k-75k, 89.6% for AGIs $75k-100k, 75.1% for AGIs over 100k)
Taxable interest for individuals: $1,026 (reported on 42.4% of returns)
This zip code:
$1,026
Michigan:
$1,725
(% of AGI for various income ranges: 3.8% for AGIs below $10k, 2.5% for AGIs $10k-25k, 1.4% for AGIs $25k-50k, 1.2% for AGIs $50k-75k, 0.3% for AGIs $75k-100k, 0.3% for AGIs over 100k)
Taxable dividends: $1,178 (reported on 16.9% of returns)
Here:
$1,178
State:
$3,420
(% of AGI for various income ranges: 1.4% for AGIs below $10k, 0.9% for AGIs $10k-25k, 0.2% for AGIs $25k-50k, 0.6% for AGIs $50k-75k, 0.2% for AGIs $75k-100k, 0.6% for AGIs over 100k)
Net capital gain/loss: +$6,356 (reported on 10.5% of returns)
Here:
+$6,356
State:
+$8,532
(% of AGI for various income ranges: -0.4% for AGIs below $10k, 0.0% for AGIs $10k-25k, -0.1% for AGIs $25k-50k, 1.2% for AGIs $50k-75k, 0.2% for AGIs $75k-100k, 6.6% for AGIs over 100k)
Profit/loss from business: +$2,611 (reported on 11.8% of returns)
Here:
+$2,611
State:
+$9,547
(% of AGI for various income ranges: -3.0% for AGIs below $10k, -1.0% for AGIs $10k-25k, 5.0% for AGIs $25k-50k, -0.5% for AGIs $50k-75k, -0.3% for AGIs over 100k)
IRA payment deduction: $2,176 (reported on 1.4% of returns)
49259:
$2,176
Michigan:
$2,875
Total itemized deductions: $15,566 (23% of AGI, reported on 34.6% of returns)
Here:
$15,566
State:
$18,509
Here:
23.2% of AGI
State:
20.7% of AGI
(% of AGI for various income ranges: 15.0% for AGIs below $10k, 5.8% for AGIs $10k-25k, 11.6% for AGIs $25k-50k, 17.1% for AGIs $50k-75k, 13.2% for AGIs $75k-100k, 13.5% for AGIs over 100k)
Charity contributions deductions: $1,736 (2% of AGI, reported on 29.3% of returns)
Here:
$1,736
State:
$3,365
Here:
2.5% of AGI
State:
3.6% of AGI
(% of AGI for various income ranges: 0.5% for AGIs $10k-25k, 1.0% for AGIs $25k-50k, 1.3% for AGIs $50k-75k, 1.5% for AGIs $75k-100k, 1.8% for AGIs over 100k)
Total tax: $4,624 (reported on 75.3% of returns)
49259:
$4,624
State:
$7,691
(% of AGI for various income ranges: 3.1% for AGIs below $10k, 3.6% for AGIs $10k-25k, 6.8% for AGIs $25k-50k, 7.5% for AGIs $50k-75k, 10.0% for AGIs $75k-100k, 14.4% for AGIs over 100k)
Earned income credit: $1,611 (reported on 15.1% of returns)
Here:
$1,611
State:
$1,737
Percentage of individuals using paid preparers for their 2004 taxes: 62.0%
Here:
62%
State:
60%
(% for various income ranges: 55.3% for AGIs below $10k, 59.7% for AGIs $10k-25k, 65.7% for AGIs $25k-50k, 65.4% for AGIs $50k-75k, 60.4% for AGIs $75k-100k, 69.3% for AGIs over 100k)
Likely homosexual households (counted as self-reported same-sex unmarried-partner households)
Lesbian couples: 0.3% of all households
Gay men: 0.0% of all households
Household received Food Stamps/SNAP in the past 12 months: 168 Household did not receive Food Stamps/SNAP in the past 12 months: 960
Women who had a birth in the past 12 months: 66 (12 now married, 51 unmarried) Women who did not have a birth in the past 12 months: 428 (231 now married, 195 unmarried)
Housing units in zip code 49259 with a mortgage: 502 (19 second mortgage, 14 both second mortgage and home equity loan) Median monthly owner costs for units with a mortgage: $1,330 Median monthly owner costs for units without a mortgage: $383
Residents with income below the poverty level in 2022:
This zip code:
7.1%
Whole state:
13.4%
Residents with income below 50% of the poverty level in 2022:
This zip code:
1.6%
Whole state:
6.9%
Median number of rooms in houses and condos:
Here:
5.9
State:
6.5
Median number of rooms in apartments:
Here:
6.9
State:
4.3
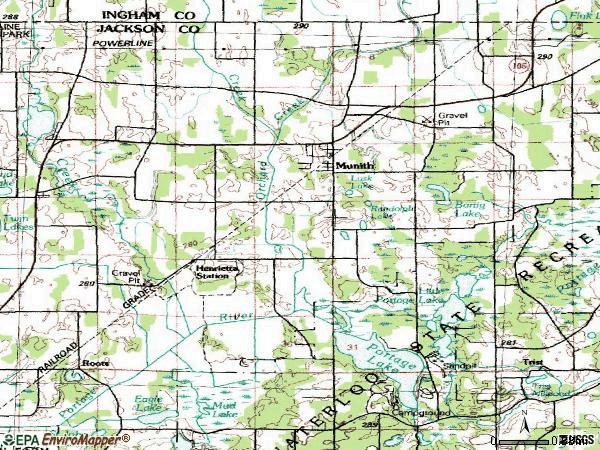
Notable locations in this zip code not listed on our city pages
Churches in zip code 49259 include: Waterloo Church (A), Munith United Methodist Church (B), Jeruel Baptist Church (C). Display/hide their locations on the map
Size of family households: 504 2-persons, 207 3-persons, 82 4-persons, 29 5-persons, 3 6-persons, 20 7-or-more-persons
Size of nonfamily households: 195 1-person, 88 2-persons
338 married couples with children.
128 single-parent households (88 men, 40 women).
98.2% of residents of 49259 zip code speak English at home.
1.9% of residents speak Spanish at home (77% very well, 23% well).
Foreign born population: 54 (2.0%) (82.2% of them are naturalized citizens)
This zip code:
2.0%
Whole state:
6.9%
37%Iran
37%El Salvador
17%Honduras
23%American
22%European
17%English
12%German
4%Irish
3%Polish
2%Swedish
Year of entry for the foreign-born population
02010 or later
422000 to 2009
91990 to 1999
10Before 1990
Facilities with environmental interests located in this zip code:
ELDON KATZ SCHOOL (11120 MUSBACH ROAD in MUNITH, MI)
(National Center for Education Statistics) - STATE ID-01102 Organizations: STOCKBRIDGE COMMUNITY SCHOOLS (SCHOOL DISTRICT)
MI DEPT/ENVIRONMENTAL QUALITY (329 N MAIN ST in MUNITH, MI)
(Resource Conservation and Recovery Act (tracking hazardous waste)) Alternative names: MI DEPT/ENVIRONMENTAL QUALITY RRD
Housing units lacking complete kitchen facilities: 0.5%
51.5%Utility gas
37.1%Bottled, tank, or LP gas
4.2%Wood
3.1%Electricity
2.6%Fuel oil, kerosene, etc.
1.8%Other fuel
Population in 1990: 3,078.
Place of birth for U.S.-born residents:
This state: 2,196
Northeast: 30
Midwest: 193
South: 152
West: 37
65% of the 49259 zip code residents lived in the same house 5 years ago. Out of people who lived in different houses, 49% lived in this county. Out of people who lived in different counties, 50% lived in Michigan.
96% of the 49259 zip code residents lived in the same house 1 year ago. Out of people who lived in different houses, 40% moved from this county. Out of people who lived in different houses, 5% moved from different county within same state. Out of people who lived in different houses, 69% moved from different state.
Private vs. public school enrollment:
Students in private schools in grades 1 to 8 (elementary and middle school): 34
Here:
23.6%
Michigan:
12.4%
Students in private schools in grades 9 to 12 (high school): 11
Here:
11.8%
Michigan:
9.8%
Students in private undergraduate colleges: 32
Here:
24.2%
Michigan:
14.9%
Occupation by median earnings in the past 12 months ($)
107,838Computer and mathematical occupations
90,986Architecture and engineering occupations
85,774Transportation occupations
71,610Installation, maintenance, and repair occupations
66,542Business and financial operations occupations
56,656Management occupations
Top industries in this zip code by the number of employees in 2005:
Finance and Insurance: Commercial Banking (20-49 employees: 1 establishment)
Wholesale Trade: Other Farm Product Raw Material Merchant Wholesalers (10-19: 1)
Mining: Support Activities for Oil and Gas Operations (5-9: 1)
Accommodation and Food Services: Full-Service Restaurants (1-4: 2)
Accommodation and Food Services: RV (Recreational Vehicle) Parks and Campgrounds (1-4: 1)
Construction: Residential Remodelers (1-4: 1)
Fatal accident statistics in 2014:
Fatal accident count: 2
Vehicles involved in fatal accidents: 3
Fatal accidents caused by drunken drivers: 2
Fatalities: 2
Persons involved in fatal accidents: 3
Pedestrians involved in fatal accidents: 0
Fatal accident statistics in 2012:
Fatal accident count: 2
Vehicles involved in fatal accidents: 2
Fatal accidents caused by drunken drivers: 2
Fatalities: 3
Persons involved in fatal accidents: 3
Pedestrians involved in fatal accidents: 0
Home Mortgage Disclosure Act Aggregated Statistics For Year 2009 (Based on 4 partial tracts)
A) FHA, FSA/RHS & VA Home Purchase Loans
B) Conventional Home Purchase Loans
C) Refinancings
D) Home Improvement Loans
F) Non-occupant Loans on < 5 Family Dwellings (A B C & D)
G) Loans On Manufactured Home Dwelling (A B C & D)
Number
Average Value
Number
Average Value
Number
Average Value
Number
Average Value
Number
Average Value
Number
Average Value
LOANS ORIGINATED
26
$112,314
14
$99,434
112
$133,469
10
$43,875
9
$136,809
10
$69,033
APPLICATIONS APPROVED, NOT ACCEPTED
2
$124,645
2
$88,275
11
$149,687
0
$0
2
$60,615
2
$50,445
APPLICATIONS DENIED
3
$72,757
6
$70,208
47
$146,369
10
$44,534
3
$73,720
7
$53,521
APPLICATIONS WITHDRAWN
2
$100,660
1
$60,210
21
$142,792
4
$70,208
1
$34,170
1
$142,830
FILES CLOSED FOR INCOMPLETENESS
0
$0
0
$0
3
$117,143
0
$0
0
$0
0
$0
Aggregated Statistics For Year 2008 (Based on 4 partial tracts)
A) FHA, FSA/RHS & VA Home Purchase Loans
B) Conventional Home Purchase Loans
C) Refinancings
D) Home Improvement Loans
F) Non-occupant Loans on < 5 Family Dwellings (A B C & D)
G) Loans On Manufactured Home Dwelling (A B C & D)
Number
Average Value
Number
Average Value
Number
Average Value
Number
Average Value
Number
Average Value
Number
Average Value
LOANS ORIGINATED
22
$108,860
30
$89,655
88
$123,950
19
$28,238
14
$82,424
16
$53,139
APPLICATIONS APPROVED, NOT ACCEPTED
1
$107,890
3
$45,970
19
$167,920
2
$99,740
3
$64,683
2
$107,405
APPLICATIONS DENIED
3
$116,253
7
$73,819
64
$150,002
5
$77,722
4
$61,110
7
$82,869
APPLICATIONS WITHDRAWN
3
$103,640
3
$87,043
25
$170,025
2
$118,675
2
$67,125
1
$97,630
FILES CLOSED FOR INCOMPLETENESS
0
$0
0
$0
5
$149,202
0
$0
0
$0
0
$0
Aggregated Statistics For Year 2007 (Based on 4 partial tracts)
A) FHA, FSA/RHS & VA Home Purchase Loans
B) Conventional Home Purchase Loans
C) Refinancings
D) Home Improvement Loans
F) Non-occupant Loans on < 5 Family Dwellings (A B C & D)
G) Loans On Manufactured Home Dwelling (A B C & D)
Number
Average Value
Number
Average Value
Number
Average Value
Number
Average Value
Number
Average Value
Number
Average Value
LOANS ORIGINATED
9
$125,610
55
$134,722
116
$139,002
32
$49,244
11
$131,703
18
$71,673
APPLICATIONS APPROVED, NOT ACCEPTED
0
$0
4
$140,752
21
$150,074
4
$83,398
0
$0
1
$61,830
APPLICATIONS DENIED
4
$79,050
9
$101,222
113
$138,698
21
$74,852
7
$130,447
13
$57,544
APPLICATIONS WITHDRAWN
1
$52,880
9
$93,267
41
$158,086
4
$70,378
3
$96,647
2
$56,950
FILES CLOSED FOR INCOMPLETENESS
0
$0
1
$161,130
11
$165,635
0
$0
0
$0
0
$0
Aggregated Statistics For Year 2006 (Based on 4 partial tracts)
A) FHA, FSA/RHS & VA Home Purchase Loans
B) Conventional Home Purchase Loans
C) Refinancings
D) Home Improvement Loans
F) Non-occupant Loans on < 5 Family Dwellings (A B C & D)
G) Loans On Manufactured Home Dwelling (A B C & D)
Number
Average Value
Number
Average Value
Number
Average Value
Number
Average Value
Number
Average Value
Number
Average Value
LOANS ORIGINATED
14
$120,923
71
$122,676
164
$123,513
39
$44,590
19
$141,194
19
$83,114
APPLICATIONS APPROVED, NOT ACCEPTED
0
$0
11
$128,561
39
$127,774
3
$163,020
4
$154,430
4
$74,825
APPLICATIONS DENIED
0
$0
17
$96,160
156
$143,204
28
$89,487
6
$120,597
17
$89,845
APPLICATIONS WITHDRAWN
0
$0
6
$192,058
79
$143,321
8
$76,671
3
$122,207
5
$99,810
FILES CLOSED FOR INCOMPLETENESS
0
$0
1
$260,360
24
$141,608
1
$42,310
0
$0
0
$0
Aggregated Statistics For Year 2005 (Based on 4 partial tracts)
A) FHA, FSA/RHS & VA Home Purchase Loans
B) Conventional Home Purchase Loans
C) Refinancings
D) Home Improvement Loans
F) Non-occupant Loans on < 5 Family Dwellings (A B C & D)
G) Loans On Manufactured Home Dwelling (A B C & D)
Number
Average Value
Number
Average Value
Number
Average Value
Number
Average Value
Number
Average Value
Number
Average Value
LOANS ORIGINATED
7
$133,544
98
$128,518
217
$127,633
42
$49,481
21
$118,360
15
$79,821
APPLICATIONS APPROVED, NOT ACCEPTED
0
$0
11
$120,763
34
$123,134
4
$47,800
3
$111,433
3
$89,523
APPLICATIONS DENIED
2
$129,360
41
$110,426
158
$138,451
18
$51,869
3
$101,990
13
$100,433
APPLICATIONS WITHDRAWN
0
$0
20
$118,591
82
$170,340
7
$85,071
7
$119,716
3
$110,923
FILES CLOSED FOR INCOMPLETENESS
0
$0
3
$75,287
45
$178,196
1
$16,270
2
$117,970
3
$99,763
Aggregated Statistics For Year 2004 (Based on 4 partial tracts)
A) FHA, FSA/RHS & VA Home Purchase Loans
B) Conventional Home Purchase Loans
C) Refinancings
D) Home Improvement Loans
F) Non-occupant Loans on < 5 Family Dwellings (A B C & D)
G) Loans On Manufactured Home Dwelling (A B C & D)
Number
Average Value
Number
Average Value
Number
Average Value
Number
Average Value
Number
Average Value
Number
Average Value
LOANS ORIGINATED
12
$126,874
95
$133,037
222
$132,608
34
$52,971
18
$94,914
24
$75,502
APPLICATIONS APPROVED, NOT ACCEPTED
1
$86,240
14
$131,666
33
$134,700
4
$45,332
1
$65,090
8
$72,756
APPLICATIONS DENIED
1
$67,530
22
$104,024
147
$123,312
13
$59,625
6
$113,133
24
$83,161
APPLICATIONS WITHDRAWN
0
$0
9
$110,602
67
$152,575
7
$69,996
3
$82,720
4
$59,498
FILES CLOSED FOR INCOMPLETENESS
0
$0
3
$119,163
44
$148,009
1
$36,210
0
$0
3
$129,930
Aggregated Statistics For Year 2003 (Based on 4 partial tracts)
A) FHA, FSA/RHS & VA Home Purchase Loans
B) Conventional Home Purchase Loans
C) Refinancings
D) Home Improvement Loans
F) Non-occupant Loans on < 5 Family Dwellings (A B C & D)
Number
Average Value
Number
Average Value
Number
Average Value
Number
Average Value
Number
Average Value
LOANS ORIGINATED
13
$127,672
84
$127,601
468
$124,404
30
$38,403
17
$105,414
APPLICATIONS APPROVED, NOT ACCEPTED
0
$0
7
$116,897
58
$136,427
1
$159,540
2
$90,555
APPLICATIONS DENIED
1
$76,480
14
$90,171
174
$128,000
12
$19,830
3
$66,443
APPLICATIONS WITHDRAWN
0
$0
10
$96,166
69
$144,928
2
$24,810
2
$52,885
FILES CLOSED FOR INCOMPLETENESS
2
$119,190
1
$73,220
24
$140,230
0
$0
0
$0
Aggregated Statistics For Year 1999 (Based on 2 partial tracts)
A) FHA, FSA/RHS & VA Home Purchase Loans
B) Conventional Home Purchase Loans
C) Refinancings
D) Home Improvement Loans
F) Non-occupant Loans on < 5 Family Dwellings (A B C & D)
Detailed PMIC statistics for the following Tracts:0067.02
, 0068.01
2002 - 2018 National Fire Incident Reporting System (NFIRS) incidents
According to the data from the years 2002 - 2018 the average number of fires per year is 8. The highest number of fire incidents - 22 took place in 2015, and the least - 0 in 2006. The data has a dropping trend.
When looking into fire subcategories, the most incidents belonged to: Structure Fires (47.0%), and Outside Fires (39.6%).
Fire incident types reported to NFIRS in Zip Code 49259


 Nearest zip codes: 49272, 49285, 49240, 49254, 49251, 48819.


 According to the data from the years 2002 - 2018 the average number of fires per year is 8. The highest number of fire incidents - 22 took place in 2015, and the least - 0 in 2006. The data has a dropping trend.
 When looking into fire subcategories, the most incidents belonged to: Structure Fires (47.0%), and Outside Fires (39.6%).