Estimated zip code population in 2022: 1,941 Zip code population in 2010: 2,256 Zip code population in 2000: 2,347
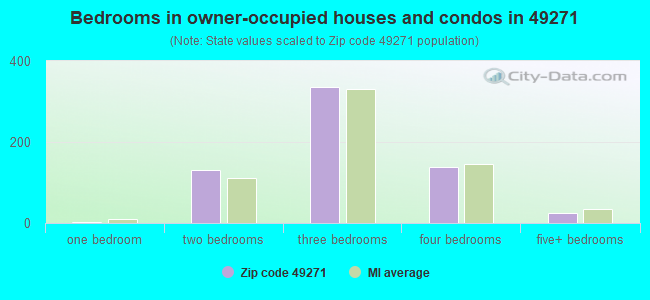
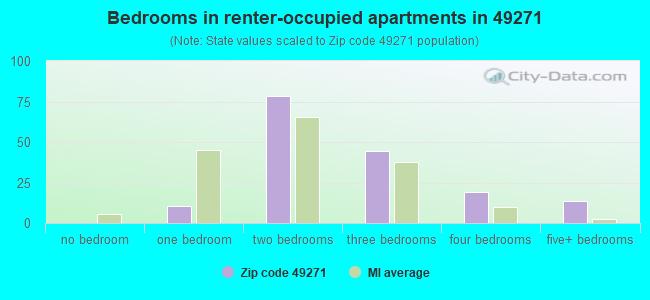
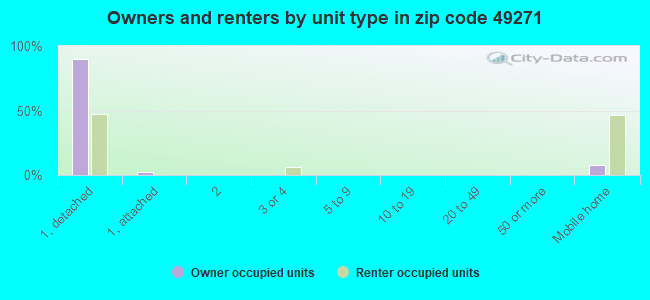
Houses and condos: 918 Renter-occupied apartments: 164
% of renters here:
21%
State:
27%
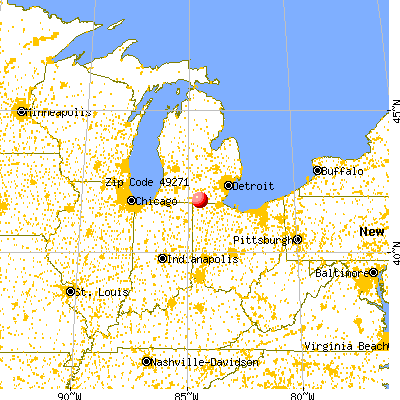
March 2022 cost of living index in zip code 49271: 81.0 (low, U.S. average is 100)
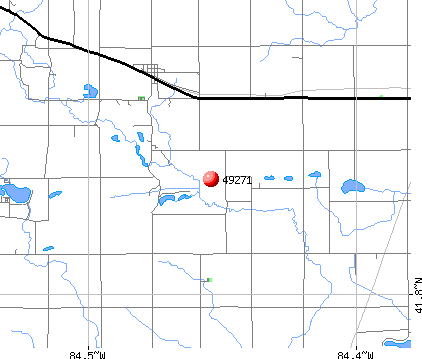
Land area: 55.1 sq. mi. Water area: 0.2 sq. mi.
Population density: 35 people per square mile
(very low).
OSM Map
General Map
Google Map
MSN Map
OSM Map
General Map
Google Map
MSN Map
OSM Map
General Map
Google Map
MSN Map
OSM Map
General Map
Google Map
MSN Map
Please wait while loading the map...
Real estate property taxes paid for housing units in 2022:
This zip code:
0.9% ($1,266)
Michigan:
1.2% ($2,746)
Median real estate property taxes paid for housing units with mortgages in 2022: $1,262 (0.9%) Median real estate property taxes paid for housing units with no mortgage in 2022: $1,280 (1.0%)
Business Search- 14 Million verified businesses
Males: 926
(47.7%)
Females: 1,015
(52.3%)
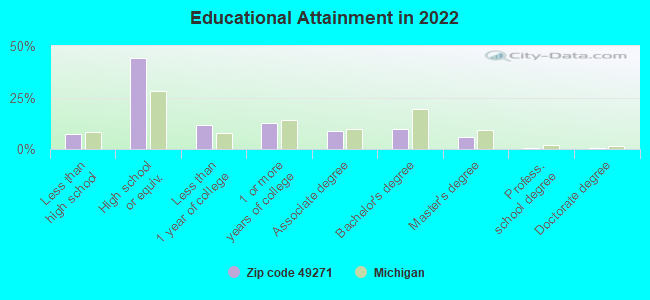
For population 25 years and over in 49271:
High school or higher: 91.7%
Bachelor's degree or higher: 16.1%
Graduate or professional degree: 6.7%
Unemployed: 1.7%
Mean travel time to work (commute): 25.0 minutes
For population 15 years and over in 49271:
Never married: 22.7%
Now married: 52.9%
Separated: 5.1%
Widowed: 6.6%
Divorced: 12.7%
Zip code 49271 compared to state average:
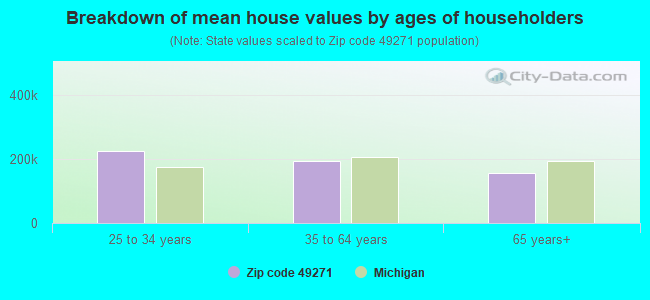
Median house value below state average.
Unemployed percentage below state average.
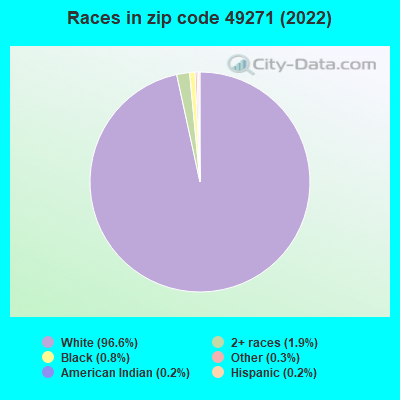
Black race population percentage significantly below state average.
Hispanic race population percentage significantly below state average.
Foreign-born population percentage significantly below state average.
Length of stay since moving in significantly above state average.
Percentage of population with a bachelor's degree or higher below state average.
Averages for the 2020 tax year for zip code 49271, filed in 2021:
Average Adjusted Gross Income (AGI) in 2020: $46,642 (Individual Income Tax Returns)
Here:
$46,642
State:
$68,945
Salary/wage: $41,426 (reported on 78.0% of returns)
Here:
$41,426
State:
$57,142
(% of AGI for various income ranges: 1002.5% for AGIs below $25k, 3203.8% for AGIs $25k-50k, 6165.0% for AGIs $50k-75k, 9298.6% for AGIs $75k-100k, 15451.7% for AGIs $100k-200k)
Taxable interest for individuals: $375 (reported on 20.0% of returns)
This zip code:
$375
Michigan:
$1,630
(% of AGI for various income ranges: 6.2% for AGIs below $25k, 5.2% for AGIs $25k-50k, 5.8% for AGIs $50k-75k, 27.1% for AGIs $75k-100k, 38.3% for AGIs $100k-200k)
Ordinary dividends: $1,955 (reported on 11.0% of returns)
Here:
$1,955
State:
$6,972
(% of AGI for various income ranges: 9.2% for AGIs below $25k, 21.9% for AGIs $25k-50k, 25.8% for AGIs $50k-75k, 193.3% for AGIs $100k-200k)
Net capital gain/loss in AGI: +$2,482 (reported on 11.0% of returns)
Here:
+$2,482
State:
+$20,064
(% of AGI for various income ranges: 12.1% for AGIs below $25k, 93.3% for AGIs $50k-75k, 220.0% for AGIs $100k-200k)
Profit/loss from business: +$12,938 (reported on 13.0% of returns)
Here:
+$12,938
State:
+$11,172
(% of AGI for various income ranges: 138.3% for AGIs below $25k, 292.9% for AGIs $25k-50k, 1050.0% for AGIs $75k-100k)
Taxable individual retirement arrangement distribution: $13,456 (reported on 9.0% of returns)
49271:
$13,456
Michigan:
$19,803
(% of AGI for various income ranges: 86.7% for AGIs below $25k, 184.8% for AGIs $25k-50k, 878.6% for AGIs $75k-100k)
Earned income credit: $2,312 (reported on 17.0% of returns)
Here:
$2,312
State:
$2,251
(% of AGI for various income ranges: 94.6% for AGIs below $25k, 79.0% for AGIs $25k-50k)
Percentage of individuals using paid preparers for their 2020 taxes: 94.0%
Here:
94%
State:
93%
(% for various income ranges: 94.4% for AGIs below $25k, 96.2% for AGIs $25k-50k, 88.2% for AGIs $50k-75k, 100.0% for AGIs $75k-100k, 90.9% for AGIs $100k-200k)
Averages for the 2012 tax year for zip code 49271, filed in 2013:
Average Adjusted Gross Income (AGI) in 2012: $39,443 (Individual Income Tax Returns)
Here:
$39,443
State:
$55,609
Salary/wage: $37,263 (reported on 78.5% of returns)
Here:
$37,263
State:
$46,782
(% of AGI for various income ranges: 64.6% for AGIs below $25k, 76.0% for AGIs $25k-50k, 80.6% for AGIs $50k-75k, 80.8% for AGIs $75k-100k, 65.5% for AGIs $100k-200k)
Taxable interest for individuals: $850 (reported on 25.8% of returns)
This zip code:
$850
Michigan:
$1,491
(% of AGI for various income ranges: 1.6% for AGIs below $25k, 0.5% for AGIs $25k-50k, 0.6% for AGIs $50k-75k, 0.2% for AGIs $75k-100k, 0.3% for AGIs $100k-200k)
Ordinary dividends: $1,567 (reported on 16.1% of returns)
Here:
$1,567
State:
$6,225
(% of AGI for various income ranges: 1.1% for AGIs below $25k, 0.6% for AGIs $25k-50k, 0.8% for AGIs $50k-75k, 0.2% for AGIs $75k-100k, 0.6% for AGIs $100k-200k)
Net capital gain/loss in AGI: +$1,740 (reported on 10.8% of returns)
Here:
+$1,740
State:
+$9,326
(% of AGI for various income ranges: 0.7% for AGIs below $25k, 2.2% for AGIs $75k-100k)
Profit/loss from business: +$6,464 (reported on 15.1% of returns)
Here:
+$6,464
State:
+$11,523
(% of AGI for various income ranges: 8.7% for AGIs below $25k, 3.9% for AGIs $25k-50k, 0.7% for AGIs $50k-75k, 1.3% for AGIs $75k-100k)
Taxable individual retirement arrangement distribution: $9,100 (reported on 10.8% of returns)
49271:
$9,100
Michigan:
$15,298
(% of AGI for various income ranges: 4.1% for AGIs below $25k, 2.4% for AGIs $25k-50k, 6.0% for AGIs $50k-75k)
Total itemized deductions: $14,680 (22% of AGI, reported on 16.1% of returns)
Here:
$14,680
State:
$21,628
Here:
22.3% of AGI
State:
18.4% of AGI
(% of AGI for various income ranges: 6.3% for AGIs below $25k, 4.3% for AGIs $25k-50k, 6.0% for AGIs $50k-75k, 6.3% for AGIs $75k-100k, 7.5% for AGIs $100k-200k)
Charity contributions: $4,240 (reported on 10.8% of returns)
Here:
$4,240
State:
$4,225
(% of AGI for various income ranges: 1.0% for AGIs $25k-50k, 1.3% for AGIs $50k-75k, 1.6% for AGIs $75k-100k, 1.6% for AGIs $100k-200k)
Taxes paid: $3,973 (reported on 16.1% of returns)
49271:
$3,973
State:
$8,327
(% of AGI for various income ranges: 0.9% for AGIs below $25k, 0.9% for AGIs $25k-50k, 1.5% for AGIs $50k-75k, 1.9% for AGIs $75k-100k, 2.7% for AGIs $100k-200k)
Earned income credit: $2,037 (reported on 20.4% of returns)
Here:
$2,037
State:
$2,306
(% of AGI for various income ranges: 6.0% for AGIs below $25k, 1.2% for AGIs $25k-50k)
Percentage of individuals using paid preparers for their 2012 taxes: 66.7%
Here:
67%
State:
57%
(% for various income ranges: 61.0% for AGIs below $25k, 70.8% for AGIs $25k-50k, 64.3% for AGIs $50k-75k, 75.0% for AGIs $75k-100k, 83.3% for AGIs $100k-200k)
Averages for the 2004 tax year for zip code 49271, filed in 2005:
Average Adjusted Gross Income (AGI) in 2004: $34,593 (Individual Income Tax Returns)
Here:
$34,593
State:
$48,204
Salary/wage: $34,009 (reported on 85.7% of returns)
Here:
$34,009
State:
$42,791
(% of AGI for various income ranges: 85.3% for AGIs below $10k, 71.2% for AGIs $10k-25k, 81.7% for AGIs $25k-50k, 91.1% for AGIs $50k-75k, 87.7% for AGIs $75k-100k, 76.2% for AGIs over 100k)
Taxable interest for individuals: $886 (reported on 40.5% of returns)
This zip code:
$886
Michigan:
$1,725
(% of AGI for various income ranges: 3.7% for AGIs below $10k, 2.5% for AGIs $10k-25k, 1.3% for AGIs $25k-50k, 0.4% for AGIs $50k-75k, 0.6% for AGIs $75k-100k, 0.4% for AGIs over 100k)
Taxable dividends: $646 (reported on 15.7% of returns)
Here:
$646
State:
$3,420
(% of AGI for various income ranges: 1.6% for AGIs below $10k, 0.4% for AGIs $10k-25k, 0.4% for AGIs $25k-50k, 0.1% for AGIs $50k-75k, 0.2% for AGIs $75k-100k, 0.4% for AGIs over 100k)
Net capital gain/loss: +$1,847 (reported on 10.9% of returns)
Here:
+$1,847
State:
+$8,532
(% of AGI for various income ranges: -2.3% for AGIs below $10k, 0.6% for AGIs $10k-25k, 0.5% for AGIs $25k-50k, 0.9% for AGIs $50k-75k, 0.8% for AGIs $75k-100k)
Profit/loss from business: +$4,601 (reported on 14.0% of returns)
Here:
+$4,601
State:
+$9,547
(% of AGI for various income ranges: 7.2% for AGIs below $10k, 9.2% for AGIs $10k-25k, 1.3% for AGIs $25k-50k, 0.4% for AGIs $50k-75k, 1.0% for AGIs $75k-100k)
IRA payment deduction: $2,786 (reported on 1.4% of returns)
49271:
$2,786
Michigan:
$2,875
Total itemized deductions: $13,799 (24% of AGI, reported on 19.9% of returns)
Here:
$13,799
State:
$18,509
Here:
23.6% of AGI
State:
20.7% of AGI
(% of AGI for various income ranges: 7.5% for AGIs $10k-25k, 6.8% for AGIs $25k-50k, 8.5% for AGIs $50k-75k, 10.0% for AGIs $75k-100k, 8.8% for AGIs over 100k)
Charity contributions deductions: $2,795 (4% of AGI, reported on 14.8% of returns)
Here:
$2,795
State:
$3,365
Here:
4.5% of AGI
State:
3.6% of AGI
(% of AGI for various income ranges: 1.3% for AGIs $10k-25k, 0.9% for AGIs $25k-50k, 1.2% for AGIs $50k-75k, 2.0% for AGIs $75k-100k, 1.1% for AGIs over 100k)
Total tax: $3,671 (reported on 73.1% of returns)
49271:
$3,671
State:
$7,691
(% of AGI for various income ranges: 2.6% for AGIs below $10k, 4.2% for AGIs $10k-25k, 6.3% for AGIs $25k-50k, 8.2% for AGIs $50k-75k, 9.3% for AGIs $75k-100k, 14.6% for AGIs over 100k)
Earned income credit: $1,810 (reported on 15.0% of returns)
Here:
$1,810
State:
$1,737
Percentage of individuals using paid preparers for their 2004 taxes: 68.9%
Here:
69%
State:
60%
(% for various income ranges: 58.6% for AGIs below $10k, 74.1% for AGIs $10k-25k, 70.4% for AGIs $25k-50k, 69.0% for AGIs $50k-75k, 72.4% for AGIs $75k-100k, 91.3% for AGIs over 100k)
Household received Food Stamps/SNAP in the past 12 months: 66 Household did not receive Food Stamps/SNAP in the past 12 months: 727
Women who had a birth in the past 12 months: 30 (25 now married, 5 unmarried) Women who did not have a birth in the past 12 months: 402 (120 now married, 283 unmarried)
Housing units in zip code 49271 with a mortgage: 302 (21 second mortgage, 20 both second mortgage and home equity loan) Houses without a mortgage: 6
Median monthly owner costs for units with a mortgage: $1,078 Median monthly owner costs for units without a mortgage: $434
Residents with income below the poverty level in 2022:
This zip code:
19.6%
Whole state:
13.4%
Residents with income below 50% of the poverty level in 2022:
This zip code:
8.2%
Whole state:
6.9%
Median number of rooms in houses and condos:
Here:
6.6
State:
6.5
Median number of rooms in apartments:
Here:
4.5
State:
4.3
Notable locations in this zip code not listed on our city pages
Notable locations in zip code 49271: Churchs Corners (A), Pittsford - Jefferson Fire and Rescue Station 10 (B), Pittsford Public Library (C). Display/hide their locations on the map
Churches in zip code 49271 include: South Pittsford Church (A), Betzer Community Church (B), Prattville Seventh Day Adventist Church (C), Prattville Community Church (D), Freedom Farm Bible Church (E), Wheatland Church (F), Pittsford Wesleyan Church (G), Liberty Bible Church (H), Pittsford First Congregational Church (I). Display/hide their locations on the map
Cemeteries: Lickly Corners Cemetery (1), Leonardson Cemetery (2), Black Cemetery (3), Mud Lake Cemetery (4), Bacon Farm Grave (5), Greenwood Cemetery (6). Display/hide their locations on the map
Lakes and reservoirs: Reece Lake (A), Lake Number Eight (B), Lake Number Two (C), Lake Number One (D), Lake Number Five (E), Moon Lake (F), Devoe Lake (G), Bell Lake (H). Display/hide their locations on the map
230 married couples with children.
65 single-parent households (33 men, 32 women).
99.5% of residents of 49271 zip code speak English at home.
0.3% of residents speak Spanish at home (67% very well, 33% well).
0.2% of residents speak other Indo-European language at home (100% well).
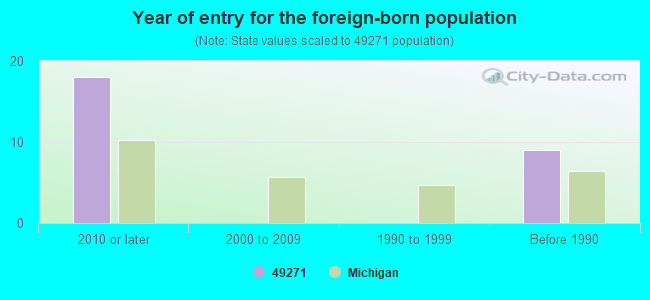
Foreign born population: 19 (1.0%) (100.0% of them are naturalized citizens)
This zip code:
1.0%
Whole state:
6.9%
89%India
5%France
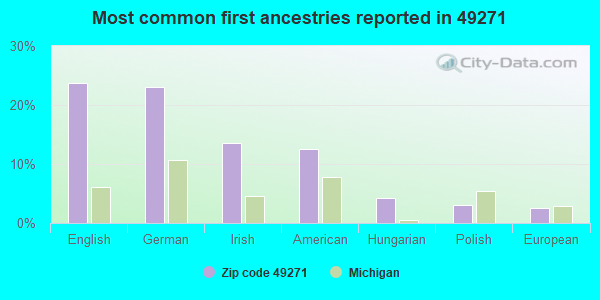
24%English
23%German
14%Irish
13%American
4%Hungarian
3%Polish
3%European
Year of entry for the foreign-born population
182010 or later
02000 to 2009
01990 to 1999
9Before 1990
Public high school in in zip code 49271 not listed on the city page:
Private elementary/middle school in in this zip code not listed on the city page:
PRATTVILLE SDA ELEMENTARY SCHOOL (Students: 3, Location: 5085 S WALDRON RD, Grades: 3-7)
Facilities with environmental interests located in this zip code:
MARTIN MFG CO (919 HUDSON RD in PITTSFORD, MI)
(Resource Conservation and Recovery Act (tracking hazardous waste))
Housing units lacking complete plumbing facilities: 2.8% Housing units lacking complete kitchen facilities: 5.6%
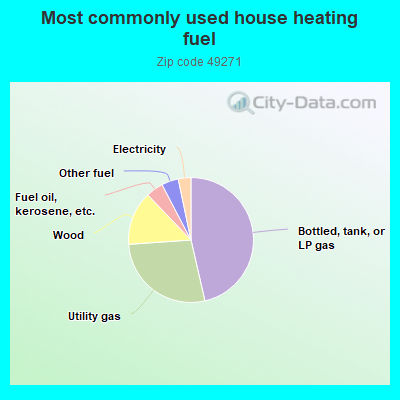
46.6%Bottled, tank, or LP gas
27.6%Utility gas
14.0%Wood
4.5%Fuel oil, kerosene, etc.
4.4%Other fuel
3.3%Electricity
Population in 1990: 2,552.
Place of birth for U.S.-born residents:
This state: 1,531
Northeast: 13
Midwest: 302
South: 19
West: 51
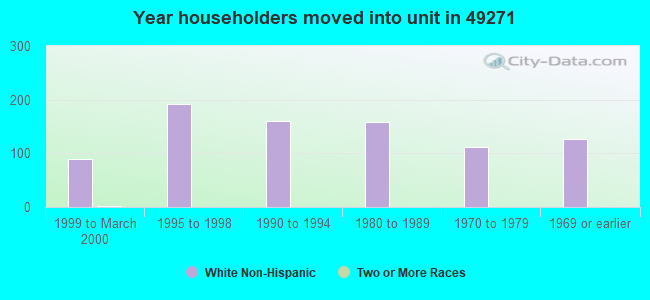
67% of the 49271 zip code residents lived in the same house 5 years ago. Out of people who lived in different houses, 53% lived in this county. Out of people who lived in different counties, 50% lived in Michigan.
83% of the 49271 zip code residents lived in the same house 1 year ago. Out of people who lived in different houses, 14% moved from this county. Out of people who lived in different houses, 34% moved from different county within same state. Out of people who lived in different houses, 28% moved from different state. Out of people who lived in different houses, 29% moved from abroad.
Private vs. public school enrollment:
Students in private schools in grades 1 to 8 (elementary and middle school): 40
Here:
26.9%
Michigan:
12.4%
Students in private schools in grades 9 to 12 (high school): 7
Here:
17.3%
Michigan:
9.8%
Students in private undergraduate colleges: 26
Here:
39.9%
Michigan:
14.9%
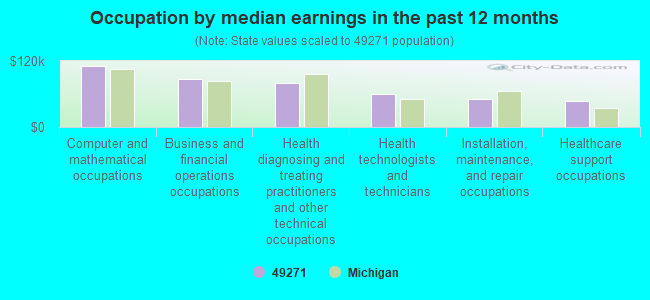
Occupation by median earnings in the past 12 months ($)
110,070Computer and mathematical occupations
87,351Business and financial operations occupations
79,136Health diagnosing and treating practitioners and other technical occupations
60,439Health technologists and technicians
51,606Installation, maintenance, and repair occupations
47,852Healthcare support occupations
Top industries in this zip code by the number of employees in 2005:
Other Services (except Public Administration): Religious Organizations (10-19: 1, 1-4: 1)
Construction: Commercial and Institutional Building Construction (1-4: 1)
Construction: Water and Sewer Line and Related Structures Construction (1-4: 1)
People in group quarters in 2010:
3 people in group homes intended for adults
People in group quarters in 2000:
4 people in other group homes
2 people in homes for the mentally retarded
Fatal accident statistics in 2014:
Fatal accident count: 2
Vehicles involved in fatal accidents: 3
Fatal accidents caused by drunken drivers: 1
Fatalities: 3
Persons involved in fatal accidents: 7
Pedestrians involved in fatal accidents: 0
Fatal accident statistics in 2013:
Fatal accident count: 1
Vehicles involved in fatal accidents: 2
Fatal accidents caused by drunken drivers: 0
Fatalities: 1
Persons involved in fatal accidents: 2
Pedestrians involved in fatal accidents: 0
2002 - 2018 National Fire Incident Reporting System (NFIRS) incidents
Based on the data from the years 2002 - 2018 the average number of fire incidents per year is 11. The highest number of fire incidents - 27 took place in 2007, and the least - 3 in 2008. The data has a dropping trend.
When looking into fire subcategories, the most incidents belonged to: Structure Fires (47.4%), and Outside Fires (36.6%).
Fire incident types reported to NFIRS in Zip Code 49271


 Nearest zip codes: 49266, 49288, 49247, 49262, 43501, 49242.
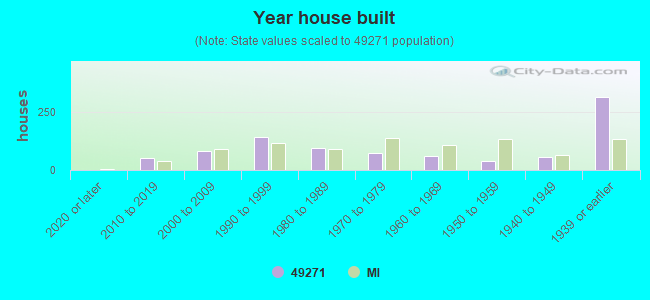


 (Students: 350, Location: 9304 HAMILTON RD, Grades: 7-12)


 Based on the data from the years 2002 - 2018 the average number of fire incidents per year is 11. The highest number of fire incidents - 27 took place in 2007, and the least - 3 in 2008. The data has a dropping trend.
 When looking into fire subcategories, the most incidents belonged to: Structure Fires (47.4%), and Outside Fires (36.6%).