Estimated zip code population in 2022: 886 Zip code population in 2010: 797 Zip code population in 2000: 930
Houses and condos: 442 Renter-occupied apartments: 54
% of renters here:
14%
State:
27%
March 2022 cost of living index in zip code 49279: 89.0 (less than average, U.S. average is 100)
Land area: 26.3 sq. mi. Water area: 0.0 sq. mi.
Population density: 34 people per square mile
(very low).
OSM Map
General Map
Google Map
MSN Map
OSM Map
General Map
Google Map
MSN Map
OSM Map
General Map
Google Map
MSN Map
OSM Map
General Map
Google Map
MSN Map
Please wait while loading the map...
Real estate property taxes paid for housing units in 2022:
This zip code:
1.0% ($1,417)
Michigan:
1.2% ($2,746)
Median real estate property taxes paid for housing units with mortgages in 2022: $1,838 (1.0%) Median real estate property taxes paid for housing units with no mortgage in 2022: $859 (0.7%)
Business Search- 14 Million verified businesses
Males: 474
(53.5%)
Females: 412
(46.5%)
For population 25 years and over in 49279:
High school or higher: 94.9%
Bachelor's degree or higher: 19.2%
Graduate or professional degree: 4.1%
Unemployed: 2.2%
Mean travel time to work (commute): 30.9 minutes
For population 15 years and over in 49279:
Never married: 28.4%
Now married: 57.5%
Separated: 2.4%
Widowed: 5.7%
Divorced: 6.0%
Zip code 49279 compared to state average:
Median house value below state average.
Unemployed percentage below state average.
Black race population percentage significantly below state average.
Median age significantly above state average.
Foreign-born population percentage significantly below state average.
Renting percentage below state average.
Length of stay since moving in above state average.
Number of rooms per house above state average.
House age above state average.
Number of college students significantly below state average.
Percentage of population with a bachelor's degree or higher below state average.
Estimated median house/condo value in 2022: $136,805
49279:
$136,805
Michigan:
$224,400
According to our research of Michigan and other state lists, there were 3 registered sex offenders living in 49279 zip code as of May 28, 2024. The ratio of all residents to sex offenders in zip code 49279 is 260 to 1. The ratio of registered sex offenders to all residents in this zip code is near the state average.
Median resident age:
This zip code:
49.7 years
Michigan median age:
40.3 years
Average household size:
This zip code:
2.2 people
Michigan:
2.4 people
Averages for the 2020 tax year for zip code 49279, filed in 2021:
Average Adjusted Gross Income (AGI) in 2020: $59,312 (Individual Income Tax Returns)
Here:
$59,312
State:
$68,945
Salary/wage: $49,327 (reported on 76.7% of returns)
Here:
$49,327
State:
$57,142
(% of AGI for various income ranges: 887.8% for AGIs below $25k, 2926.7% for AGIs $25k-50k, 5001.7% for AGIs $50k-75k, 7595.0% for AGIs $75k-100k, 17015.0% for AGIs $100k-200k)
Taxable interest for individuals: $567 (reported on 27.9% of returns)
This zip code:
$567
Michigan:
$1,630
(% of AGI for various income ranges: 21.1% for AGIs below $25k, 7.8% for AGIs $25k-50k, 28.3% for AGIs $50k-75k, 62.5% for AGIs $100k-200k)
Ordinary dividends: $1,750 (reported on 14.0% of returns)
Here:
$1,750
State:
$6,972
(% of AGI for various income ranges: 61.1% for AGIs $25k-50k, 125.0% for AGIs $75k-100k)
Net capital gain/loss in AGI: +$800 (reported on 11.6% of returns)
Here:
+$800
State:
+$20,064
(% of AGI for various income ranges: 47.8% for AGIs below $25k)
Profit/loss from business: +$5,071 (reported on 16.3% of returns)
Here:
+$5,071
State:
+$11,172
(% of AGI for various income ranges: 341.1% for AGIs below $25k, 80.0% for AGIs $50k-75k)
Taxable individual retirement arrangement distribution: $8,275 (reported on 9.3% of returns)
49279:
$8,275
Michigan:
$19,803
(% of AGI for various income ranges: 551.7% for AGIs $50k-75k)
Earned income credit: $2,750 (reported on 9.3% of returns)
Here:
$2,750
State:
$2,251
(% of AGI for various income ranges: 65.6% for AGIs below $25k, 56.7% for AGIs $25k-50k)
Percentage of individuals using paid preparers for their 2020 taxes: 97.7%
Here:
98%
State:
93%
(% for various income ranges: 100.0% for AGIs below $25k, 90.9% for AGIs $25k-50k, 100.0% for AGIs $50k-75k, 100.0% for AGIs $75k-100k, 100.0% for AGIs $100k-200k)
Averages for the 2012 tax year for zip code 49279, filed in 2013:
Average Adjusted Gross Income (AGI) in 2012: $45,460 (Individual Income Tax Returns)
Here:
$45,460
State:
$55,609
Salary/wage: $41,872 (reported on 76.2% of returns)
Here:
$41,872
State:
$46,782
(% of AGI for various income ranges: 66.9% for AGIs below $25k, 66.2% for AGIs $25k-50k, 75.8% for AGIs $50k-75k, 80.9% for AGIs $75k-100k, 61.4% for AGIs $100k-200k)
Taxable interest for individuals: $508 (reported on 31.0% of returns)
This zip code:
$508
Michigan:
$1,491
(% of AGI for various income ranges: 0.5% for AGIs below $25k, 0.6% for AGIs $25k-50k, 0.5% for AGIs $50k-75k, 0.1% for AGIs $75k-100k, 0.2% for AGIs $100k-200k)
Ordinary dividends: $1,629 (reported on 16.7% of returns)
Here:
$1,629
State:
$6,225
Net capital gain/loss in AGI: +$1,975 (reported on 9.5% of returns)
Here:
+$1,975
State:
+$9,326
Profit/loss from business: +$2,971 (reported on 16.7% of returns)
Here:
+$2,971
State:
+$11,523
Taxable individual retirement arrangement distribution: $7,100 (reported on 9.5% of returns)
49279:
$7,100
Michigan:
$15,298
Total itemized deductions: $17,036 (22% of AGI, reported on 26.2% of returns)
Here:
$17,036
State:
$21,628
Here:
21.7% of AGI
State:
18.4% of AGI
(% of AGI for various income ranges: 31.1% for AGIs below $25k, 9.2% for AGIs $50k-75k, 10.3% for AGIs $75k-100k, 8.4% for AGIs $100k-200k)
Charity contributions: $3,175 (reported on 19.0% of returns)
Here:
$3,175
State:
$4,225
(% of AGI for various income ranges: 3.5% for AGIs $25k-50k, 2.2% for AGIs $75k-100k, 1.1% for AGIs $100k-200k)
Taxes paid: $5,218 (reported on 26.2% of returns)
49279:
$5,218
State:
$8,327
(% of AGI for various income ranges: 5.3% for AGIs below $25k, 2.7% for AGIs $50k-75k, 3.7% for AGIs $75k-100k, 3.7% for AGIs $100k-200k)
Earned income credit: $2,240 (reported on 11.9% of returns)
Here:
$2,240
State:
$2,306
(% of AGI for various income ranges: 6.2% for AGIs below $25k)
Percentage of individuals using paid preparers for their 2012 taxes: 69.0%
Here:
69%
State:
57%
(% for various income ranges: 58.8% for AGIs below $25k, 75.0% for AGIs $25k-50k, 75.0% for AGIs $50k-75k, 80.0% for AGIs $75k-100k, 75.0% for AGIs $100k-200k)
Averages for the 2004 tax year for zip code 49279, filed in 2005:
Average Adjusted Gross Income (AGI) in 2004: $40,045 (Individual Income Tax Returns)
Here:
$40,045
State:
$48,204
Salary/wage: $38,819 (reported on 85.5% of returns)
Here:
$38,819
State:
$42,791
(% of AGI for various income ranges: 92.3% for AGIs below $10k, 66.6% for AGIs $10k-25k, 79.4% for AGIs $25k-50k, 83.3% for AGIs $50k-75k, 86.6% for AGIs $75k-100k, 87.9% for AGIs over 100k)
Taxable interest for individuals: $586 (reported on 51.1% of returns)
This zip code:
$586
Michigan:
$1,725
(% of AGI for various income ranges: 2.2% for AGIs below $10k, 1.3% for AGIs $10k-25k, 0.8% for AGIs $25k-50k, 0.6% for AGIs $50k-75k, 0.9% for AGIs $75k-100k, 0.4% for AGIs over 100k)
Taxable dividends: $832 (reported on 24.0% of returns)
Here:
$832
State:
$3,420
(% of AGI for various income ranges: 0.8% for AGIs below $10k, 1.5% for AGIs $10k-25k, 0.3% for AGIs $25k-50k, 0.3% for AGIs $50k-75k, 0.5% for AGIs $75k-100k, 0.4% for AGIs over 100k)
Net capital gain/loss: +$368 (reported on 13.5% of returns)
Here:
+$368
State:
+$8,532
(% of AGI for various income ranges: -5.8% for AGIs below $10k, 0.9% for AGIs $25k-50k, -0.0% for AGIs $50k-75k, 0.6% for AGIs $75k-100k)
Profit/loss from business: +$2,045 (reported on 15.7% of returns)
Here:
+$2,045
State:
+$9,547
(% of AGI for various income ranges: 0.8% for AGIs below $10k, 4.1% for AGIs $10k-25k, 1.7% for AGIs $25k-50k, 0.2% for AGIs $50k-75k)
Total itemized deductions: $14,579 (21% of AGI, reported on 29.9% of returns)
Here:
$14,579
State:
$18,509
Here:
20.8% of AGI
State:
20.7% of AGI
(% of AGI for various income ranges: 10.8% for AGIs $10k-25k, 8.4% for AGIs $25k-50k, 12.3% for AGIs $50k-75k, 13.8% for AGIs $75k-100k, 10.4% for AGIs over 100k)
Charity contributions deductions: $2,477 (3% of AGI, reported on 25.9% of returns)
Here:
$2,477
State:
$3,365
Here:
3.4% of AGI
State:
3.6% of AGI
(% of AGI for various income ranges: 1.8% for AGIs $25k-50k, 2.3% for AGIs $50k-75k, 1.7% for AGIs $75k-100k, 1.3% for AGIs over 100k)
Total tax: $4,530 (reported on 78.9% of returns)
49279:
$4,530
State:
$7,691
(% of AGI for various income ranges: 3.2% for AGIs below $10k, 5.4% for AGIs $10k-25k, 6.6% for AGIs $25k-50k, 7.2% for AGIs $50k-75k, 9.5% for AGIs $75k-100k, 15.5% for AGIs over 100k)
Earned income credit: $1,500 (reported on 9.0% of returns)
Here:
$1,500
State:
$1,737
Percentage of individuals using paid preparers for their 2004 taxes: 62.7%
Here:
63%
State:
60%
(% for various income ranges: 53.9% for AGIs below $10k, 54.3% for AGIs $10k-25k, 61.7% for AGIs $25k-50k, 70.0% for AGIs $50k-75k, 83.8% for AGIs $75k-100k, 74.1% for AGIs over 100k)
Household received Food Stamps/SNAP in the past 12 months: 53 Household did not receive Food Stamps/SNAP in the past 12 months: 349
Women who did not have a birth in the past 12 months: 173 (87 now married, 86 unmarried)
Housing units in zip code 49279 with a mortgage: 195 (32 second mortgage, 33 both second mortgage and home equity loan) Median monthly owner costs for units with a mortgage: $1,159 Median monthly owner costs for units without a mortgage: $366
Residents with income below the poverty level in 2022:
This zip code:
10.7%
Whole state:
13.4%
Residents with income below 50% of the poverty level in 2022:
This zip code:
8.2%
Whole state:
6.9%
Median number of rooms in houses and condos:
Here:
7.3
State:
6.5
Median number of rooms in apartments:
Here:
4.7
State:
4.3
Notable locations in this zip code not listed on our city pages
Churches in zip code 49279 include: Sand Creek Community Church (A), Weston Methodist Church (B), Weston Baptist Church (C). Display/hide their locations on the map
Streams, rivers, and creeks: Baker and May Drain (A), Hoadley Drain (B), Hough Drain (C), Stony Creek (D), Anderson Drain (E), Weston Drain (F), Scharer Drain (G), Complex Drain (H). Display/hide their locations on the map
Size of family households: 186 2-persons, 36 3-persons, 29 4-persons, 12 5-persons, 11 6-persons
Size of nonfamily households: 109 1-person, 9 2-persons, 9 4-persons
84 married couples with children.
47 single-parent households (20 men, 27 women).
95.4% of residents of 49279 zip code speak English at home.
3.6% of residents speak Spanish at home (68% very well, 32% not at all).
0.7% of residents speak other Indo-European language at home (100% very well).
Foreign born population: 11 (1.3%) (34.5% of them are naturalized citizens)
This zip code:
1.3%
Whole state:
6.9%
50%Barbados
25%France
32%German
23%American
8%English
8%Irish
2%Belgian
2%Swiss
1%European
Year of entry for the foreign-born population
92010 or later
02000 to 2009
01990 to 1999
6Before 1990
Housing units lacking complete plumbing facilities: 7.8% Housing units lacking complete kitchen facilities: 6.0%
40.9%Utility gas
40.3%Bottled, tank, or LP gas
12.7%Fuel oil, kerosene, etc.
4.3%Wood
1.5%Other fuel
0.5%Electricity
Population in 1990: 1,197.
Place of birth for U.S.-born residents:
This state: 632
Northeast: 13
Midwest: 189
South: 36
79% of the 49279 zip code residents lived in the same house 5 years ago. Out of people who lived in different houses, 60% lived in this county. Out of people who lived in different counties, 50% lived in Michigan.
94% of the 49279 zip code residents lived in the same house 1 year ago. Out of people who lived in different houses, 35% moved from this county. Out of people who lived in different houses, 75% moved from different state.
Private vs. public school enrollment:
Students in private schools in grades 1 to 8 (elementary and middle school): 28
Here:
40.6%
Michigan:
12.4%
Students in private schools in grades 9 to 12 (high school):
Here:
0.0%
Michigan:
9.8%
Occupation by median earnings in the past 12 months ($)
143,761Construction and extraction occupations
53,084Office and administrative support occupations
41,387Management occupations
38,560Production occupations
34,129Healthcare support occupations
33,868Building and grounds cleaning and maintenance occupations
Top industries in this zip code by the number of employees in 2005:
Wholesale Trade: Sporting and Recreational Goods and Supplies Merchant Wholesalers (1-4 employees: 1 establishment)
Construction: Residential Remodelers (1-4: 1)
Construction: Framing Contractors (1-4: 1)
Arts, Entertainment, and Recreation: All Other Amusement and Recreation Industries (1-4: 1)
Fatal accident statistics in 2012:
Fatal accident count: 1
Vehicles involved in fatal accidents: 2
Fatal accidents caused by drunken drivers: 0
Fatalities: 1
Persons involved in fatal accidents: 2
Pedestrians involved in fatal accidents: 0
Fatal accident statistics in 2011:
Fatal accident count: 1
Vehicles involved in fatal accidents: 2
Fatal accidents caused by drunken drivers: 1
Fatalities: 1
Persons involved in fatal accidents: 3
Pedestrians involved in fatal accidents: 0
Home Mortgage Disclosure Act Aggregated Statistics For Year 2003 (Based on 2 partial tracts)
A) FHA, FSA/RHS & VA Home Purchase Loans
B) Conventional Home Purchase Loans
C) Refinancings
D) Home Improvement Loans
F) Non-occupant Loans on < 5 Family Dwellings (A B C & D)
Number
Average Value
Number
Average Value
Number
Average Value
Number
Average Value
Number
Average Value
LOANS ORIGINATED
0
$0
21
$98,274
48
$98,274
3
$26,443
2
$79,520
APPLICATIONS APPROVED, NOT ACCEPTED
1
$56,070
2
$95,920
6
$110,607
2
$12,205
0
$0
APPLICATIONS DENIED
1
$63,310
5
$57,210
27
$79,699
5
$50,802
1
$80,480
APPLICATIONS WITHDRAWN
0
$0
1
$112,130
10
$91,345
0
$0
0
$0
FILES CLOSED FOR INCOMPLETENESS
0
$0
0
$0
3
$80,220
0
$0
0
$0
Aggregated Statistics For Year 2002 (Based on 2 partial tracts)
A) FHA, FSA/RHS & VA Home Purchase Loans
B) Conventional Home Purchase Loans
C) Refinancings
D) Home Improvement Loans
Number
Average Value
Number
Average Value
Number
Average Value
Number
Average Value
LOANS ORIGINATED
1
$106,410
7
$88,484
52
$100,139
3
$15,003
APPLICATIONS APPROVED, NOT ACCEPTED
0
$0
1
$107,170
8
$103,931
1
$13,350
APPLICATIONS DENIED
1
$80,860
2
$37,760
18
$90,243
2
$8,965
APPLICATIONS WITHDRAWN
0
$0
0
$0
9
$95,689
0
$0
FILES CLOSED FOR INCOMPLETENESS
0
$0
0
$0
5
$78,798
0
$0
Aggregated Statistics For Year 2001 (Based on 2 partial tracts)
A) FHA, FSA/RHS & VA Home Purchase Loans
B) Conventional Home Purchase Loans
C) Refinancings
D) Home Improvement Loans
F) Non-occupant Loans on < 5 Family Dwellings (A B C & D)
Number
Average Value
Number
Average Value
Number
Average Value
Number
Average Value
Number
Average Value
LOANS ORIGINATED
3
$69,287
10
$95,350
40
$88,742
10
$21,091
1
$37,380
APPLICATIONS APPROVED, NOT ACCEPTED
0
$0
1
$37,380
5
$87,950
1
$77,040
0
$0
APPLICATIONS DENIED
1
$52,630
5
$56,676
20
$86,654
5
$16,324
0
$0
APPLICATIONS WITHDRAWN
0
$0
1
$38,140
9
$81,450
1
$19,450
0
$0
FILES CLOSED FOR INCOMPLETENESS
0
$0
0
$0
2
$90,965
0
$0
0
$0
Aggregated Statistics For Year 2000 (Based on 2 partial tracts)
A) FHA, FSA/RHS & VA Home Purchase Loans
B) Conventional Home Purchase Loans
C) Refinancings
D) Home Improvement Loans
F) Non-occupant Loans on < 5 Family Dwellings (A B C & D)

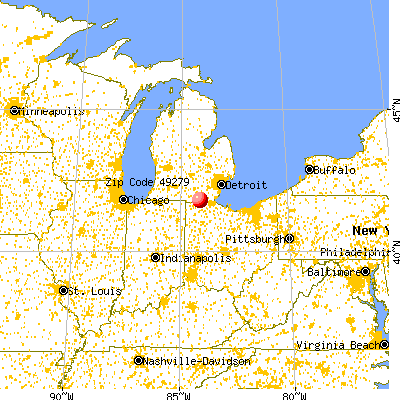


 Nearest zip codes: 49289, 43533, 49248, 49256, 49235, 49221.


