Estimated zip code population in 2022: 1,504 Zip code population in 2010: 1,649 Zip code population in 2000: 1,812
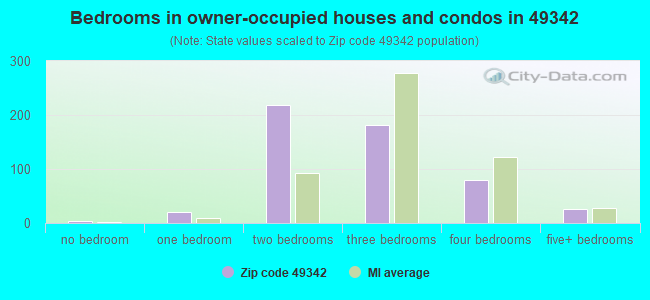
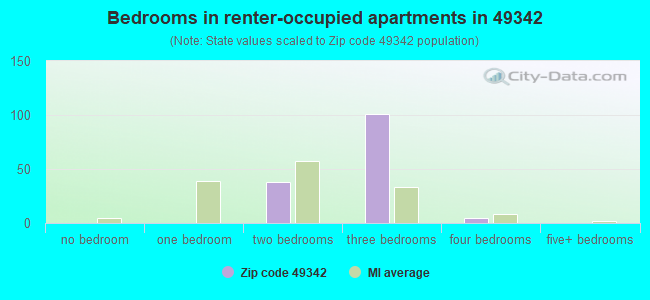
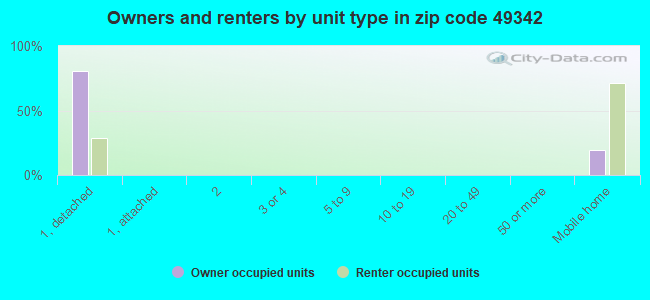
Houses and condos: 903 Renter-occupied apartments: 148
% of renters here:
22%
State:
27%
March 2022 cost of living index in zip code 49342: 81.2 (low, U.S. average is 100)
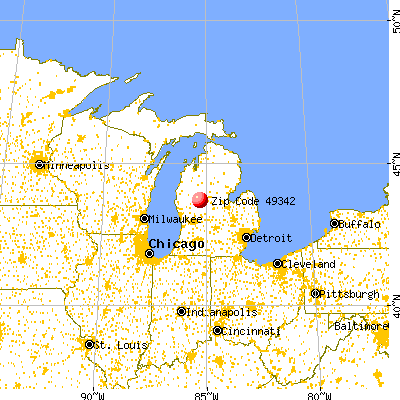
Land area: 44.9 sq. mi. Water area: 1.7 sq. mi.
Population density: 33 people per square mile
(very low).
OSM Map
General Map
Google Map
MSN Map
OSM Map
General Map
Google Map
MSN Map
OSM Map
General Map
Google Map
MSN Map
OSM Map
General Map
Google Map
MSN Map
Please wait while loading the map...
Real estate property taxes paid for housing units in 2022:
This zip code:
1.1% ($1,379)
Michigan:
1.2% ($2,746)
Median real estate property taxes paid for housing units with mortgages in 2022: $1,648 (1.2%) Median real estate property taxes paid for housing units with no mortgage in 2022: $1,040 (0.8%)
Business Search- 14 Million verified businesses
Males: 690
(45.9%)
Females: 813
(54.1%)
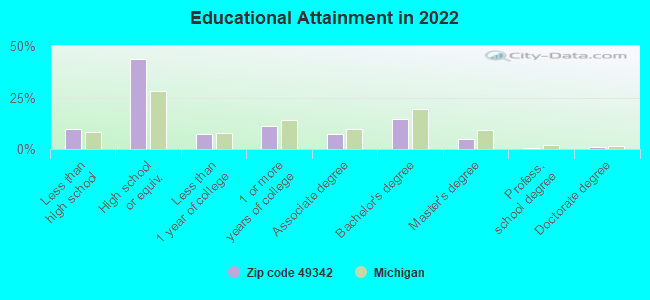
For population 25 years and over in 49342:
High school or higher: 89.1%
Bachelor's degree or higher: 20.9%
Graduate or professional degree: 6.4%
Unemployed: 1.7%
Mean travel time to work (commute): 27.4 minutes
For population 15 years and over in 49342:
Never married: 20.2%
Now married: 50.7%
Separated: 1.4%
Widowed: 11.1%
Divorced: 16.7%
Zip code 49342 compared to state average:
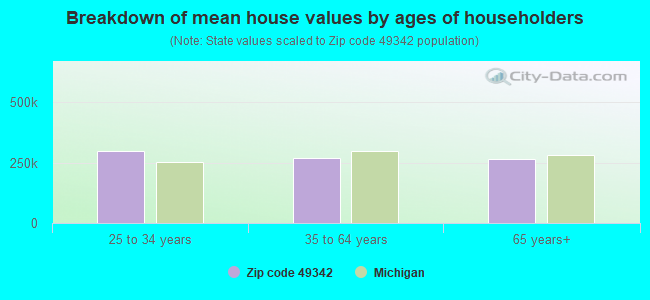
Median house value below state average.
Unemployed percentage below state average.
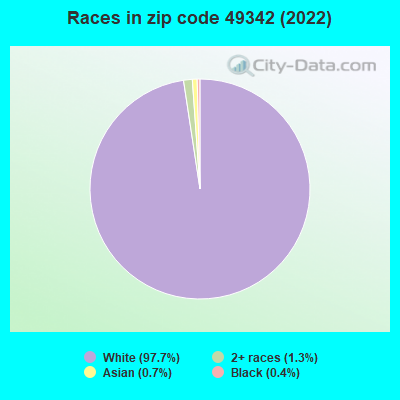
Black race population percentage significantly below state average.
Hispanic race population percentage significantly below state average.
Median age above state average.
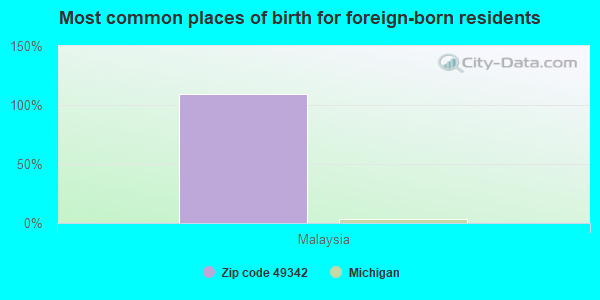
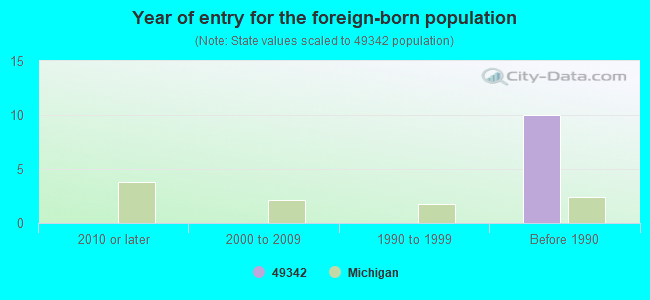
Foreign-born population percentage significantly below state average.
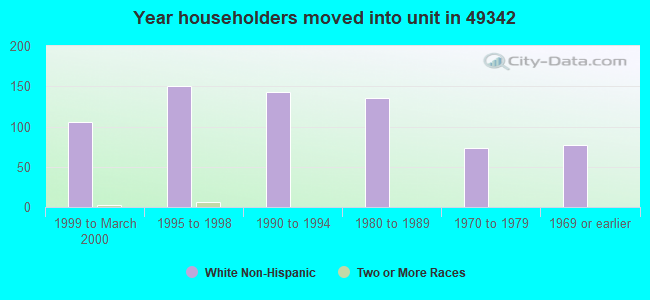
Length of stay since moving in significantly above state average.
Averages for the 2020 tax year for zip code 49342, filed in 2021:
Average Adjusted Gross Income (AGI) in 2020: $53,675 (Individual Income Tax Returns)
Here:
$53,675
State:
$68,945
Salary/wage: $43,593 (reported on 74.7% of returns)
Here:
$43,593
State:
$57,142
(% of AGI for various income ranges: 1003.3% for AGIs below $25k, 2953.5% for AGIs $25k-50k, 5626.7% for AGIs $50k-75k, 8960.0% for AGIs $75k-100k, 16388.3% for AGIs $100k-200k)
Taxable interest for individuals: $510 (reported on 26.7% of returns)
This zip code:
$510
Michigan:
$1,630
(% of AGI for various income ranges: 3.9% for AGIs below $25k, 7.1% for AGIs $25k-50k, 40.0% for AGIs $50k-75k, 78.3% for AGIs $100k-200k)
Ordinary dividends: $2,227 (reported on 14.7% of returns)
Here:
$2,227
State:
$6,972
(% of AGI for various income ranges: 16.1% for AGIs below $25k, 68.9% for AGIs $50k-75k, 256.7% for AGIs $100k-200k)
Net capital gain/loss in AGI: +$12,850 (reported on 13.3% of returns)
Here:
+$12,850
State:
+$20,064
(% of AGI for various income ranges: 293.3% for AGIs $50k-75k, 1706.7% for AGIs $100k-200k)
Profit/loss from business: +$14,780 (reported on 13.3% of returns)
Here:
+$14,780
State:
+$11,172
(% of AGI for various income ranges: 150.0% for AGIs below $25k, 264.1% for AGIs $25k-50k, 1265.0% for AGIs $100k-200k)
Taxable individual retirement arrangement distribution: $23,912 (reported on 10.7% of returns)
49342:
$23,912
Michigan:
$19,803
(% of AGI for various income ranges: 168.3% for AGIs below $25k, 527.8% for AGIs $50k-75k, 1891.7% for AGIs $100k-200k)
Total itemized deductions: $29,000 (reported on 2.7% of returns)
Here:
$29,000
State:
$34,117
(% of AGI for various income ranges: 341.2% for AGIs $25k-50k)
Taxes paid: $7,650 (reported on 2.7% of returns)
49342:
$7,650
State:
$7,972
(% of AGI for various income ranges: 90.0% for AGIs $25k-50k)
Earned income credit: $2,285 (reported on 17.3% of returns)
Here:
$2,285
State:
$2,251
(% of AGI for various income ranges: 85.0% for AGIs below $25k, 84.7% for AGIs $25k-50k)
Percentage of individuals using paid preparers for their 2020 taxes: 94.7%
Here:
95%
State:
93%
(% for various income ranges: 92.3% for AGIs below $25k, 100.0% for AGIs $25k-50k, 91.7% for AGIs $50k-75k, 100.0% for AGIs $75k-100k, 90.9% for AGIs $100k-200k)
Averages for the 2012 tax year for zip code 49342, filed in 2013:
Average Adjusted Gross Income (AGI) in 2012: $42,662 (Individual Income Tax Returns)
Here:
$42,662
State:
$55,609
Salary/wage: $38,404 (reported on 78.3% of returns)
Here:
$38,404
State:
$46,782
(% of AGI for various income ranges: 66.5% for AGIs below $25k, 71.2% for AGIs $25k-50k, 77.5% for AGIs $50k-75k, 73.2% for AGIs $75k-100k, 66.3% for AGIs $100k-200k)
Taxable interest for individuals: $671 (reported on 30.4% of returns)
This zip code:
$671
Michigan:
$1,491
(% of AGI for various income ranges: 1.1% for AGIs below $25k, 1.0% for AGIs $25k-50k, 0.1% for AGIs $75k-100k, 0.3% for AGIs $100k-200k)
Ordinary dividends: $1,410 (reported on 14.5% of returns)
Here:
$1,410
State:
$6,225
(% of AGI for various income ranges: 0.4% for AGIs below $25k, 0.6% for AGIs $25k-50k, 1.2% for AGIs $50k-75k, 0.3% for AGIs $100k-200k)
Net capital gain/loss in AGI: +$3,133 (reported on 13.0% of returns)
Here:
+$3,133
State:
+$9,326
(% of AGI for various income ranges: 0.3% for AGIs $25k-50k, 0.5% for AGIs $50k-75k, 4.8% for AGIs $75k-100k)
Profit/loss from business: +$10,433 (reported on 13.0% of returns)
Here:
+$10,433
State:
+$11,523
(% of AGI for various income ranges: 5.1% for AGIs below $25k, 2.0% for AGIs $25k-50k, 12.7% for AGIs $75k-100k)
Taxable individual retirement arrangement distribution: $10,412 (reported on 11.6% of returns)
49342:
$10,412
Michigan:
$15,298
Total itemized deductions: $17,692 (21% of AGI, reported on 18.8% of returns)
Here:
$17,692
State:
$21,628
Here:
20.5% of AGI
State:
18.4% of AGI
(% of AGI for various income ranges: 11.1% for AGIs $25k-50k, 8.9% for AGIs $75k-100k, 11.7% for AGIs $100k-200k)
Charity contributions: $2,662 (reported on 11.6% of returns)
Here:
$2,662
State:
$4,225
Taxes paid: $5,831 (reported on 18.8% of returns)
49342:
$5,831
State:
$8,327
(% of AGI for various income ranges: 2.6% for AGIs $25k-50k, 2.8% for AGIs $75k-100k, 4.7% for AGIs $100k-200k)
Earned income credit: $2,393 (reported on 21.7% of returns)
Here:
$2,393
State:
$2,306
(% of AGI for various income ranges: 8.1% for AGIs below $25k, 1.2% for AGIs $25k-50k)
Percentage of individuals using paid preparers for their 2012 taxes: 53.6%
Here:
54%
State:
57%
(% for various income ranges: 48.3% for AGIs below $25k, 47.4% for AGIs $25k-50k, 62.5% for AGIs $50k-75k, 66.7% for AGIs $75k-100k, 71.4% for AGIs $100k-200k)
Averages for the 2004 tax year for zip code 49342, filed in 2005:
Average Adjusted Gross Income (AGI) in 2004: $35,154 (Individual Income Tax Returns)
Here:
$35,154
State:
$48,204
Salary/wage: $31,616 (reported on 83.8% of returns)
Here:
$31,616
State:
$42,791
(% of AGI for various income ranges: 79.7% for AGIs below $10k, 69.4% for AGIs $10k-25k, 81.8% for AGIs $25k-50k, 77.3% for AGIs $50k-75k, 76.7% for AGIs $75k-100k, 61.0% for AGIs over 100k)
Taxable interest for individuals: $775 (reported on 36.9% of returns)
This zip code:
$775
Michigan:
$1,725
(% of AGI for various income ranges: 2.0% for AGIs below $10k, 1.7% for AGIs $10k-25k, 0.9% for AGIs $25k-50k, 0.3% for AGIs $50k-75k, 0.4% for AGIs $75k-100k, 0.9% for AGIs over 100k)
Taxable dividends: $946 (reported on 19.1% of returns)
Here:
$946
State:
$3,420
(% of AGI for various income ranges: 0.5% for AGIs below $10k, 1.0% for AGIs $10k-25k, 0.2% for AGIs $25k-50k, 0.9% for AGIs $50k-75k, 0.5% for AGIs $75k-100k)
Net capital gain/loss: +$2,963 (reported on 16.2% of returns)
Here:
+$2,963
State:
+$8,532
(% of AGI for various income ranges: 0.4% for AGIs $10k-25k, 0.8% for AGIs $25k-50k, 0.6% for AGIs $50k-75k, 5.4% for AGIs $75k-100k)
Profit/loss from business: +$4,621 (reported on 12.9% of returns)
Here:
+$4,621
State:
+$9,547
(% of AGI for various income ranges: 5.9% for AGIs below $10k, -0.1% for AGIs $10k-25k, 2.1% for AGIs $25k-50k, 2.9% for AGIs $50k-75k, 1.3% for AGIs $75k-100k)
Total itemized deductions: $14,687 (22% of AGI, reported on 21.8% of returns)
Here:
$14,687
State:
$18,509
Here:
22.5% of AGI
State:
20.7% of AGI
(% of AGI for various income ranges: 4.8% for AGIs $10k-25k, 9.0% for AGIs $25k-50k, 10.0% for AGIs $50k-75k, 9.4% for AGIs $75k-100k, 13.3% for AGIs over 100k)
Charity contributions deductions: $1,783 (3% of AGI, reported on 15.7% of returns)
Here:
$1,783
State:
$3,365
Here:
2.6% of AGI
State:
3.6% of AGI
(% of AGI for various income ranges: 0.6% for AGIs $25k-50k, 1.0% for AGIs $50k-75k, 1.3% for AGIs $75k-100k, 1.1% for AGIs over 100k)
Total tax: $4,155 (reported on 72.0% of returns)
49342:
$4,155
State:
$7,691
(% of AGI for various income ranges: 3.6% for AGIs below $10k, 3.7% for AGIs $10k-25k, 6.3% for AGIs $25k-50k, 8.7% for AGIs $50k-75k, 10.6% for AGIs $75k-100k, 15.9% for AGIs over 100k)
Earned income credit: $1,792 (reported on 19.3% of returns)
Here:
$1,792
State:
$1,737
Percentage of individuals using paid preparers for their 2004 taxes: 59.5%
Here:
59%
State:
60%
(% for various income ranges: 53.2% for AGIs below $10k, 57.5% for AGIs $10k-25k, 59.4% for AGIs $25k-50k, 63.3% for AGIs $50k-75k, 68.1% for AGIs $75k-100k, 85.0% for AGIs over 100k)
Likely homosexual households (counted as self-reported same-sex unmarried-partner households)
Lesbian couples: 0.4% of all households
Gay men: 0.0% of all households
Household received Food Stamps/SNAP in the past 12 months: 102 Household did not receive Food Stamps/SNAP in the past 12 months: 574
Women who had a birth in the past 12 months: 26 (27 now married, 0 unmarried) Women who did not have a birth in the past 12 months: 291 (138 now married, 152 unmarried)
Housing units in zip code 49342 with a mortgage: 255 (28 second mortgage, 29 both second mortgage and home equity loan) Median monthly owner costs for units with a mortgage: $1,161 Median monthly owner costs for units without a mortgage: $464
Residents with income below the poverty level in 2022:
This zip code:
14.2%
Whole state:
13.4%
Residents with income below 50% of the poverty level in 2022:
This zip code:
8.8%
Whole state:
6.9%
Median number of rooms in houses and condos:
Here:
5.7
State:
6.5
Median number of rooms in apartments:
Here:
5.4
State:
4.3
Notable locations in this zip code not listed on our city pages
Cemeteries: Chippewa Lake Cemetery (1), Rodney Cemetery (2), Kirschner Farm Cemetery (3), Chippewa Township Cemetery (4), Martiny Cemetery (5). Display/hide their locations on the map
Lakes: Manake Lake (A), Lower Evans Lake (B), Nijode Lakes (C), Jehnsen Lake (D), Hillsview Lake (E), Granger Lake (F), Gooseneck Pond (G), Cranberry Lake (H). Display/hide their locations on the map
In group quarters: 9 (-1 institutionalized population)
Size of family households: 205 2-persons, 91 3-persons, 65 4-persons, 27 5-persons, 6 6-persons, 3 7-or-more-persons
Size of nonfamily households: 203 1-person, 73 2-persons, 3 3-persons
227 married couples with children.
50 single-parent households (38 men, 12 women).
94.9% of residents of 49342 zip code speak English at home.
1.7% of residents speak Spanish at home (100% very well).
3.2% of residents speak other Indo-European language at home (51% very well, 24% well, 24% not well).
Foreign born population: 11 (0.7%) (100.0% of them are naturalized citizens)
This zip code:
0.7%
Whole state:
6.9%
109%Malaysia
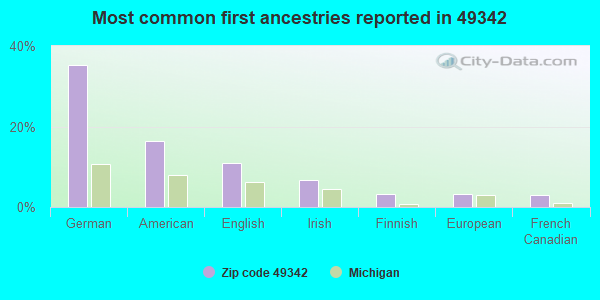
35%German
16%American
11%English
7%Irish
3%Finnish
3%European
3%French Canadian
Year of entry for the foreign-born population
02010 or later
02000 to 2009
01990 to 1999
10Before 1990
Housing units lacking complete kitchen facilities: 0.4%
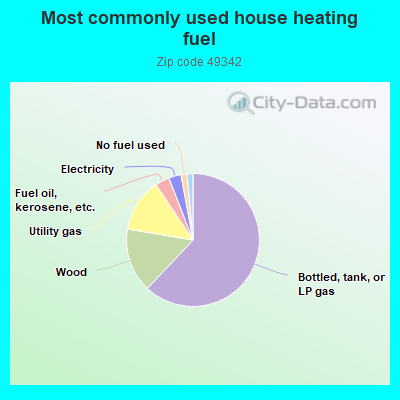
62.2%Bottled, tank, or LP gas
15.7%Wood
13.0%Utility gas
3.5%Fuel oil, kerosene, etc.
3.0%Electricity
1.5%No fuel used
1.4%Other fuel
Population in 1990: 1,202. Population change in the 1990s: +610 (+50.7%).
Place of birth for U.S.-born residents:
This state: 1,279
Northeast: 37
Midwest: 105
South: 44
West: 25
64% of the 49342 zip code residents lived in the same house 5 years ago. Out of people who lived in different houses, 51% lived in this county. Out of people who lived in different counties, 50% lived in Michigan.
88% of the 49342 zip code residents lived in the same house 1 year ago. Out of people who lived in different houses, 64% moved from this county. Out of people who lived in different houses, 27% moved from different county within same state. Out of people who lived in different houses, 5% moved from different state.
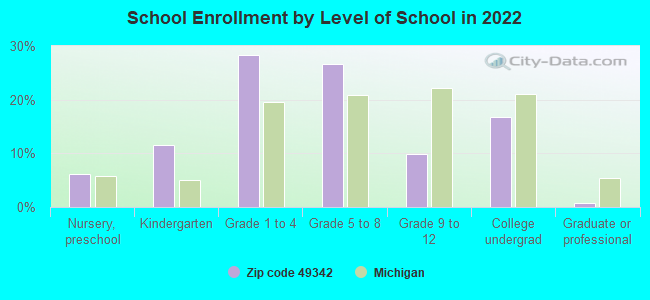
Private vs. public school enrollment:
Students in private schools in grades 1 to 8 (elementary and middle school): 59
Here:
43.4%
Michigan:
12.4%
Students in private schools in grades 9 to 12 (high school):
Here:
0.0%
Michigan:
9.8%
Students in private undergraduate colleges: 7
Here:
17.6%
Michigan:
14.9%
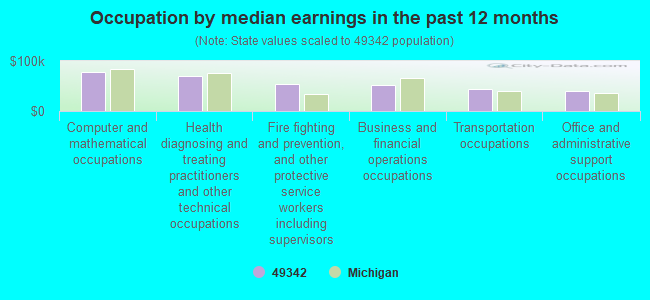
Occupation by median earnings in the past 12 months ($)
77,450Computer and mathematical occupations
69,338Health diagnosing and treating practitioners and other technical occupations
54,478Fire fighting and prevention, and other protective service workers including supervisors
51,781Business and financial operations occupations
43,161Transportation occupations
40,386Office and administrative support occupations
Top industries in this zip code by the number of employees in 2005:
Other Services (except Public Administration): Religious Organizations (5-9 employees: 1 establishment, 1-4 employees: 1 establishment)
Mining: Construction Sand and Gravel Mining (1-4: 1)
Accommodation and Food Services: Drinking Places (Alcoholic Beverages) (1-4: 1)
Construction: Power and Communication Line and Related Structures Construction (1-4: 1)
Wholesale Trade: Plumbing and Heating Equipment and Supplies (Hydronics) Merchant Wholesalers (1-4: 1)
Real Estate and Rental and Leasing: Offices of Real Estate Appraisers (1-4: 1)
People in group quarters in 2010:
11 people in group homes intended for adults
Fatal accident statistics in 2012:
Fatal accident count: 1
Vehicles involved in fatal accidents: 1
Fatal accidents caused by drunken drivers: 0
Fatalities: 1
Persons involved in fatal accidents: 3
Pedestrians involved in fatal accidents: 0
2002 - 2018 National Fire Incident Reporting System (NFIRS) incidents
According to the data from the years 2002 - 2018 the average number of fires per year is 7. The highest number of fire incidents - 19 took place in 2018, and the least - 1 in 2008. The data has a rising trend.
When looking into fire subcategories, the most incidents belonged to: Outside Fires (52.2%), and Structure Fires (40.0%).
Fire incident types reported to NFIRS in Zip Code 49342


 Nearest zip codes: 49320, 49332, 49346, 49307, 49305, 49639.


 According to the data from the years 2002 - 2018 the average number of fires per year is 7. The highest number of fire incidents - 19 took place in 2018, and the least - 1 in 2008. The data has a rising trend.
 When looking into fire subcategories, the most incidents belonged to: Outside Fires (52.2%), and Structure Fires (40.0%).