Estimated zip code population in 2022: 1,568 Zip code population in 2010: 1,538 Zip code population in 2000: 1,673
Houses and condos: 1,160 Renter-occupied apartments: 38
% of renters here:
5%
State:
27%
March 2022 cost of living index in zip code 49411: 83.1 (low, U.S. average is 100)
Land area: 86.5 sq. mi. Water area: 2.4 sq. mi.
Population density: 18 people per square mile
(very low).
OSM Map
General Map
Google Map
MSN Map
OSM Map
General Map
Google Map
MSN Map
OSM Map
General Map
Google Map
MSN Map
OSM Map
General Map
Google Map
MSN Map
Please wait while loading the map...
Real estate property taxes paid for housing units in 2022:
This zip code:
0.9% ($2,028)
Michigan:
1.2% ($2,746)
Median real estate property taxes paid for housing units with mortgages in 2022: $2,222 (1.0%) Median real estate property taxes paid for housing units with no mortgage in 2022: $1,863 (0.8%)
Estimated median house/condo value in 2022: $222,949
49411:
$222,949
Michigan:
$224,400
According to our research of Michigan and other state lists, there were 4 registered sex offenders living in 49411 zip code as of May 28, 2024. The ratio of all residents to sex offenders in zip code 49411 is 390 to 1. The ratio of registered sex offenders to all residents in this zip code is lower than the state average.
Median resident age:
This zip code:
55.5 years
Michigan median age:
40.3 years
Average household size:
This zip code:
2.0 people
Michigan:
2.4 people
Averages for the 2020 tax year for zip code 49411, filed in 2021:
Average Adjusted Gross Income (AGI) in 2020: $59,557 (Individual Income Tax Returns)
Here:
$59,557
State:
$68,945
Salary/wage: $50,168 (reported on 72.8% of returns)
Here:
$50,168
State:
$57,142
(% of AGI for various income ranges: 1045.3% for AGIs below $25k, 2901.3% for AGIs $25k-50k, 5445.6% for AGIs $50k-75k, 8415.0% for AGIs $75k-100k, 27040.0% for AGIs $100k-200k)
Taxable interest for individuals: $1,227 (reported on 40.7% of returns)
This zip code:
$1,227
Michigan:
$1,630
(% of AGI for various income ranges: 41.2% for AGIs below $25k, 74.0% for AGIs $25k-50k, 60.0% for AGIs $50k-75k, 96.7% for AGIs $75k-100k, 224.0% for AGIs $100k-200k)
Ordinary dividends: $2,853 (reported on 21.0% of returns)
Here:
$2,853
State:
$6,972
(% of AGI for various income ranges: 50.0% for AGIs below $25k, 38.7% for AGIs $25k-50k, 78.9% for AGIs $50k-75k, 93.3% for AGIs $75k-100k, 430.0% for AGIs $100k-200k)
Net capital gain/loss in AGI: +$9,073 (reported on 18.5% of returns)
Here:
+$9,073
State:
+$20,064
(% of AGI for various income ranges: 17.1% for AGIs below $25k, 30.7% for AGIs $25k-50k, 121.1% for AGIs $50k-75k, 311.7% for AGIs $75k-100k, 1980.0% for AGIs $100k-200k)
Profit/loss from business: +$9,833 (reported on 14.8% of returns)
Here:
+$9,833
State:
+$11,172
(% of AGI for various income ranges: 57.1% for AGIs below $25k, 199.3% for AGIs $25k-50k, 403.3% for AGIs $50k-75k, 701.7% for AGIs $75k-100k)
Taxable individual retirement arrangement distribution: $18,200 (reported on 14.8% of returns)
49411:
$18,200
Michigan:
$19,803
(% of AGI for various income ranges: 76.5% for AGIs below $25k, 141.3% for AGIs $25k-50k, 364.4% for AGIs $50k-75k, 598.3% for AGIs $75k-100k, 2310.0% for AGIs $100k-200k)
Total itemized deductions: $35,200 (reported on 2.5% of returns)
Here:
$35,200
State:
$34,117
(% of AGI for various income ranges: 469.3% for AGIs $25k-50k)
Earned income credit: $2,160 (reported on 12.3% of returns)
Here:
$2,160
State:
$2,251
(% of AGI for various income ranges: 66.5% for AGIs below $25k, 68.7% for AGIs $25k-50k)
Percentage of individuals using paid preparers for their 2020 taxes: 90.1%
Here:
90%
State:
93%
(% for various income ranges: 88.9% for AGIs below $25k, 90.0% for AGIs $25k-50k, 92.3% for AGIs $50k-75k, 90.0% for AGIs $75k-100k, 88.9% for AGIs $100k-200k, 100.0% for AGIs over 200k)
Averages for the 2012 tax year for zip code 49411, filed in 2013:
Average Adjusted Gross Income (AGI) in 2012: $41,822 (Individual Income Tax Returns)
Here:
$41,822
State:
$55,609
Salary/wage: $36,508 (reported on 73.6% of returns)
Here:
$36,508
State:
$46,782
(% of AGI for various income ranges: 63.4% for AGIs below $25k, 65.8% for AGIs $25k-50k, 75.0% for AGIs $50k-75k, 73.7% for AGIs $75k-100k, 47.1% for AGIs $100k-200k)
Taxable interest for individuals: $1,391 (reported on 45.8% of returns)
This zip code:
$1,391
Michigan:
$1,491
(% of AGI for various income ranges: 3.2% for AGIs below $25k, 1.6% for AGIs $25k-50k, 1.0% for AGIs $50k-75k, 0.7% for AGIs $75k-100k, 1.8% for AGIs $100k-200k)
Ordinary dividends: $1,920 (reported on 20.8% of returns)
Here:
$1,920
State:
$6,225
(% of AGI for various income ranges: 1.8% for AGIs below $25k, 1.7% for AGIs $25k-50k, 0.4% for AGIs $50k-75k, 0.7% for AGIs $75k-100k, 0.7% for AGIs $100k-200k)
Net capital gain/loss in AGI: +$4,491 (reported on 15.3% of returns)
Here:
+$4,491
State:
+$9,326
(% of AGI for various income ranges: 0.2% for AGIs below $25k, 1.5% for AGIs $25k-50k, 0.5% for AGIs $50k-75k, 4.6% for AGIs $100k-200k)
Profit/loss from business: +$7,450 (reported on 13.9% of returns)
Here:
+$7,450
State:
+$11,523
(% of AGI for various income ranges: 5.3% for AGIs below $25k, 3.3% for AGIs $25k-50k, 5.3% for AGIs $50k-75k)
Taxable individual retirement arrangement distribution: $12,562 (reported on 11.1% of returns)
49411:
$12,562
Michigan:
$15,298
(% of AGI for various income ranges: 4.0% for AGIs below $25k, 3.3% for AGIs $25k-50k, 9.8% for AGIs $50k-75k)
Total itemized deductions: $18,540 (24% of AGI, reported on 20.8% of returns)
Here:
$18,540
State:
$21,628
Here:
24.3% of AGI
State:
18.4% of AGI
(% of AGI for various income ranges: 8.0% for AGIs below $25k, 6.3% for AGIs $25k-50k, 8.6% for AGIs $50k-75k, 9.8% for AGIs $75k-100k, 12.0% for AGIs $100k-200k)
Charity contributions: $2,140 (reported on 13.9% of returns)
Here:
$2,140
State:
$4,225
(% of AGI for various income ranges: 1.3% for AGIs below $25k, 0.7% for AGIs $50k-75k, 1.2% for AGIs $75k-100k, 0.5% for AGIs $100k-200k)
Taxes paid: $6,187 (reported on 20.8% of returns)
49411:
$6,187
State:
$8,327
(% of AGI for various income ranges: 1.5% for AGIs below $25k, 1.7% for AGIs $25k-50k, 2.8% for AGIs $50k-75k, 3.8% for AGIs $75k-100k, 4.5% for AGIs $100k-200k)
Earned income credit: $2,100 (reported on 16.7% of returns)
Here:
$2,100
State:
$2,306
(% of AGI for various income ranges: 5.1% for AGIs below $25k, 1.2% for AGIs $25k-50k)
Percentage of individuals using paid preparers for their 2012 taxes: 59.7%
Here:
60%
State:
57%
(% for various income ranges: 53.1% for AGIs below $25k, 62.5% for AGIs $25k-50k, 63.6% for AGIs $50k-75k, 71.4% for AGIs $75k-100k, 66.7% for AGIs $100k-200k)
Averages for the 2004 tax year for zip code 49411, filed in 2005:
Average Adjusted Gross Income (AGI) in 2004: $32,997 (Individual Income Tax Returns)
Here:
$32,997
State:
$48,204
Salary/wage: $29,545 (reported on 82.2% of returns)
Here:
$29,545
State:
$42,791
(% of AGI for various income ranges: 105.6% for AGIs below $10k, 65.8% for AGIs $10k-25k, 79.2% for AGIs $25k-50k, 79.3% for AGIs $50k-75k, 76.2% for AGIs $75k-100k, 52.0% for AGIs over 100k)
Taxable interest for individuals: $1,640 (reported on 49.7% of returns)
This zip code:
$1,640
Michigan:
$1,725
(% of AGI for various income ranges: 10.1% for AGIs below $10k, 3.1% for AGIs $10k-25k, 1.3% for AGIs $25k-50k, 1.5% for AGIs $50k-75k, 2.7% for AGIs $75k-100k, 4.5% for AGIs over 100k)
Taxable dividends: $1,269 (reported on 21.5% of returns)
Here:
$1,269
State:
$3,420
(% of AGI for various income ranges: 3.0% for AGIs below $10k, 1.4% for AGIs $10k-25k, 0.9% for AGIs $25k-50k, 0.5% for AGIs $50k-75k, 0.3% for AGIs $75k-100k, 1.0% for AGIs over 100k)
Net capital gain/loss: +$6,385 (reported on 19.1% of returns)
Here:
+$6,385
State:
+$8,532
(% of AGI for various income ranges: 1.4% for AGIs below $10k, 1.8% for AGIs $10k-25k, 2.2% for AGIs $25k-50k, 1.1% for AGIs $50k-75k, 2.3% for AGIs $75k-100k, 15.0% for AGIs over 100k)
Profit/loss from business: +$1,706 (reported on 14.0% of returns)
Here:
+$1,706
State:
+$9,547
(% of AGI for various income ranges: -1.2% for AGIs below $10k, 3.8% for AGIs $10k-25k, -0.2% for AGIs $25k-50k, 1.1% for AGIs $50k-75k)
IRA payment deduction: $3,207 (reported on 3.7% of returns)
49411:
$3,207
Michigan:
$2,875
Total itemized deductions: $15,327 (25% of AGI, reported on 20.5% of returns)
Here:
$15,327
State:
$18,509
Here:
25.0% of AGI
State:
20.7% of AGI
(% of AGI for various income ranges: 6.5% for AGIs $10k-25k, 9.8% for AGIs $25k-50k, 9.3% for AGIs $50k-75k, 8.4% for AGIs $75k-100k, 14.7% for AGIs over 100k)
Charity contributions deductions: $1,992 (3% of AGI, reported on 16.0% of returns)
Here:
$1,992
State:
$3,365
Here:
3.1% of AGI
State:
3.6% of AGI
(% of AGI for various income ranges: 0.4% for AGIs $10k-25k, 1.1% for AGIs $25k-50k, 1.0% for AGIs $50k-75k, 0.7% for AGIs $75k-100k, 1.6% for AGIs over 100k)
Total tax: $3,964 (reported on 68.9% of returns)
49411:
$3,964
State:
$7,691
(% of AGI for various income ranges: 2.4% for AGIs below $10k, 3.5% for AGIs $10k-25k, 6.0% for AGIs $25k-50k, 8.5% for AGIs $50k-75k, 10.7% for AGIs $75k-100k, 15.0% for AGIs over 100k)
Earned income credit: $1,508 (reported on 16.2% of returns)
Here:
$1,508
State:
$1,737
Percentage of individuals using paid preparers for their 2004 taxes: 56.6%
Here:
57%
State:
60%
(% for various income ranges: 51.1% for AGIs below $10k, 60.5% for AGIs $10k-25k, 56.1% for AGIs $25k-50k, 56.9% for AGIs $50k-75k, 56.1% for AGIs $75k-100k, 66.7% for AGIs over 100k)
Likely homosexual households (counted as self-reported same-sex unmarried-partner households)
Lesbian couples: 0.3% of all households
Gay men: 0.0% of all households
Household received Food Stamps/SNAP in the past 12 months: 80 Household did not receive Food Stamps/SNAP in the past 12 months: 680
Women who had a birth in the past 12 months: 4 (0 now married, 3 unmarried) Women who did not have a birth in the past 12 months: 221 (135 now married, 85 unmarried)
Housing units in zip code 49411 with a mortgage: 310 (16 second mortgage, 13 both second mortgage and home equity loan) Houses without a mortgage: 5
Median monthly owner costs for units with a mortgage: $1,478 Median monthly owner costs for units without a mortgage: $571
Residents with income below the poverty level in 2022:
This zip code:
12.8%
Whole state:
13.4%
Residents with income below 50% of the poverty level in 2022:
This zip code:
8.6%
Whole state:
6.9%
Median number of rooms in houses and condos:
Here:
5.5
State:
6.5
Median number of rooms in apartments:
Here:
5.3
State:
4.3
Notable locations in this zip code not listed on our city pages
Notable locations in zip code 49411: Howell School (A), Kings Corners (B), Ludington State Park Beechwood Campground (C), Ludington State Park Cedars Campground (D), Ludington State Park Pines Campground (E), Freesoil Station (F), Freesoil - Meade Township Fire Department (G), Big Sable Lighthouse (H), Camp Sauble State Prison (I). Display/hide their locations on the map
Churches in zip code 49411 include: Freesoil United Methodist Church (A), Saint John Cantius Catholic Church (B), Saint Johns Church (C). Display/hide their locations on the map
Cemeteries: Grant Township Cemetery (1), Saint John Cantius' Cemetery (2), Maple Grove Cemetery (3), Hamlin Village Cemetery (4), Meade Cemetery (5). Display/hide their locations on the map
Lakes and swamps: Lost Lake (A), Lake George (B), Hoags Lake (C), Lake Meade (D), Mud Lake (E), Pickerel Lake (F), Gun Lake (G), Roderick Lake (H). Display/hide their locations on the map
In group quarters: 4 (-1 institutionalized population)
Size of family households: 313 2-persons, 55 3-persons, 69 4-persons, 17 5-persons, 8 6-persons, 5 7-or-more-persons
Size of nonfamily households: 258 1-person, 38 2-persons
152 married couples with children.
15 single-parent households (8 men, 7 women).
99.3% of residents of 49411 zip code speak English at home.
0.7% of residents speak Spanish at home (73% very well, 27% well).
0.5% of residents speak other Indo-European language at home (25% very well, 12% well, 62% not well).
Foreign born population: 12 (0.8%) (31.9% of them are naturalized citizens)
This zip code:
0.8%
Whole state:
6.9%
62%Ukraine
17%Polish
16%German
14%Italian
10%American
8%English
5%Irish
4%Albanian
Year of entry for the foreign-born population
52010 or later
12000 to 2009
11990 to 1999
4Before 1990
Facilities with environmental interests located in this zip code:
FREE SOIL COMMUNITY ELEM. SCHOOL (8480 N. DEMOCRAT STREET in FREE SOIL, MI)
(National Center for Education Statistics) - STATE ID-05909 Organizations: FREE SOIL COMMUNITY SCHOOLS (SCHOOL DISTRICT)
FREE SOIL COMMUNITY HIGH SCHOOL (8480 N. DEMOCRAT STREET in FREE SOIL, MI)
(National Center for Education Statistics) - STATE ID-01322 Organizations: FREE SOIL COMMUNITY SCHOOLS (SCHOOL DISTRICT)
AMPTECH INC. (62 W. FREEMAN RD. in FREE SOIL, MI)
Conditionally Exempt Small Quantity Generators, less than 100 kg/month of hazardous waste (Resource Conservation and Recovery Act (tracking hazardous waste)) TRI REPORTER (Tracking of toxic chemicals releasing facilities) Business SIC classification: ELECTRONIC COMPONENTS Business NAICS classification: BARE PRINTED CIRCUIT BOARD MANUFACTURING.
MI DEPT/CORRECTIONS (4058 FREESOIL RD in FREESOIL, MI)
Conditionally Exempt Small Quantity Generators, less than 100 kg/month of hazardous waste (Resource Conservation and Recovery Act (tracking hazardous waste)) Organizations: MICH DEPT OF CORRECTIONS (CONTACT/OPERATOR)
Alternative names: MIDCORR CAMP SAUBLE
Housing units lacking complete plumbing facilities: 6.6% Housing units lacking complete kitchen facilities: 6.6%
62.6%Bottled, tank, or LP gas
18.6%Wood
14.9%Electricity
2.7%Fuel oil, kerosene, etc.
0.8%Other fuel
Population in 1990: 903. Population change in the 1990s: +770 (+85.3%).
Place of birth for U.S.-born residents:
This state: 1,313
Northeast: 11
Midwest: 163
South: 24
West: 41
66% of the 49411 zip code residents lived in the same house 5 years ago. Out of people who lived in different houses, 25% lived in this county. Out of people who lived in different counties, 50% lived in Michigan.
90% of the 49411 zip code residents lived in the same house 1 year ago. Out of people who lived in different houses, 18% moved from this county. Out of people who lived in different houses, 66% moved from different county within same state. Out of people who lived in different houses, 16% moved from different state.
Private vs. public school enrollment:
Students in private schools in grades 1 to 8 (elementary and middle school): 15
Here:
12.4%
Michigan:
12.4%
Students in private schools in grades 9 to 12 (high school):
Here:
0.0%
Michigan:
9.8%
Students in private undergraduate colleges: 2
Here:
6.2%
Michigan:
14.9%
Occupation by median earnings in the past 12 months ($)
88,138Construction and extraction occupations
70,477Health technologists and technicians
68,585Health diagnosing and treating practitioners and other technical occupations
58,503Production occupations
56,445Fire fighting and prevention, and other protective service workers including supervisors
55,231Computer and mathematical occupations
Top industries in this zip code by the number of employees in 2005:
Construction: Water and Sewer Line and Related Structures Construction (10-19 employees: 1 establishment)
Other Services (except Public Administration): Labor Unions and Similar Labor Organizations (10-19: 1)
Accommodation and Food Services: Full-Service Restaurants (10-19: 1)
Construction: Site Preparation Contractors (5-9: 1, 1-4: 2)
Finance and Insurance: Real Estate Credit (5-9: 1)
Accommodation and Food Services: Drinking Places (Alcoholic Beverages) (5-9: 1)
Other Services (except Public Administration): Civic and Social Organizations (5-9: 1)
People in group quarters in 2010:
10 people in group homes intended for adults
People in group quarters in 2000:
129 people in other types of correctional institutions
Fatal accident statistics in 2011:
Fatal accident count: 1
Vehicles involved in fatal accidents: 1
Fatal accidents caused by drunken drivers: 0
Fatalities: 1
Persons involved in fatal accidents: 1
Pedestrians involved in fatal accidents: 1
2002 - 2018 National Fire Incident Reporting System (NFIRS) incidents
Based on the data from the years 2002 - 2018 the average number of fire incidents per year is 16. The highest number of reported fires - 27 took place in 2003, and the least - 9 in 2010. The data has a dropping trend.
When looking into fire subcategories, the most incidents belonged to: Structure Fires (51.9%), and Outside Fires (35.3%).
Fire incident types reported to NFIRS in Zip Code 49411

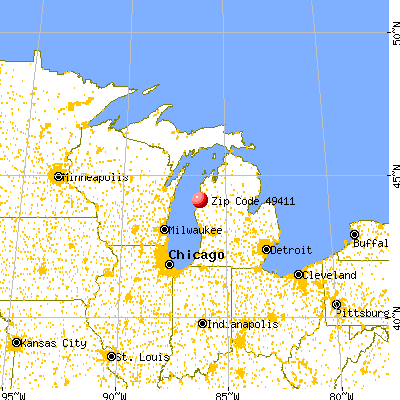


 Nearest zip codes: 49634, 49660, 49410, 49626, 49454, 49431.


 Based on the data from the years 2002 - 2018 the average number of fire incidents per year is 16. The highest number of reported fires - 27 took place in 2003, and the least - 9 in 2010. The data has a dropping trend.
 When looking into fire subcategories, the most incidents belonged to: Structure Fires (51.9%), and Outside Fires (35.3%).