Estimated zip code population in 2022: 8,213 Zip code population in 2010: 8,034 Zip code population in 2000: 7,817
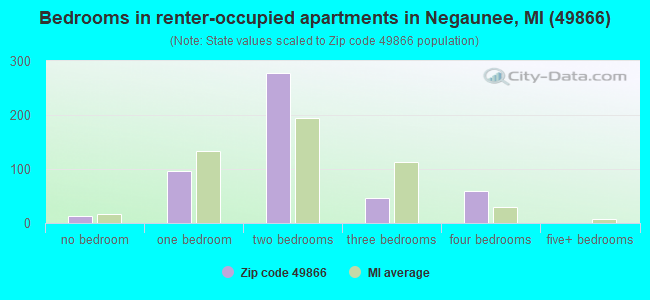
Houses and condos: 3,779 Renter-occupied apartments: 488
% of renters here:
14%
State:
27%
March 2022 cost of living index in zip code 49866: 80.6 (low, U.S. average is 100)
Land area: 145.5 sq. mi. Water area: 4.8 sq. mi.
Population density: 56 people per square mile
(very low).
OSM Map
General Map
Google Map
MSN Map
OSM Map
General Map
Google Map
MSN Map
OSM Map
General Map
Google Map
MSN Map
OSM Map
General Map
Google Map
MSN Map
Please wait while loading the map...
Real estate property taxes paid for housing units in 2022:
This zip code:
1.1% ($2,171)
Michigan:
1.2% ($2,746)
Median real estate property taxes paid for housing units with mortgages in 2022: $2,340 (1.2%) Median real estate property taxes paid for housing units with no mortgage in 2022: $1,919 (1.0%)
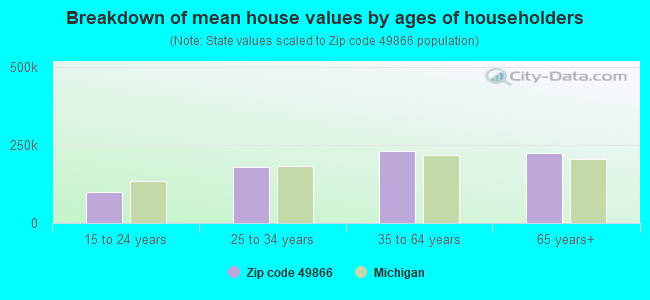
Estimated median house/condo value in 2022: $196,727
49866:
$196,727
Michigan:
$224,400
According to our research of Michigan and other state lists, there were 25 registered sex offenders living in 49866 zip code as of May 14, 2024. The ratio of all residents to sex offenders in zip code 49866 is 326 to 1. The ratio of registered sex offenders to all residents in this zip code is near the state average.
Median resident age:
This zip code:
39.6 years
Michigan median age:
40.3 years
Average household size:
This zip code:
2.4 people
Michigan:
2.4 people
Averages for the 2020 tax year for zip code 49866, filed in 2021:
Average Adjusted Gross Income (AGI) in 2020: $62,174 (Individual Income Tax Returns)
Here:
$62,174
State:
$68,945
Salary/wage: $55,129 (reported on 77.7% of returns)
Here:
$55,129
State:
$57,142
(% of AGI for various income ranges: 1034.2% for AGIs below $25k, 2958.6% for AGIs $25k-50k, 5196.5% for AGIs $50k-75k, 8204.3% for AGIs $75k-100k, 14429.8% for AGIs $100k-200k, 47002.5% for AGIs over 200k)
Taxable interest for individuals: $734 (reported on 35.2% of returns)
This zip code:
$734
Michigan:
$1,630
(% of AGI for various income ranges: 12.1% for AGIs below $25k, 10.0% for AGIs $25k-50k, 30.8% for AGIs $50k-75k, 30.0% for AGIs $75k-100k, 75.3% for AGIs $100k-200k, 647.5% for AGIs over 200k)
Ordinary dividends: $3,131 (reported on 19.9% of returns)
Here:
$3,131
State:
$6,972
(% of AGI for various income ranges: 21.3% for AGIs below $25k, 30.3% for AGIs $25k-50k, 54.6% for AGIs $50k-75k, 107.0% for AGIs $75k-100k, 220.9% for AGIs $100k-200k, 1065.0% for AGIs over 200k)
Net capital gain/loss in AGI: +$8,731 (reported on 18.4% of returns)
Here:
+$8,731
State:
+$20,064
(% of AGI for various income ranges: 22.3% for AGIs below $25k, 17.7% for AGIs $25k-50k, 56.0% for AGIs $50k-75k, 205.1% for AGIs $75k-100k, 371.3% for AGIs $100k-200k, 8565.0% for AGIs over 200k)
Profit/loss from business: +$9,939 (reported on 10.9% of returns)
Here:
+$9,939
State:
+$11,172
(% of AGI for various income ranges: 38.5% for AGIs below $25k, 52.4% for AGIs $25k-50k, 188.3% for AGIs $50k-75k, 108.1% for AGIs $75k-100k, 468.9% for AGIs $100k-200k, 425.0% for AGIs over 200k)
Taxable individual retirement arrangement distribution: $15,813 (reported on 11.7% of returns)
49866:
$15,813
Michigan:
$19,803
(% of AGI for various income ranges: 53.8% for AGIs below $25k, 129.5% for AGIs $25k-50k, 223.5% for AGIs $50k-75k, 280.5% for AGIs $75k-100k, 842.0% for AGIs $100k-200k)
Total itemized deductions: $34,164 (reported on 3.5% of returns)
Here:
$34,164
State:
$34,117
(% of AGI for various income ranges: 132.0% for AGIs $25k-50k, 203.7% for AGIs $50k-75k, 245.3% for AGIs $100k-200k, 3942.5% for AGIs over 200k)
Charity contributions: $7,320 (reported on 2.5% of returns)
Here:
$7,320
State:
$13,548
(% of AGI for various income ranges: 19.0% for AGIs $50k-75k, 76.9% for AGIs $100k-200k, 717.5% for AGIs over 200k)
Taxes paid: $6,586 (reported on 3.5% of returns)
49866:
$6,586
State:
$7,972
(% of AGI for various income ranges: 12.9% for AGIs $25k-50k, 44.6% for AGIs $50k-75k, 69.6% for AGIs $100k-200k, 687.5% for AGIs over 200k)
Earned income credit: $1,989 (reported on 8.7% of returns)
Here:
$1,989
State:
$2,251
(% of AGI for various income ranges: 44.4% for AGIs below $25k, 44.3% for AGIs $25k-50k)
Percentage of individuals using paid preparers for their 2020 taxes: 94.8%
Here:
95%
State:
93%
(% for various income ranges: 94.7% for AGIs below $25k, 93.9% for AGIs $25k-50k, 94.0% for AGIs $50k-75k, 95.7% for AGIs $75k-100k, 95.5% for AGIs $100k-200k, 100.0% for AGIs over 200k)
Averages for the 2012 tax year for zip code 49866, filed in 2013:
Average Adjusted Gross Income (AGI) in 2012: $51,381 (Individual Income Tax Returns)
Here:
$51,381
State:
$55,609
Salary/wage: $47,356 (reported on 81.2% of returns)
Here:
$47,356
State:
$46,782
(% of AGI for various income ranges: 67.1% for AGIs below $25k, 67.5% for AGIs $25k-50k, 71.3% for AGIs $50k-75k, 80.1% for AGIs $75k-100k, 83.5% for AGIs $100k-200k, 56.9% for AGIs over 200k)
Taxable interest for individuals: $758 (reported on 40.1% of returns)
This zip code:
$758
Michigan:
$1,491
(% of AGI for various income ranges: 1.2% for AGIs below $25k, 0.6% for AGIs $25k-50k, 0.8% for AGIs $50k-75k, 0.4% for AGIs $75k-100k, 0.4% for AGIs $100k-200k, 0.6% for AGIs over 200k)
Ordinary dividends: $2,291 (reported on 21.2% of returns)
Here:
$2,291
State:
$6,225
(% of AGI for various income ranges: 1.2% for AGIs below $25k, 0.8% for AGIs $25k-50k, 0.6% for AGIs $50k-75k, 1.0% for AGIs $75k-100k, 0.9% for AGIs $100k-200k, 1.6% for AGIs over 200k)
Net capital gain/loss in AGI: +$2,118 (reported on 14.4% of returns)
Here:
+$2,118
State:
+$9,326
(% of AGI for various income ranges: 0.4% for AGIs $50k-75k, 0.3% for AGIs $75k-100k, 1.7% for AGIs $100k-200k)
Profit/loss from business: +$8,551 (reported on 10.7% of returns)
Here:
+$8,551
State:
+$11,523
(% of AGI for various income ranges: 2.6% for AGIs below $25k, 1.5% for AGIs $25k-50k, 1.9% for AGIs $50k-75k, 1.3% for AGIs $75k-100k, 2.4% for AGIs $100k-200k)
Taxable individual retirement arrangement distribution: $11,436 (reported on 11.8% of returns)
49866:
$11,436
Michigan:
$15,298
(% of AGI for various income ranges: 3.0% for AGIs below $25k, 2.7% for AGIs $25k-50k, 3.1% for AGIs $50k-75k, 2.5% for AGIs $75k-100k, 2.9% for AGIs $100k-200k)
Total itemized deductions: $17,888 (19% of AGI, reported on 23.0% of returns)
Here:
$17,888
State:
$21,628
Here:
18.8% of AGI
State:
18.4% of AGI
(% of AGI for various income ranges: 5.0% for AGIs below $25k, 6.9% for AGIs $25k-50k, 7.0% for AGIs $50k-75k, 7.6% for AGIs $75k-100k, 9.6% for AGIs $100k-200k, 11.5% for AGIs over 200k)
Charity contributions: $3,062 (reported on 16.5% of returns)
Here:
$3,062
State:
$4,225
(% of AGI for various income ranges: 0.4% for AGIs below $25k, 0.7% for AGIs $25k-50k, 1.0% for AGIs $50k-75k, 0.9% for AGIs $75k-100k, 1.4% for AGIs $100k-200k, 1.1% for AGIs over 200k)
Taxes paid: $6,766 (reported on 23.0% of returns)
49866:
$6,766
State:
$8,327
(% of AGI for various income ranges: 0.8% for AGIs below $25k, 1.8% for AGIs $25k-50k, 2.2% for AGIs $50k-75k, 3.1% for AGIs $75k-100k, 4.1% for AGIs $100k-200k, 6.1% for AGIs over 200k)
Earned income credit: $1,926 (reported on 13.1% of returns)
Here:
$1,926
State:
$2,306
(% of AGI for various income ranges: 3.8% for AGIs below $25k, 1.0% for AGIs $25k-50k)
Percentage of individuals using paid preparers for their 2012 taxes: 52.4%
Here:
52%
State:
57%
(% for various income ranges: 44.4% for AGIs below $25k, 54.7% for AGIs $25k-50k, 55.6% for AGIs $50k-75k, 60.4% for AGIs $75k-100k, 58.7% for AGIs $100k-200k, 75.0% for AGIs over 200k)
Averages for the 2004 tax year for zip code 49866, filed in 2005:
Average Adjusted Gross Income (AGI) in 2004: $39,981 (Individual Income Tax Returns)
Here:
$39,981
State:
$48,204
Salary/wage: $35,880 (reported on 82.6% of returns)
Here:
$35,880
State:
$42,791
(% of AGI for various income ranges: 87.2% for AGIs below $10k, 65.3% for AGIs $10k-25k, 73.6% for AGIs $25k-50k, 80.9% for AGIs $50k-75k, 83.9% for AGIs $75k-100k, 57.7% for AGIs over 100k)
Taxable interest for individuals: $959 (reported on 53.2% of returns)
This zip code:
$959
Michigan:
$1,725
(% of AGI for various income ranges: 3.6% for AGIs below $10k, 2.6% for AGIs $10k-25k, 1.2% for AGIs $25k-50k, 1.0% for AGIs $50k-75k, 0.8% for AGIs $75k-100k, 1.1% for AGIs over 100k)
Taxable dividends: $1,454 (reported on 26.3% of returns)
Here:
$1,454
State:
$3,420
(% of AGI for various income ranges: 2.8% for AGIs below $10k, 1.3% for AGIs $10k-25k, 0.7% for AGIs $25k-50k, 0.9% for AGIs $50k-75k, 0.5% for AGIs $75k-100k, 1.4% for AGIs over 100k)
Net capital gain/loss: +$3,390 (reported on 19.1% of returns)
Here:
+$3,390
State:
+$8,532
(% of AGI for various income ranges: -1.8% for AGIs below $10k, 0.6% for AGIs $10k-25k, 0.9% for AGIs $25k-50k, 1.0% for AGIs $50k-75k, 0.9% for AGIs $75k-100k, 5.3% for AGIs over 100k)
Profit/loss from business: +$7,077 (reported on 10.9% of returns)
Here:
+$7,077
State:
+$9,547
(% of AGI for various income ranges: 2.2% for AGIs below $10k, 1.7% for AGIs $10k-25k, 1.9% for AGIs $25k-50k, 0.9% for AGIs $50k-75k, 1.6% for AGIs $75k-100k, 4.0% for AGIs over 100k)
IRA payment deduction: $2,505 (reported on 3.1% of returns)
49866:
$2,505
Michigan:
$2,875
(% of AGI for various income ranges: 0.2% for AGIs $10k-25k, 0.3% for AGIs $25k-50k, 0.2% for AGIs $50k-75k, 0.3% for AGIs $75k-100k)
Total itemized deductions: $14,576 (19% of AGI, reported on 20.7% of returns)
Here:
$14,576
State:
$18,509
Here:
18.9% of AGI
State:
20.7% of AGI
(% of AGI for various income ranges: 4.3% for AGIs below $10k, 5.2% for AGIs $10k-25k, 6.8% for AGIs $25k-50k, 7.2% for AGIs $50k-75k, 9.8% for AGIs $75k-100k, 8.6% for AGIs over 100k)
Charity contributions deductions: $2,575 (3% of AGI, reported on 18.1% of returns)
Here:
$2,575
State:
$3,365
Here:
3.4% of AGI
State:
3.6% of AGI
(% of AGI for various income ranges: 0.5% for AGIs $10k-25k, 0.8% for AGIs $25k-50k, 1.0% for AGIs $50k-75k, 1.7% for AGIs $75k-100k, 1.9% for AGIs over 100k)
Total tax: $4,795 (reported on 76.6% of returns)
49866:
$4,795
State:
$7,691
(% of AGI for various income ranges: 1.7% for AGIs below $10k, 4.0% for AGIs $10k-25k, 6.5% for AGIs $25k-50k, 8.1% for AGIs $50k-75k, 10.4% for AGIs $75k-100k, 17.2% for AGIs over 100k)
Earned income credit: $1,541 (reported on 10.9% of returns)
Here:
$1,541
State:
$1,737
Percentage of individuals using paid preparers for their 2004 taxes: 53.6%
Here:
54%
State:
60%
(% for various income ranges: 39.6% for AGIs below $10k, 53.8% for AGIs $10k-25k, 58.9% for AGIs $25k-50k, 54.7% for AGIs $50k-75k, 58.5% for AGIs $75k-100k, 74.6% for AGIs over 100k)
Likely homosexual households (counted as self-reported same-sex unmarried-partner households)
Lesbian couples: 0.1% of all households
Gay men: 0.3% of all households
Household received Food Stamps/SNAP in the past 12 months: 247 Household did not receive Food Stamps/SNAP in the past 12 months: 3,145
Women who had a birth in the past 12 months: 54 (55 now married, 0 unmarried) Women who did not have a birth in the past 12 months: 1,510 (903 now married, 600 unmarried)
Housing units in zip code 49866 with a mortgage: 1,829 (169 second mortgage, 160 both second mortgage and home equity loan) Houses without a mortgage: 96
Median monthly owner costs for units with a mortgage: $1,223 Median monthly owner costs for units without a mortgage: $508
Residents with income below the poverty level in 2022:
This zip code:
9.9%
Whole state:
13.4%
Residents with income below 50% of the poverty level in 2022:
This zip code:
5.4%
Whole state:
6.9%
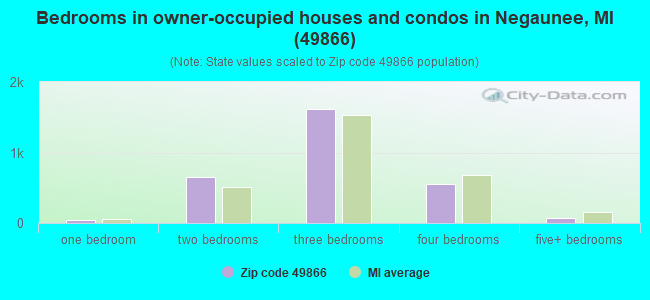
Median number of rooms in houses and condos:
Here:
6.3
State:
6.5
Median number of rooms in apartments:
Here:
4.2
State:
4.3
Notable locations in this zip code not listed on our city pages
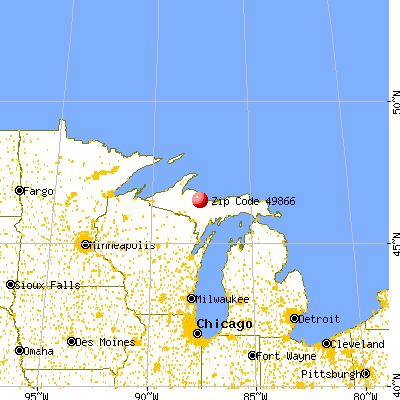
Notable locations in zip code 49866: Palmer Station (A), Eagle Mills Station (B), Lucy Hill Naturbahn Luge Track (C), Suicide Bowl Ski Jumps (D), Negaunee Station (E), Negaunee Volunteer Fire Department (F), Negaunee City Police Department (G), Negaunee City Library (H), Negaunee Historical Society Museum (I), Michigan Iron Industry Museum (J), United States National Ski Hall of Fame (K), Roland Palmede National Ski Library (L), Negaunee Township Fire Department (M). Display/hide their locations on the map
Churches in zip code 49866 include: Finnish Church (A), Immanuel Lutheran Church (B), Church of Our Saviour (C), Seventh Day Adventist Church (D), Episcopal Church of Saint Johns (E), Saint Paul Parish (F), Mitchell United Methodist Church (G), Calvary Church of Negaunee (H), Bethany Lutheran Church (I). Display/hide their locations on the map
Lakes, reservoirs, and swamps: Reany Lake (A), Dollar Lake (B), Long Lake (C), Picket Lake (D), Palmer Lake (E), Nash Lake (F), Mud Lake (G), Horseshoe Lake (H). Display/hide their locations on the map
Streams, rivers, and creeks: Willow Creek (A), Goose Lake Outlet (B), Beaver Farm Creek (C), Holyoke Creek (D), Midway Creek (E), Nash Creek (F), Nealy Creek (G). Display/hide their locations on the map
Parks in zip code 49866 include: Cherry Street Field (1), Teal Lake Beach (2), Eastwood Playlot (3), Miners Park (4), Breitung Park (5), Jackson Park (6), Buffalo Hills Playground (7), Peter Waara Park (8), Marquette Iron Range Historical Marker (9). Display/hide their locations on the map
In group quarters: 103 (-1 institutionalized population)
Size of family households: 937 2-persons, 652 3-persons, 461 4-persons, 135 5-persons, 38 6-persons, 14 7-or-more-persons
Size of nonfamily households: 1,007 1-person, 148 2-persons
1,392 married couples with children.
434 single-parent households (109 men, 325 women).
98.5% of residents of 49866 zip code speak English at home.
0.3% of residents speak other Indo-European language at home (75% very well, 25% not well).
0.7% of residents speak other language at home (74% very well, 26% not well).
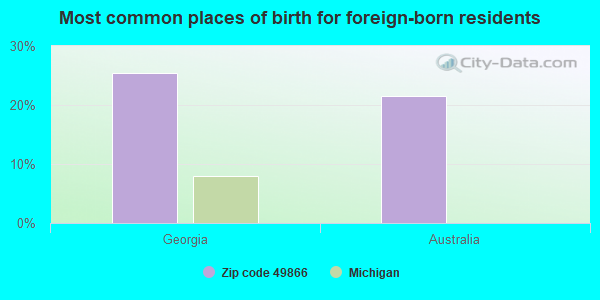
Foreign born population: 51 (0.6%) (56.2% of them are naturalized citizens)
This zip code:
0.6%
Whole state:
6.9%
25%Georgia
22%Australia
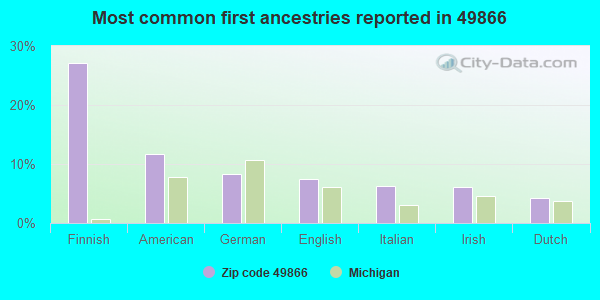
27%Finnish
12%American
8%German
7%English
6%Italian
6%Irish
4%Dutch
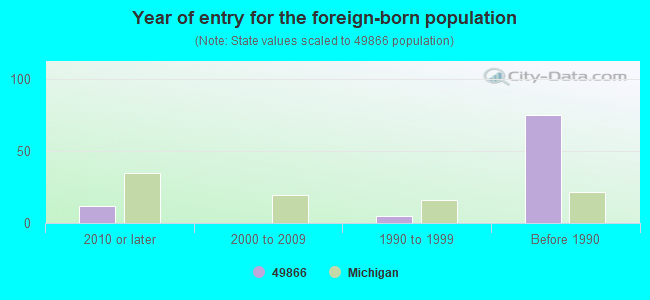
Year of entry for the foreign-born population
122010 or later
02000 to 2009
51990 to 1999
75Before 1990
Facilities with environmental interests located in this zip code:
AMERICAN EAGLE REGNL AIRCRAFT MAINT CTR (161 W MARCHETTI DR in NEGAUNEE, MI)
(Resource Conservation and Recovery Act (tracking hazardous waste)) Organizations: AMR EAGLE (CONTACT/OPERATOR)
, MARQUETTE COUNTY AIRPORT (PROP OWNER) (CONTACT/OWNER)
MI DEPT/STATE POLICE (180 US-41 E in NEGAUNEE, MI)
(Resource Conservation and Recovery Act (tracking hazardous waste)) Organizations: MICH STATE POLICE DEPARTMENT (CONTACT/OPERATOR)
Alternative names: MICHIGAN STATE POLICE
MI DEPT/TRANSPORTATION BRIDGE B01-52042 (US-41 OVER CARP RIV in NEGAUNEE TOWNSHIP, MI)
(Resource Conservation and Recovery Act (tracking hazardous waste)) Organizations: MICH DEPT OF TRANSPORTATION (CONTACT/OPERATOR)
Alternative names: MIDOT BRIDGE US-41 OVER CARP RIVER
GREAT LAKES AVIATION LTD (198 A AIRPORT DR MQT CO ARPT in NEGAUNEE, MI)
(Resource Conservation and Recovery Act (tracking hazardous waste)) Business NAICS classification: OTHER AIRPORT OPERATIONS.
ENVIROTECH LEASING CO (MIDWAY INDUSTRIAL PK in NEGAUNEE, MI)
AIR MINOR (AIRS/AFS)
AUTOMOTIVE ELECTRIC (202 CO RD 480 in NEGAUNEE, MI)
Small Quantity Generators, between 100 kg and 1000 kg of hazardous waste/month (Resource Conservation and Recovery Act (tracking hazardous waste)) - notification Organizations: KIRKLAND JACK (CONTACT/OPERATOR)
EL COM SVC INC (108 COUNTY RD 480 in NEGAUNEE, MI)
Conditionally Exempt Small Quantity Generators, less than 100 kg/month of hazardous waste (Resource Conservation and Recovery Act (tracking hazardous waste)) - notification
Housing units lacking complete plumbing facilities: 3.1% Housing units lacking complete kitchen facilities: 2.5%
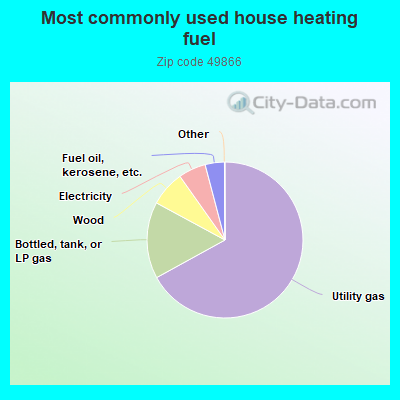
67.0%Utility gas
15.9%Bottled, tank, or LP gas
7.3%Wood
5.7%Electricity
4.0%Fuel oil, kerosene, etc.
Population in 1990: 8,204.
Place of birth for U.S.-born residents:
This state: 6,892
Northeast: 105
Midwest: 700
South: 140
West: 282
64% of the 49866 zip code residents lived in the same house 5 years ago. Out of people who lived in different houses, 73% lived in this county. Out of people who lived in different counties, 50% lived in Michigan.
91% of the 49866 zip code residents lived in the same house 1 year ago. Out of people who lived in different houses, 60% moved from this county. Out of people who lived in different houses, 27% moved from different county within same state. Out of people who lived in different houses, 12% moved from different state.
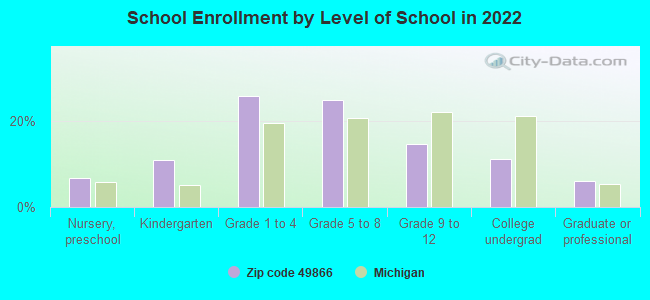
Private vs. public school enrollment:
Students in private schools in grades 1 to 8 (elementary and middle school): 51
Here:
5.5%
Michigan:
12.4%
Students in private schools in grades 9 to 12 (high school):
Here:
0.0%
Michigan:
9.8%
Students in private undergraduate colleges: 54
Here:
26.2%
Michigan:
14.9%
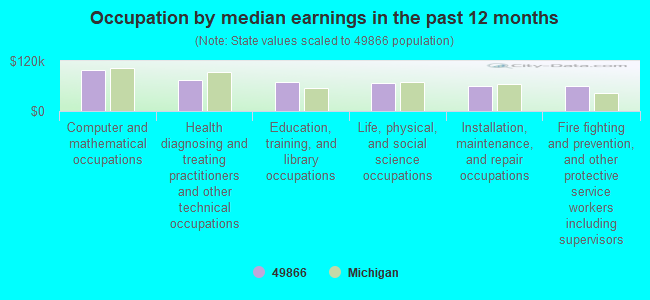
Occupation by median earnings in the past 12 months ($)
99,458Computer and mathematical occupations
73,588Health diagnosing and treating practitioners and other technical occupations
70,382Education, training, and library occupations
67,362Life, physical, and social science occupations
59,855Installation, maintenance, and repair occupations
59,254Fire fighting and prevention, and other protective service workers including supervisors
Top industries in this zip code by the number of employees in 2005:
Health Care and Social Assistance: Nursing Care Facilities (100-249 employees: 1 establishment)
Information: Television Broadcasting (50-99: 1)
Finance and Insurance: Credit Unions (50-99: 1)
Information: Cable and Other Program Distribution (50-99: 1)
Finance and Insurance: Commercial Banking (20-49: 1, 5-9: 2)
Administrative and Support and Waste Management and Remediation Services: Janitorial Services (10-19: 2, 5-9: 1)
People in group quarters in 2010:
98 people in nursing facilities/skilled-nursing facilities
People in group quarters in 2000:
97 people in nursing homes
Fatal accident statistics in 2012:
Fatal accident count: 2
Vehicles involved in fatal accidents: 3
Fatal accidents caused by drunken drivers: 1
Fatalities: 2
Persons involved in fatal accidents: 3
Pedestrians involved in fatal accidents: 0
2002 - 2018 National Fire Incident Reporting System (NFIRS) incidents
Based on the data from the years 2002 - 2018 the average number of fire incidents per year is 20. The highest number of reported fire incidents - 38 took place in 2011, and the least - 10 in 2018. The data has a declining trend.
When looking into fire subcategories, the most incidents belonged to: Structure Fires (44.2%), and Outside Fires (28.1%).
Fire incident types reported to NFIRS in Zip Code 49866


 Nearest zip codes: 49871, 49855, 49849, 49841, 49814, 49833.


 Based on the data from the years 2002 - 2018 the average number of fire incidents per year is 20. The highest number of reported fire incidents - 38 took place in 2011, and the least - 10 in 2018. The data has a declining trend.
 When looking into fire subcategories, the most incidents belonged to: Structure Fires (44.2%), and Outside Fires (28.1%).