Estimated zip code population in 2022: 2,343 Zip code population in 2010: 2,005 Zip code population in 2000: 1,613
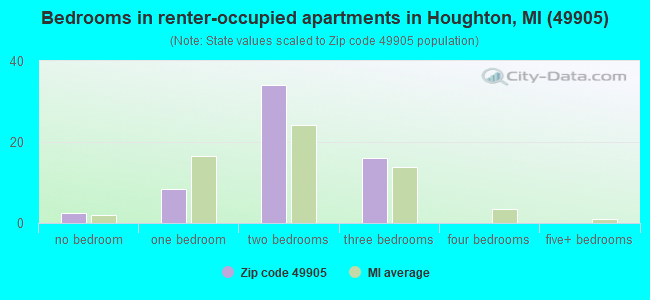
Houses and condos: 888 Renter-occupied apartments: 61
% of renters here:
8%
State:
27%
March 2022 cost of living index in zip code 49905: 81.0 (low, U.S. average is 100)
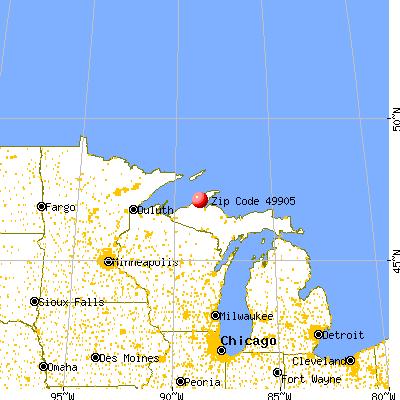
Land area: 59.3 sq. mi. Water area: 12.0 sq. mi.
Population density: 39 people per square mile
(very low).
OSM Map
General Map
Google Map
MSN Map
OSM Map
General Map
Google Map
MSN Map
OSM Map
General Map
Google Map
MSN Map
OSM Map
General Map
Google Map
MSN Map
Please wait while loading the map...
Real estate property taxes paid for housing units in 2022:
This zip code:
1.0% ($2,030)
Michigan:
1.2% ($2,746)
Median real estate property taxes paid for housing units with mortgages in 2022: $2,345 (0.8%) Median real estate property taxes paid for housing units with no mortgage in 2022: $1,142 (0.8%)
Business Search- 14 Million verified businesses
Males: 1,182
(50.5%)
Females: 1,160
(49.5%)
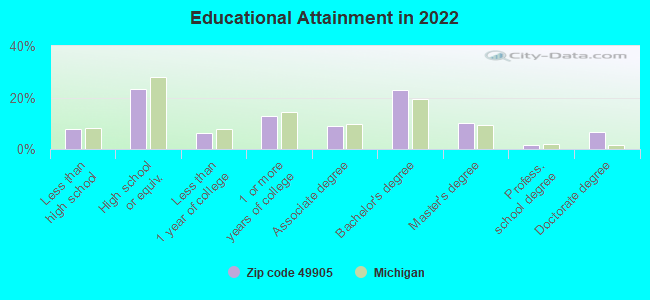
For population 25 years and over in 49905:
High school or higher: 92.6%
Bachelor's degree or higher: 41.4%
Graduate or professional degree: 18.3%
Unemployed: 3.0%
Mean travel time to work (commute): 21.8 minutes
For population 15 years and over in 49905:
Never married: 27.7%
Now married: 56.6%
Separated: 0.0%
Widowed: 4.2%
Divorced: 11.5%
Zip code 49905 compared to state average:
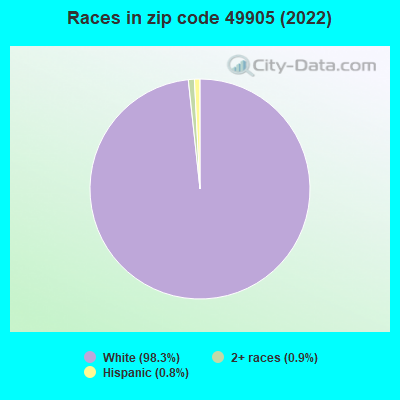
Black race population percentage significantly below state average.
Hispanic race population percentage significantly below state average.
Median age below state average.
Foreign-born population percentage significantly below state average.
Renting percentage significantly below state average.
Length of stay since moving in significantly above state average.
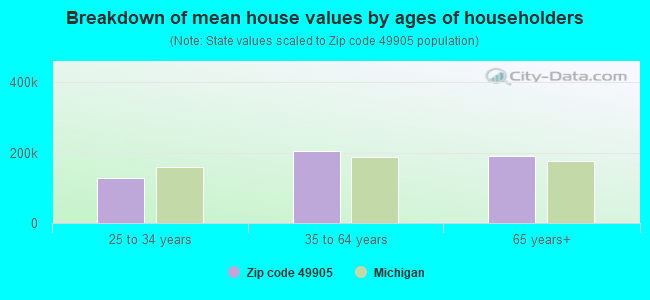
Estimated median house/condo value in 2022: $199,963
49905:
$199,963
Michigan:
$224,400
According to our research of Michigan and other state lists, there were 4 registered sex offenders living in 49905 zip code as of May 13, 2024. The ratio of all residents to sex offenders in zip code 49905 is 504 to 1. The ratio of registered sex offenders to all residents in this zip code is lower than the state average.
Median resident age:
This zip code:
33.6 years
Michigan median age:
40.3 years
Average household size:
This zip code:
3.1 people
Michigan:
2.4 people
Averages for the 2020 tax year for zip code 49905, filed in 2021:
Average Adjusted Gross Income (AGI) in 2020: $56,822 (Individual Income Tax Returns)
Here:
$56,822
State:
$68,945
Salary/wage: $49,810 (reported on 83.0% of returns)
Here:
$49,810
State:
$57,142
(% of AGI for various income ranges: 1199.0% for AGIs below $25k, 3348.3% for AGIs $25k-50k, 6866.7% for AGIs $50k-75k, 8627.5% for AGIs $75k-100k, 18956.2% for AGIs $100k-200k)
Taxable interest for individuals: $911 (reported on 28.7% of returns)
This zip code:
$911
Michigan:
$1,630
(% of AGI for various income ranges: 9.0% for AGIs below $25k, 15.6% for AGIs $25k-50k, 10.0% for AGIs $50k-75k, 25.0% for AGIs $75k-100k, 208.8% for AGIs $100k-200k)
Ordinary dividends: $2,621 (reported on 14.9% of returns)
Here:
$2,621
State:
$6,972
(% of AGI for various income ranges: 11.4% for AGIs below $25k, 35.8% for AGIs $50k-75k, 90.0% for AGIs $75k-100k, 285.0% for AGIs $100k-200k)
Net capital gain/loss in AGI: +$12,500 (reported on 13.8% of returns)
Here:
+$12,500
State:
+$20,064
(% of AGI for various income ranges: 14.8% for AGIs below $25k, 2.2% for AGIs $25k-50k, 170.0% for AGIs $75k-100k, 1817.5% for AGIs $100k-200k)
Profit/loss from business: +$15,333 (reported on 16.0% of returns)
Here:
+$15,333
State:
+$11,172
(% of AGI for various income ranges: 51.4% for AGIs below $25k, 308.3% for AGIs $25k-50k, 536.7% for AGIs $50k-75k, 1241.2% for AGIs $100k-200k)
Taxable individual retirement arrangement distribution: $11,200 (reported on 8.5% of returns)
49905:
$11,200
Michigan:
$19,803
(% of AGI for various income ranges: 64.3% for AGIs below $25k, 137.2% for AGIs $25k-50k, 642.5% for AGIs $75k-100k)
Earned income credit: $2,144 (reported on 9.6% of returns)
Here:
$2,144
State:
$2,251
(% of AGI for various income ranges: 31.9% for AGIs below $25k, 70.0% for AGIs $25k-50k)
Percentage of individuals using paid preparers for their 2020 taxes: 92.6%
Here:
93%
State:
93%
(% for various income ranges: 90.3% for AGIs below $25k, 91.7% for AGIs $25k-50k, 93.8% for AGIs $50k-75k, 100.0% for AGIs $75k-100k, 92.3% for AGIs $100k-200k)
Averages for the 2012 tax year for zip code 49905, filed in 2013:
Average Adjusted Gross Income (AGI) in 2012: $40,573 (Individual Income Tax Returns)
Here:
$40,573
State:
$55,609
Salary/wage: $36,508 (reported on 85.9% of returns)
Here:
$36,508
State:
$46,782
(% of AGI for various income ranges: 73.4% for AGIs below $25k, 77.8% for AGIs $25k-50k, 83.7% for AGIs $50k-75k, 75.5% for AGIs $75k-100k, 72.6% for AGIs $100k-200k)
Taxable interest for individuals: $760 (reported on 41.2% of returns)
This zip code:
$760
Michigan:
$1,491
(% of AGI for various income ranges: 1.0% for AGIs below $25k, 0.8% for AGIs $25k-50k, 0.3% for AGIs $50k-75k, 1.4% for AGIs $75k-100k, 0.5% for AGIs $100k-200k)
Ordinary dividends: $2,573 (reported on 12.9% of returns)
Here:
$2,573
State:
$6,225
(% of AGI for various income ranges: 1.0% for AGIs below $25k, 1.1% for AGIs $25k-50k, 0.5% for AGIs $50k-75k, 1.5% for AGIs $75k-100k)
Net capital gain/loss in AGI: +$4,325 (reported on 14.1% of returns)
Here:
+$4,325
State:
+$9,326
(% of AGI for various income ranges: 1.2% for AGIs below $25k, 0.7% for AGIs $25k-50k, 1.1% for AGIs $50k-75k, 4.6% for AGIs $75k-100k)
Profit/loss from business: +$6,700 (reported on 12.9% of returns)
Here:
+$6,700
State:
+$11,523
(% of AGI for various income ranges: 6.2% for AGIs below $25k, 4.2% for AGIs $25k-50k, 1.9% for AGIs $75k-100k)
Taxable individual retirement arrangement distribution: $8,056 (reported on 10.6% of returns)
49905:
$8,056
Michigan:
$15,298
(% of AGI for various income ranges: 3.7% for AGIs below $25k, 2.7% for AGIs $25k-50k, 4.1% for AGIs $50k-75k)
Total itemized deductions: $17,662 (22% of AGI, reported on 15.3% of returns)
Here:
$17,662
State:
$21,628
Here:
22.1% of AGI
State:
18.4% of AGI
(% of AGI for various income ranges: 7.8% for AGIs $25k-50k, 5.8% for AGIs $50k-75k, 6.1% for AGIs $75k-100k, 11.1% for AGIs $100k-200k)
Charity contributions: $2,711 (reported on 10.6% of returns)
Here:
$2,711
State:
$4,225
(% of AGI for various income ranges: 1.0% for AGIs below $25k, 1.3% for AGIs $50k-75k, 1.4% for AGIs $100k-200k)
Taxes paid: $6,046 (reported on 15.3% of returns)
49905:
$6,046
State:
$8,327
(% of AGI for various income ranges: 1.6% for AGIs $25k-50k, 1.7% for AGIs $50k-75k, 2.5% for AGIs $75k-100k, 5.1% for AGIs $100k-200k)
Earned income credit: $1,913 (reported on 17.6% of returns)
Here:
$1,913
State:
$2,306
(% of AGI for various income ranges: 4.2% for AGIs below $25k, 1.4% for AGIs $25k-50k)
Percentage of individuals using paid preparers for their 2012 taxes: 44.7%
Here:
45%
State:
57%
(% for various income ranges: 40.0% for AGIs below $25k, 47.8% for AGIs $25k-50k, 42.9% for AGIs $50k-75k, 50.0% for AGIs $75k-100k, 60.0% for AGIs $100k-200k)
Averages for the 2004 tax year for zip code 49905, filed in 2005:
Average Adjusted Gross Income (AGI) in 2004: $30,942 (Individual Income Tax Returns)
Here:
$30,942
State:
$48,204
Salary/wage: $27,094 (reported on 90.0% of returns)
Here:
$27,094
State:
$42,791
(% of AGI for various income ranges: 100.5% for AGIs below $10k, 75.1% for AGIs $10k-25k, 83.1% for AGIs $25k-50k, 85.4% for AGIs $50k-75k, 81.1% for AGIs $75k-100k, 43.3% for AGIs over 100k)
Taxable interest for individuals: $721 (reported on 44.8% of returns)
This zip code:
$721
Michigan:
$1,725
(% of AGI for various income ranges: 1.2% for AGIs below $10k, 1.0% for AGIs $10k-25k, 0.9% for AGIs $25k-50k, 0.9% for AGIs $50k-75k, 0.2% for AGIs $75k-100k, 2.8% for AGIs over 100k)
Taxable dividends: $1,707 (reported on 18.6% of returns)
Here:
$1,707
State:
$3,420
(% of AGI for various income ranges: 0.7% for AGIs below $10k, 2.1% for AGIs $10k-25k, 0.7% for AGIs $25k-50k, 0.9% for AGIs $50k-75k, 0.4% for AGIs $75k-100k, 1.8% for AGIs over 100k)
Net capital gain/loss: +$3,173 (reported on 13.8% of returns)
Here:
+$3,173
State:
+$8,532
(% of AGI for various income ranges: -0.3% for AGIs below $10k, 0.2% for AGIs $10k-25k, 1.1% for AGIs $25k-50k, 1.7% for AGIs $50k-75k, 4.7% for AGIs $75k-100k)
Profit/loss from business: +$10,731 (reported on 14.3% of returns)
Here:
+$10,731
State:
+$9,547
(% of AGI for various income ranges: 4.4% for AGIs below $10k, 5.6% for AGIs $10k-25k, 3.7% for AGIs $25k-50k, 1.3% for AGIs $50k-75k, 19.3% for AGIs $75k-100k)
IRA payment deduction: $3,500 (reported on 4.2% of returns)
49905:
$3,500
Michigan:
$2,875
Total itemized deductions: $14,495 (22% of AGI, reported on 12.6% of returns)
Here:
$14,495
State:
$18,509
Here:
21.7% of AGI
State:
20.7% of AGI
(% of AGI for various income ranges: 3.7% for AGIs $10k-25k, 4.8% for AGIs $25k-50k, 7.0% for AGIs $50k-75k, 7.5% for AGIs $75k-100k, 9.8% for AGIs over 100k)
Charity contributions deductions: $2,107 (3% of AGI, reported on 10.0% of returns)
Here:
$2,107
State:
$3,365
Here:
3.2% of AGI
State:
3.6% of AGI
Total tax: $3,362 (reported on 69.1% of returns)
49905:
$3,362
State:
$7,691
(% of AGI for various income ranges: 2.0% for AGIs below $10k, 4.9% for AGIs $10k-25k, 5.8% for AGIs $25k-50k, 6.4% for AGIs $50k-75k, 9.0% for AGIs $75k-100k, 19.3% for AGIs over 100k)
Earned income credit: $1,711 (reported on 15.1% of returns)
Here:
$1,711
State:
$1,737
Percentage of individuals using paid preparers for their 2004 taxes: 43.7%
Here:
44%
State:
60%
(% for various income ranges: 32.7% for AGIs below $10k, 43.9% for AGIs $10k-25k, 46.9% for AGIs $25k-50k, 51.5% for AGIs $50k-75k, 82.9% for AGIs $75k-100k)
Household received Food Stamps/SNAP in the past 12 months: 101 Household did not receive Food Stamps/SNAP in the past 12 months: 650
Women who had a birth in the past 12 months: 31 (17 now married, 13 unmarried) Women who did not have a birth in the past 12 months: 369 (228 now married, 138 unmarried)
Housing units in zip code 49905 with a mortgage: 395 (38 second mortgage, 40 both second mortgage and home equity loan) Houses without a mortgage: 8
Median monthly owner costs for units with a mortgage: $1,319 Median monthly owner costs for units without a mortgage: $422
Residents with income below the poverty level in 2022:
This zip code:
6.7%
Whole state:
13.4%
Residents with income below 50% of the poverty level in 2022:
This zip code:
2.4%
Whole state:
6.9%
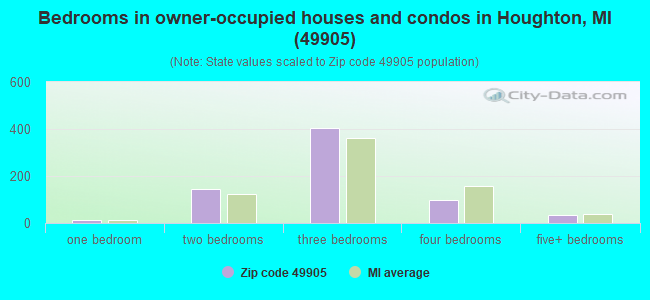
Median number of rooms in houses and condos:
Here:
6.7
State:
6.5
Median number of rooms in apartments:
Here:
6.7
State:
4.3
Notable locations in this zip code not listed on our city pages
Notable locations in zip code 49905: Portage Lake District Library (A), Adams Township Volunteer Fire Department Atlantic Mine (B). Display/hide their locations on the map
In group quarters: 5 (-1 institutionalized population)
Size of family households: 227 2-persons, 143 3-persons, 39 4-persons, 37 5-persons, 113 6-persons, 26 7-or-more-persons
Size of nonfamily households: 131 1-person, 13 2-persons, 17 4-persons
596 married couples with children.
63 single-parent households (46 men, 17 women).
99.1% of residents of 49905 zip code speak English at home.
0.1% of residents speak other language at home (100% very well).
Foreign born population: 0 (0.0%)
:
0.0%
Whole state:
6.9%
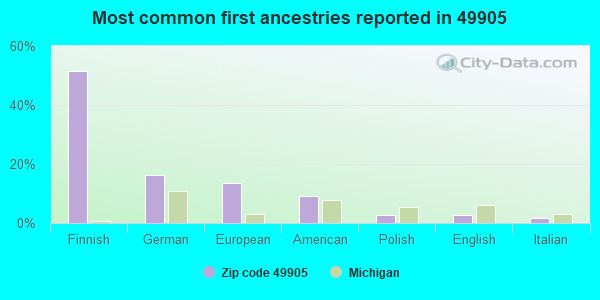
52%Finnish
16%German
13%European
9%American
3%Polish
3%English
2%Italian
Facilities with environmental interests located in this zip code:
E.B. HOLMAN ELEMENTARY SCHOOL (50870 HOLMAN SCHOOL ROAD in ATLANTIC MINE, MI)
(National Center for Education Statistics) - STATE ID-06401 Organizations: STANTON TOWNSHIP PUBLIC SCHOOLS (SCHOOL DISTRICT)
ADAMS TWP WWSL (OBENOFF ROAD in ATLANTIC MINE, MI)
National Pollutant Discharge Elimination System NON-MAJOR (Tracking pollutant discharge elimination systems) - permit Business SIC classification: SEWERAGE SYSTEMS Organizations: ADAMS TOWNSHIP (CONTACT/OWNER)
Housing units lacking complete plumbing facilities: 7.4% Housing units lacking complete kitchen facilities: 2.3%
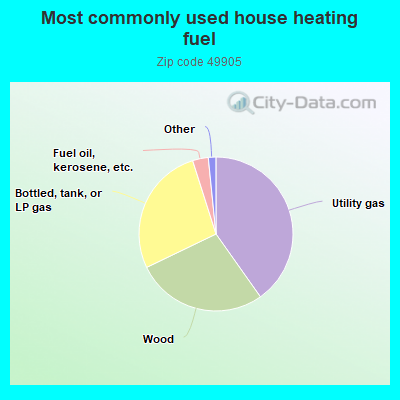
40.3%Utility gas
27.7%Wood
27.3%Bottled, tank, or LP gas
3.3%Fuel oil, kerosene, etc.
1.0%No fuel used
0.7%Electricity
Population in 1990: 3,379.
Place of birth for U.S.-born residents:
This state: 1,744
Northeast: 40
Midwest: 383
South: 99
West: 79
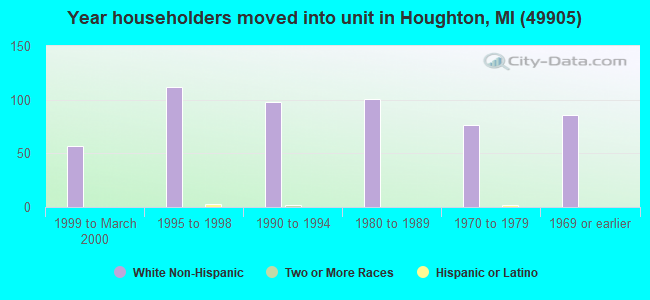
70% of the 49905 zip code residents lived in the same house 5 years ago. Out of people who lived in different houses, 67% lived in this county. Out of people who lived in different counties, 50% lived in Michigan.
92% of the 49905 zip code residents lived in the same house 1 year ago. Out of people who lived in different houses, 23% moved from this county. Out of people who lived in different houses, 11% moved from different county within same state. Out of people who lived in different houses, 75% moved from different state.
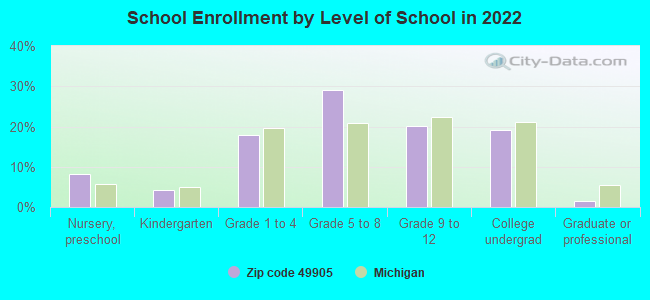
Private vs. public school enrollment:
Students in private schools in grades 1 to 8 (elementary and middle school): 9
Here:
2.6%
Michigan:
12.4%
Students in private schools in grades 9 to 12 (high school):
Here:
0.0%
Michigan:
9.8%
Students in private undergraduate colleges: 25
Here:
17.7%
Michigan:
14.9%
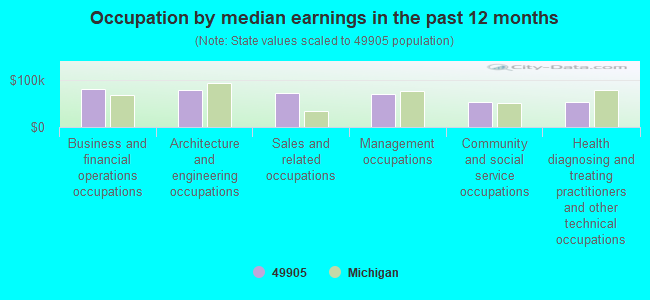
Occupation by median earnings in the past 12 months ($)
79,446Business and financial operations occupations
78,240Architecture and engineering occupations
70,606Sales and related occupations
68,711Management occupations
52,067Community and social service occupations
51,780Health diagnosing and treating practitioners and other technical occupations
Top industries in this zip code by the number of employees in 2005:
Administrative and Support and Waste Management and Remediation Services: Temporary Help Services (20-49 employees: 1 establishment)
Construction: Plumbing, Heating, and Air-Conditioning Contractors (10-19: 1, 1-4: 1)
Health Care and Social Assistance: Other Residential Care Facilities (10-19: 1, 1-4: 1)
Professional, Scientific, and Technical Services: Other Accounting Services (10-19: 1)
Construction: New Single-Family Housing Construction (except Operative Builders) (5-9: 1, 1-4: 2)
Other Services (except Public Administration): Automotive Glass Replacement Shops (5-9: 1)
Administrative and Support and Waste Management and Remediation Services: Janitorial Services (5-9: 1)
People in group quarters in 2010:
8 people in group homes for juveniles (non-correctional)
8 people in group homes intended for adults
5 people in other noninstitutional facilities
Fatal accident statistics in 2011:
Fatal accident count: 2
Vehicles involved in fatal accidents: 3
Fatal accidents caused by drunken drivers: 1
Fatalities: 2
Persons involved in fatal accidents: 3
Pedestrians involved in fatal accidents: 0
2002 - 2018 National Fire Incident Reporting System (NFIRS) incidents
According to the data from the years 2002 - 2018 the average number of fires per year is 7. The highest number of reported fires - 13 took place in 2006, and the least - 2 in 2016. The data has a constant trend.
When looking into fire subcategories, the most incidents belonged to: Structure Fires (60.5%), and Outside Fires (21.8%).
Fire incident types reported to NFIRS in Zip Code 49905


 Nearest zip codes: 49963, 49955, 49921, 49931, 49930, 49916.


 According to the data from the years 2002 - 2018 the average number of fires per year is 7. The highest number of reported fires - 13 took place in 2006, and the least - 2 in 2016. The data has a constant trend.
 When looking into fire subcategories, the most incidents belonged to: Structure Fires (60.5%), and Outside Fires (21.8%).