Estimated zip code population in 2022: 978 Zip code population in 2010: 1,121 Zip code population in 2000: 1,419
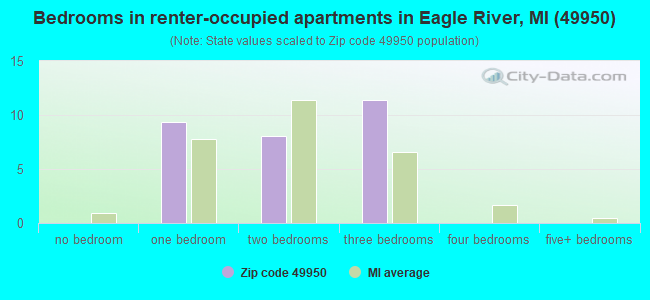
Houses and condos: 1,243 Renter-occupied apartments: 28
% of renters here:
6%
State:
27%
March 2022 cost of living index in zip code 49950: 81.2 (low, U.S. average is 100)
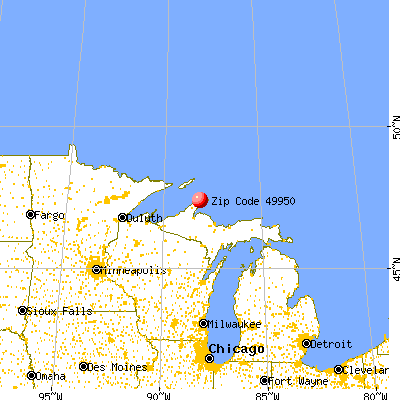
Land area: 178.7 sq. mi. Water area: 11.4 sq. mi.
Population density: 5 people per square mile
(very low).
OSM Map
General Map
Google Map
MSN Map
OSM Map
General Map
Google Map
MSN Map
OSM Map
General Map
Google Map
MSN Map
OSM Map
General Map
Google Map
MSN Map
Please wait while loading the map...
Real estate property taxes paid for housing units in 2022:
This zip code:
0.9% ($1,965)
Michigan:
1.2% ($2,746)
Median real estate property taxes paid for housing units with mortgages in 2022: $2,280 (1.0%) Median real estate property taxes paid for housing units with no mortgage in 2022: $1,587 (0.8%)
Business Search- 14 Million verified businesses
Males: 518
(53.0%)
Females: 460
(47.0%)
For population 25 years and over in 49950:
High school or higher: 97.7%
Bachelor's degree or higher: 40.7%
Graduate or professional degree: 18.1%
Unemployed: 4.6%
Mean travel time to work (commute): 23.7 minutes
For population 15 years and over in 49950:
Never married: 12.1%
Now married: 72.5%
Separated: 0.4%
Widowed: 6.9%
Divorced: 8.0%
Zip code 49950 compared to state average:
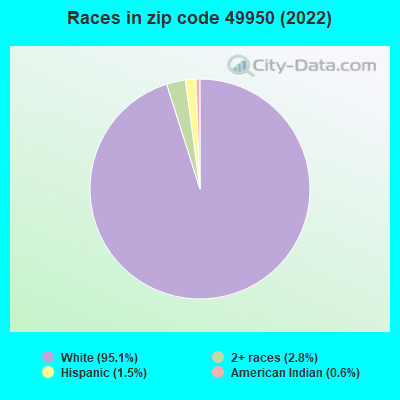
Black race population percentage significantly below state average.
Hispanic race population percentage significantly below state average.
Median age significantly above state average.
Foreign-born population percentage significantly below state average.
Renting percentage significantly below state average.
Length of stay since moving in significantly above state average.
Number of college students significantly below state average.
Percentage of population with a bachelor's degree or higher above state average.
Estimated median house/condo value in 2022: $219,044
49950:
$219,044
Michigan:
$224,400
According to our research of Michigan and other state lists, there was 1 registered sex offender living in 49950 zip code as of June 07, 2024. The ratio of all residents to sex offenders in zip code 49950 is 1,333 to 1. The ratio of registered sex offenders to all residents in this zip code is much lower than the state average.
Median resident age:
This zip code:
64.1 years
Michigan median age:
40.3 years
Average household size:
This zip code:
1.9 people
Michigan:
2.4 people
Averages for the 2020 tax year for zip code 49950, filed in 2021:
Average Adjusted Gross Income (AGI) in 2020: $62,382 (Individual Income Tax Returns)
Here:
$62,382
State:
$68,945
Salary/wage: $44,555 (reported on 66.7% of returns)
Here:
$44,555
State:
$57,142
(% of AGI for various income ranges: 881.8% for AGIs below $25k, 2681.0% for AGIs $25k-50k, 4908.3% for AGIs $50k-75k, 8166.7% for AGIs $75k-100k, 15770.0% for AGIs $100k-200k)
Taxable interest for individuals: $979 (reported on 42.1% of returns)
This zip code:
$979
Michigan:
$1,630
(% of AGI for various income ranges: 10.9% for AGIs below $25k, 39.0% for AGIs $25k-50k, 61.7% for AGIs $50k-75k, 73.3% for AGIs $75k-100k, 250.0% for AGIs $100k-200k)
Ordinary dividends: $5,941 (reported on 29.8% of returns)
Here:
$5,941
State:
$6,972
(% of AGI for various income ranges: 82.7% for AGIs below $25k, 62.0% for AGIs $25k-50k, 128.3% for AGIs $50k-75k, 333.3% for AGIs $75k-100k, 1360.0% for AGIs $100k-200k)
Net capital gain/loss in AGI: +$9,160 (reported on 26.3% of returns)
Here:
+$9,160
State:
+$20,064
(% of AGI for various income ranges: 12.7% for AGIs below $25k, 41.0% for AGIs $25k-50k, 160.0% for AGIs $50k-75k, 2446.0% for AGIs $100k-200k)
Profit/loss from business: +$5,933 (reported on 10.5% of returns)
Here:
+$5,933
State:
+$11,172
(% of AGI for various income ranges: 257.0% for AGIs $25k-50k, 330.0% for AGIs $75k-100k)
Taxable individual retirement arrangement distribution: $26,764 (reported on 19.3% of returns)
49950:
$26,764
Michigan:
$19,803
(% of AGI for various income ranges: 345.0% for AGIs $25k-50k, 970.0% for AGIs $50k-75k, 4034.0% for AGIs $100k-200k)
Total itemized deductions: $37,767 (reported on 5.3% of returns)
Here:
$37,767
State:
$34,117
(% of AGI for various income ranges: 2266.0% for AGIs $100k-200k)
Charity contributions: $10,167 (reported on 5.3% of returns)
Here:
$10,167
State:
$13,548
(% of AGI for various income ranges: 610.0% for AGIs $100k-200k)
Taxes paid: $9,933 (reported on 5.3% of returns)
49950:
$9,933
State:
$7,972
(% of AGI for various income ranges: 596.0% for AGIs $100k-200k)
Earned income credit: $1,917 (reported on 10.5% of returns)
Here:
$1,917
State:
$2,251
(% of AGI for various income ranges: 104.5% for AGIs below $25k)
Percentage of individuals using paid preparers for their 2020 taxes: 89.5%
Here:
89%
State:
93%
(% for various income ranges: 83.3% for AGIs below $25k, 92.9% for AGIs $25k-50k, 88.9% for AGIs $50k-75k, 100.0% for AGIs $75k-100k, 87.5% for AGIs $100k-200k, 100.0% for AGIs over 200k)
Averages for the 2012 tax year for zip code 49950, filed in 2013:
Average Adjusted Gross Income (AGI) in 2012: $46,428 (Individual Income Tax Returns)
Here:
$46,428
State:
$55,609
Salary/wage: $30,538 (reported on 74.1% of returns)
Here:
$30,538
State:
$46,782
(% of AGI for various income ranges: 54.8% for AGIs below $25k, 62.7% for AGIs $25k-50k, 58.9% for AGIs $50k-75k, 44.7% for AGIs $75k-100k, 33.7% for AGIs $100k-200k)
Taxable interest for individuals: $1,169 (reported on 53.7% of returns)
This zip code:
$1,169
Michigan:
$1,491
(% of AGI for various income ranges: 1.9% for AGIs below $25k, 1.8% for AGIs $25k-50k, 0.8% for AGIs $50k-75k, 0.7% for AGIs $75k-100k, 1.6% for AGIs $100k-200k)
Ordinary dividends: $5,318 (reported on 31.5% of returns)
Here:
$5,318
State:
$6,225
(% of AGI for various income ranges: 2.1% for AGIs below $25k, 0.9% for AGIs $25k-50k, 1.5% for AGIs $50k-75k, 2.0% for AGIs $75k-100k, 8.2% for AGIs $100k-200k)
Net capital gain/loss in AGI: +$2,810 (reported on 18.5% of returns)
Here:
+$2,810
State:
+$9,326
(% of AGI for various income ranges: 0.8% for AGIs $75k-100k, 3.5% for AGIs $100k-200k)
Profit/loss from business: +$4,400 (reported on 16.7% of returns)
Here:
+$4,400
State:
+$11,523
(% of AGI for various income ranges: 2.1% for AGIs below $25k, 0.5% for AGIs $25k-50k, 6.6% for AGIs $75k-100k)
Taxable individual retirement arrangement distribution: $15,136 (reported on 20.4% of returns)
49950:
$15,136
Michigan:
$15,298
(% of AGI for various income ranges: 7.6% for AGIs below $25k, 5.0% for AGIs $25k-50k, 4.4% for AGIs $50k-75k, 20.8% for AGIs $75k-100k)
Total itemized deductions: $20,123 (24% of AGI, reported on 24.1% of returns)
Here:
$20,123
State:
$21,628
Here:
23.9% of AGI
State:
18.4% of AGI
(% of AGI for various income ranges: 15.9% for AGIs $25k-50k, 7.7% for AGIs $50k-75k, 8.4% for AGIs $75k-100k, 13.2% for AGIs $100k-200k)
Charity contributions: $3,356 (reported on 16.7% of returns)
Here:
$3,356
State:
$4,225
(% of AGI for various income ranges: 1.4% for AGIs $25k-50k, 1.9% for AGIs $50k-75k, 1.7% for AGIs $100k-200k)
Taxes paid: $6,846 (reported on 24.1% of returns)
49950:
$6,846
State:
$8,327
(% of AGI for various income ranges: 3.5% for AGIs $25k-50k, 2.3% for AGIs $50k-75k, 2.6% for AGIs $75k-100k, 6.1% for AGIs $100k-200k)
Earned income credit: $1,817 (reported on 11.1% of returns)
Here:
$1,817
State:
$2,306
(% of AGI for various income ranges: 4.6% for AGIs below $25k)
Percentage of individuals using paid preparers for their 2012 taxes: 50.0%
Here:
50%
State:
57%
(% for various income ranges: 42.9% for AGIs below $25k, 42.9% for AGIs $25k-50k, 62.5% for AGIs $50k-75k, 50.0% for AGIs $75k-100k, 80.0% for AGIs $100k-200k)
Averages for the 2004 tax year for zip code 49950, filed in 2005:
Average Adjusted Gross Income (AGI) in 2004: $37,363 (Individual Income Tax Returns)
Here:
$37,363
State:
$48,204
Salary/wage: $28,268 (reported on 77.4% of returns)
Here:
$28,268
State:
$42,791
(% of AGI for various income ranges: 78.4% for AGIs below $10k, 57.2% for AGIs $10k-25k, 64.5% for AGIs $25k-50k, 61.5% for AGIs $50k-75k, 54.3% for AGIs $75k-100k, 50.5% for AGIs over 100k)
Taxable interest for individuals: $1,636 (reported on 58.0% of returns)
This zip code:
$1,636
Michigan:
$1,725
(% of AGI for various income ranges: 8.7% for AGIs below $10k, 6.1% for AGIs $10k-25k, 1.7% for AGIs $25k-50k, 1.9% for AGIs $50k-75k, 0.9% for AGIs $75k-100k, 2.1% for AGIs over 100k)
Taxable dividends: $3,746 (reported on 35.4% of returns)
Here:
$3,746
State:
$3,420
(% of AGI for various income ranges: 1.7% for AGIs below $10k, 3.1% for AGIs $10k-25k, 2.6% for AGIs $25k-50k, 1.7% for AGIs $50k-75k, 0.4% for AGIs $75k-100k, 7.8% for AGIs over 100k)
Net capital gain/loss: +$6,133 (reported on 23.5% of returns)
Here:
+$6,133
State:
+$8,532
(% of AGI for various income ranges: -2.9% for AGIs below $10k, 0.5% for AGIs $10k-25k, 0.1% for AGIs $25k-50k, 1.7% for AGIs $50k-75k, 2.7% for AGIs $75k-100k, 12.3% for AGIs over 100k)
Profit/loss from business: +$6,643 (reported on 12.8% of returns)
Here:
+$6,643
State:
+$9,547
(% of AGI for various income ranges: -1.5% for AGIs below $10k, 3.0% for AGIs $10k-25k, 2.5% for AGIs $25k-50k, 5.6% for AGIs $50k-75k)
Total itemized deductions: $17,538 (22% of AGI, reported on 19.4% of returns)
Here:
$17,538
State:
$18,509
Here:
22.0% of AGI
State:
20.7% of AGI
(% of AGI for various income ranges: 10.2% for AGIs $10k-25k, 5.7% for AGIs $25k-50k, 7.4% for AGIs $50k-75k, 17.2% for AGIs $75k-100k, 11.2% for AGIs over 100k)
Charity contributions deductions: $2,787 (3% of AGI, reported on 16.3% of returns)
Here:
$2,787
State:
$3,365
Here:
3.4% of AGI
State:
3.6% of AGI
(% of AGI for various income ranges: 2.7% for AGIs below $10k, 0.6% for AGIs $25k-50k, 1.6% for AGIs $50k-75k, 1.7% for AGIs $75k-100k, 1.7% for AGIs over 100k)
Total tax: $4,896 (reported on 73.9% of returns)
49950:
$4,896
State:
$7,691
(% of AGI for various income ranges: 1.2% for AGIs below $10k, 4.0% for AGIs $10k-25k, 6.2% for AGIs $25k-50k, 9.1% for AGIs $50k-75k, 9.5% for AGIs $75k-100k, 17.4% for AGIs over 100k)
Earned income credit: $1,254 (reported on 13.0% of returns)
Here:
$1,254
State:
$1,737
Percentage of individuals using paid preparers for their 2004 taxes: 49.5%
Here:
50%
State:
60%
(% for various income ranges: 38.4% for AGIs below $10k, 48.6% for AGIs $10k-25k, 52.2% for AGIs $25k-50k, 52.4% for AGIs $50k-75k, 64.0% for AGIs $75k-100k, 69.0% for AGIs over 100k)
Household received Food Stamps/SNAP in the past 12 months: 43 Household did not receive Food Stamps/SNAP in the past 12 months: 472
Women who had a birth in the past 12 months: 13 (12 now married, 0 unmarried) Women who did not have a birth in the past 12 months: 116 (64 now married, 51 unmarried)
Housing units in zip code 49950 with a mortgage: 208 (5 second mortgage, 4 both second mortgage and home equity loan) Houses without a mortgage: 5
Median monthly owner costs for units with a mortgage: $1,140 Median monthly owner costs for units without a mortgage: $443
Residents with income below the poverty level in 2022:
This zip code:
7.7%
Whole state:
13.4%
Residents with income below 50% of the poverty level in 2022:
This zip code:
3.9%
Whole state:
6.9%
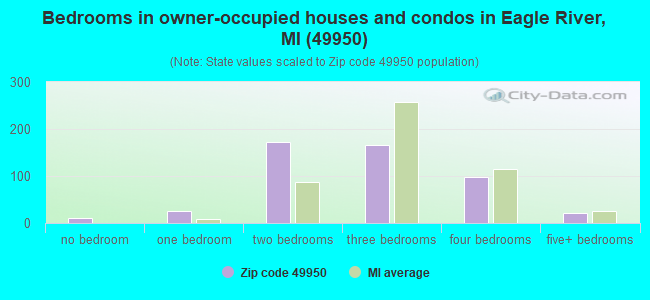
Median number of rooms in houses and condos:
Here:
6.0
State:
6.5
Median number of rooms in apartments:
Here:
5.1
State:
4.3
Notable locations in this zip code not listed on our city pages
Notable locations in zip code 49950: Mendota Light House (A), North Piech Lighthouse (B), Lac La Belle Marina (C), Lac La Belle Resort (D), Mount Bohemia Ski Area (E), Eagle Harbor Marina (F), Eagle Harbor Lighthouse (G), Allouez Township Hall (H), Allouez Township Fire Department (I), Lac La Belle Volunteer Fire Department (J), Eagle Harbor Township Volunteer Fire Department Station 2 (K), Eagle Harbor Township Volunteer Fire Department Station 1 Headquarters (L). Display/hide their locations on the map
Lakes and swamps: Lake Upson (A), Long Lake (B), Owl Lake (C), North Pond (D), Lac La Belle (E), Mudd Lake (F), Mud Lake (G), Horseshoe Pond (H). Display/hide their locations on the map
Rivers and creeks: Eister Creek (A), West Branch Eagle River (B), Bailey Creek (C), Garden City Creek (D), Upson Creek (E), Haven Creek (F), Farlow Creek (G), Eliza Creek (H), Sucker Creek (I). Display/hide their locations on the map
Parks in zip code 49950 include: Hebard Park (1), Eagle Harbor House Historical Marker (2), Lake Shore Drive Bridge Historical Marker (3), Eagle River Historical Marker (4), Haven Park (5), Esrey Park (6). Display/hide their locations on the map
In group quarters: 10 (-1 institutionalized population)
Size of family households: 246 2-persons, 48 3-persons, 43 4-persons, 7 5-persons, 4 7-or-more-persons
Size of nonfamily households: 149 1-person, 20 2-persons
79 married couples with children.
10 single-parent households (4 men, 6 women).
99.6% of residents of 49950 zip code speak English at home.
0.8% of residents speak other Indo-European language at home (75% very well, 25% not well).
1.1% of residents speak other language at home (73% very well, 27% well).
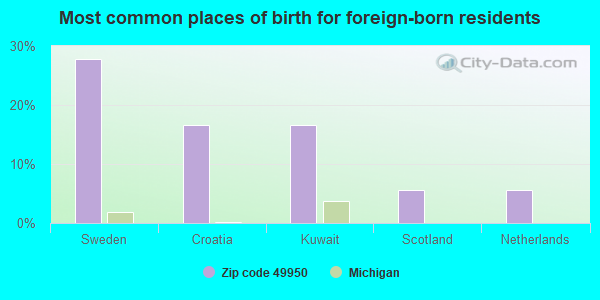
Foreign born population: 18 (1.8%) (62.3% of them are naturalized citizens)
This zip code:
1.8%
Whole state:
6.9%
28%Sweden
17%Croatia
17%Kuwait
6%Scotland
6%Netherlands
37%Finnish
22%English
14%German
4%French
3%Irish
3%Polish
2%American
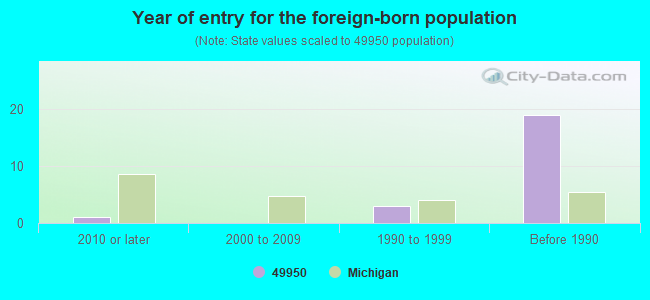
Year of entry for the foreign-born population
12010 or later
02000 to 2009
31990 to 1999
19Before 1990
Public high school in in zip code 49950 not listed on the city page:
CHS-HORIZONS SCHOOL (Location: 110 STANTON AVE, Grades: 9-12)
Facilities with environmental interests located in this zip code:
MI DEPT/TRANSPORTATION BRIDGE (M-26 OVER EAGLE RIVER in EAGLE RIVER, MI)
(Resource Conservation and Recovery Act (tracking hazardous waste)) Organizations: MICH DEPT OF TRANSPORTATION (CONTACT/OPERATOR)
Alternative names: MIDOT BRIDGE M-26 OVER EAGLE RIVER
CRITERIA AND HAZARDOUS AIR POLLUTANT INVENTORY (Inventory of air pollution sources) COMMUNITY WATER SYSTEM (SDWIS) Business SIC classification: REFUSE SYSTEMS Business NAICS classification: SOLID WASTE LANDFILL.
Housing units lacking complete plumbing facilities: 8.8% Housing units lacking complete kitchen facilities: 5.3%
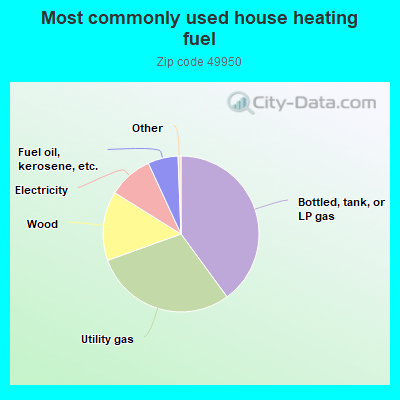
40.1%Bottled, tank, or LP gas
29.7%Utility gas
14.4%Wood
9.3%Electricity
6.3%Fuel oil, kerosene, etc.
Population in 1990: 1,701.
Place of birth for U.S.-born residents:
This state: 681
Northeast: 20
Midwest: 215
South: 28
West: 7
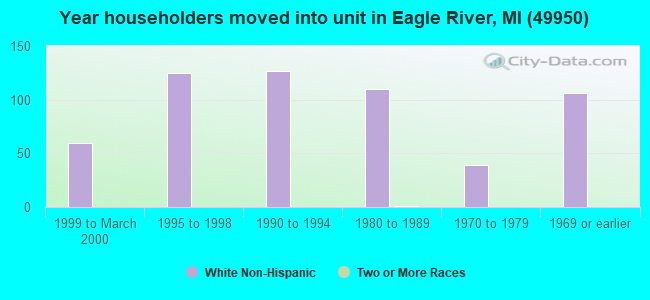
63% of the 49950 zip code residents lived in the same house 5 years ago. Out of people who lived in different houses, 16% lived in this county. Out of people who lived in different counties, 50% lived in Michigan.
92% of the 49950 zip code residents lived in the same house 1 year ago. Out of people who lived in different houses, 1% moved from this county. Out of people who lived in different houses, 47% moved from different county within same state. Out of people who lived in different houses, 58% moved from different state.
Private vs. public school enrollment:
Students in private schools in grades 1 to 8 (elementary and middle school):
Here:
0.0%
Michigan:
12.4%
Students in private schools in grades 9 to 12 (high school):
Here:
0.0%
Michigan:
9.8%
Students in private undergraduate colleges:
Here:
19.8%
Michigan:
14.9%
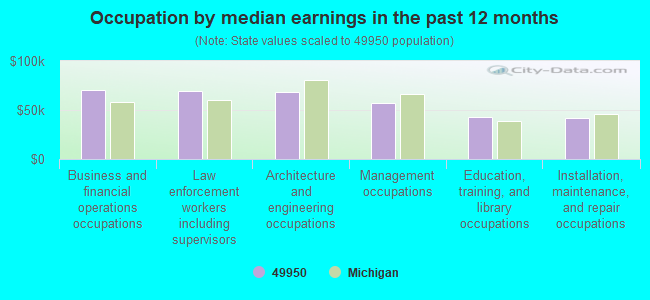
Occupation by median earnings in the past 12 months ($)
70,776Business and financial operations occupations
69,742Law enforcement workers including supervisors
68,420Architecture and engineering occupations
57,109Management occupations
42,674Education, training, and library occupations
41,760Installation, maintenance, and repair occupations
Top industries in this zip code by the number of employees in 2005:
Professional, Scientific, and Technical Services: Graphic Design Services (10-19: 1)
Arts, Entertainment, and Recreation: All Other Amusement and Recreation Industries (10-19: 1)
Accommodation and Food Services: Hotels (except Casino Hotels) and Motels (5-9: 1)
Other Services (except Public Administration): Religious Organizations (1-4: 2)
Real Estate and Rental and Leasing: Lessors of Residential Buildings and Dwellings (1-4: 2)
Mining: Construction Sand and Gravel Mining (1-4: 2)
Accommodation and Food Services: Recreational and Vacation Camps (except Campgrounds) (1-4: 1)
People in group quarters in 2010:
6 people in other noninstitutional facilities
4 people in local jails and other municipal confinement facilities
People in group quarters in 2000:
123 people in training schools for juvenile delinquents
41 people in other noninstitutional group quarters
6 people in unknown juvenile institutions
4 people in local jails and other confinement facilities (including police lockups)
4 people in religious group quarters
Fatal accident statistics in 2010:
Fatal accident count: 1
Vehicles involved in fatal accidents: 1
Fatal accidents caused by drunken drivers: 0
Fatalities: 1
Persons involved in fatal accidents: 4
Pedestrians involved in fatal accidents: 0
2002 - 2018 National Fire Incident Reporting System (NFIRS) incidents
According to the data from the years 2002 - 2018 the average number of fire incidents per year is 9. The highest number of fires - 19 took place in 2003, and the least - 1 in 2014. The data has a decreasing trend.
When looking into fire subcategories, the most incidents belonged to: Outside Fires (49.7%), and Structure Fires (39.4%).
Fire incident types reported to NFIRS in Zip Code 49950


 Nearest zip codes: 49805, 49917, 49945, 49901, 49918, 49942.


 (Location: 110 STANTON AVE, Grades: 9-12)


 According to the data from the years 2002 - 2018 the average number of fire incidents per year is 9. The highest number of fires - 19 took place in 2003, and the least - 1 in 2014. The data has a decreasing trend.
 When looking into fire subcategories, the most incidents belonged to: Outside Fires (49.7%), and Structure Fires (39.4%).