Estimated zip code population in 2022: 1,658 Zip code population in 2010: 1,524 Zip code population in 2000: 1,390
Houses and condos: 827 Renter-occupied apartments: 85
% of renters here:
12%
State:
28%
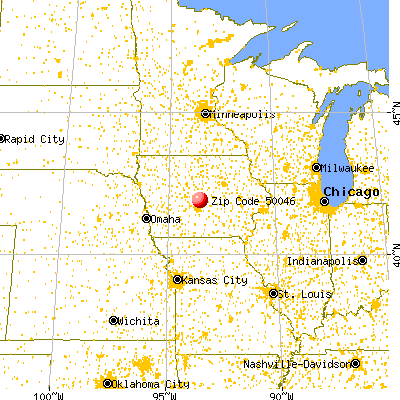
March 2022 cost of living index in zip code 50046: 88.5 (less than average, U.S. average is 100)
Land area: 46.0 sq. mi. Water area: 0.3 sq. mi.
Population density: 36 people per square mile
(very low).
OSM Map
General Map
Google Map
MSN Map
OSM Map
General Map
Google Map
MSN Map
OSM Map
General Map
Google Map
MSN Map
OSM Map
General Map
Google Map
MSN Map
Please wait while loading the map...
Real estate property taxes paid for housing units in 2022:
This zip code:
1.4% ($2,871)
Iowa:
1.4% ($2,724)
Median real estate property taxes paid for housing units with mortgages in 2022: $3,050 (1.5%) Median real estate property taxes paid for housing units with no mortgage in 2022: $2,719 (1.2%)
Estimated median house/condo value in 2022: $210,888
50046:
$210,888
Iowa:
$194,600
Median resident age:
This zip code:
38.4 years
Iowa median age:
38.9 years
Average household size:
This zip code:
2.4 people
Iowa:
2.3 people
Averages for the 2020 tax year for zip code 50046, filed in 2021:
Average Adjusted Gross Income (AGI) in 2020: $84,629 (Individual Income Tax Returns)
Here:
$84,629
State:
$71,087
Salary/wage: $73,036 (reported on 83.6% of returns)
Here:
$73,036
State:
$57,361
(% of AGI for various income ranges: 1320.0% for AGIs below $25k, 3363.3% for AGIs $25k-50k, 5998.8% for AGIs $50k-75k, 9930.0% for AGIs $75k-100k, 15203.6% for AGIs $100k-200k)
Taxable interest for individuals: $1,104 (reported on 38.4% of returns)
This zip code:
$1,104
Iowa:
$1,633
(% of AGI for various income ranges: 15.5% for AGIs below $25k, 31.7% for AGIs $25k-50k, 17.5% for AGIs $50k-75k, 51.7% for AGIs $75k-100k, 141.8% for AGIs $100k-200k)
Ordinary dividends: $2,512 (reported on 21.9% of returns)
Here:
$2,512
State:
$5,432
(% of AGI for various income ranges: 23.3% for AGIs $25k-50k, 25.0% for AGIs $50k-75k, 250.0% for AGIs $100k-200k)
Net capital gain/loss in AGI: +$7,192 (reported on 17.8% of returns)
Here:
+$7,192
State:
+$15,243
(% of AGI for various income ranges: 36.2% for AGIs $50k-75k, 204.5% for AGIs $100k-200k)
Profit/loss from business: +$13,617 (reported on 16.4% of returns)
Here:
+$13,617
State:
+$11,763
(% of AGI for various income ranges: 377.5% for AGIs $25k-50k, 353.3% for AGIs $75k-100k, 880.9% for AGIs $100k-200k)
Taxable individual retirement arrangement distribution: $18,756 (reported on 12.3% of returns)
50046:
$18,756
Iowa:
$17,324
(% of AGI for various income ranges: 219.1% for AGIs below $25k, 803.8% for AGIs $50k-75k, 730.9% for AGIs $100k-200k)
Total itemized deductions: $31,257 (reported on 9.6% of returns)
Here:
$31,257
State:
$33,775
(% of AGI for various income ranges: 778.8% for AGIs $50k-75k, 711.8% for AGIs $100k-200k)
Charity contributions: $9,650 (reported on 5.5% of returns)
Here:
$9,650
State:
$13,075
(% of AGI for various income ranges: 350.9% for AGIs $100k-200k)
Taxes paid: $7,783 (reported on 8.2% of returns)
50046:
$7,783
State:
$7,704
(% of AGI for various income ranges: 453.3% for AGIs $75k-100k)
Earned income credit: $2,375 (reported on 5.5% of returns)
Here:
$2,375
State:
$2,195
(% of AGI for various income ranges: 38.2% for AGIs below $25k, 44.2% for AGIs $25k-50k)
Percentage of individuals using paid preparers for their 2020 taxes: 93.2%
Here:
93%
State:
95%
(% for various income ranges: 87.5% for AGIs below $25k, 93.3% for AGIs $25k-50k, 90.9% for AGIs $50k-75k, 100.0% for AGIs $75k-100k, 100.0% for AGIs $100k-200k, 83.3% for AGIs over 200k)
Averages for the 2012 tax year for zip code 50046, filed in 2013:
Average Adjusted Gross Income (AGI) in 2012: $69,100 (Individual Income Tax Returns)
Here:
$69,100
State:
$58,860
Salary/wage: $60,883 (reported on 84.3% of returns)
Here:
$60,883
State:
$46,659
(% of AGI for various income ranges: 66.7% for AGIs below $25k, 76.8% for AGIs $25k-50k, 75.1% for AGIs $50k-75k, 77.4% for AGIs $75k-100k, 84.1% for AGIs $100k-200k, 55.3% for AGIs over 200k)
Taxable interest for individuals: $960 (reported on 42.9% of returns)
This zip code:
$960
Iowa:
$1,537
(% of AGI for various income ranges: 1.6% for AGIs below $25k, 0.4% for AGIs $25k-50k, 0.7% for AGIs $50k-75k, 0.5% for AGIs $75k-100k, 0.7% for AGIs $100k-200k, 0.3% for AGIs over 200k)
Ordinary dividends: $1,282 (reported on 40.0% of returns)
Here:
$1,282
State:
$4,542
(% of AGI for various income ranges: 1.2% for AGIs below $25k, 0.1% for AGIs $25k-50k, 1.4% for AGIs $50k-75k, 0.9% for AGIs $75k-100k, 0.9% for AGIs $100k-200k)
Net capital gain/loss in AGI: +$9,600 (reported on 17.1% of returns)
Here:
+$9,600
State:
+$11,802
(% of AGI for various income ranges: 0.4% for AGIs below $25k, 0.3% for AGIs $50k-75k, 1.7% for AGIs $75k-100k, 6.5% for AGIs $100k-200k)
Profit/loss from business: +$8,854 (reported on 18.6% of returns)
Here:
+$8,854
State:
+$10,509
(% of AGI for various income ranges: 7.3% for AGIs below $25k, 6.0% for AGIs $25k-50k, 2.7% for AGIs $50k-75k, 1.6% for AGIs $75k-100k, 2.0% for AGIs $100k-200k)
Taxable individual retirement arrangement distribution: $9,071 (reported on 10.0% of returns)
50046:
$9,071
Iowa:
$11,773
Total itemized deductions: $21,230 (18% of AGI, reported on 38.6% of returns)
Here:
$21,230
State:
$21,278
Here:
18.5% of AGI
State:
18.9% of AGI
(% of AGI for various income ranges: 11.8% for AGIs $25k-50k, 11.2% for AGIs $50k-75k, 14.8% for AGIs $75k-100k, 13.8% for AGIs $100k-200k, 10.0% for AGIs over 200k)
Charity contributions: $2,748 (reported on 32.9% of returns)
Here:
$2,748
State:
$4,044
(% of AGI for various income ranges: 2.8% for AGIs below $25k, 1.5% for AGIs $50k-75k, 1.6% for AGIs $75k-100k, 2.1% for AGIs $100k-200k)
Taxes paid: $9,171 (reported on 40.0% of returns)
50046:
$9,171
State:
$8,846
(% of AGI for various income ranges: 3.2% for AGIs $25k-50k, 4.1% for AGIs $50k-75k, 5.8% for AGIs $75k-100k, 6.9% for AGIs $100k-200k, 6.1% for AGIs over 200k)
Earned income credit: $2,543 (reported on 10.0% of returns)
Here:
$2,543
State:
$2,098
(% of AGI for various income ranges: 5.1% for AGIs below $25k, 0.9% for AGIs $25k-50k)
Percentage of individuals using paid preparers for their 2012 taxes: 62.9%
Here:
63%
State:
65%
(% for various income ranges: 52.6% for AGIs below $25k, 57.1% for AGIs $25k-50k, 64.3% for AGIs $50k-75k, 66.7% for AGIs $75k-100k, 91.7% for AGIs $100k-200k)
Averages for the 2004 tax year for zip code 50046, filed in 2005:
Average Adjusted Gross Income (AGI) in 2004: $48,578 (Individual Income Tax Returns)
Here:
$48,578
State:
$43,875
Salary/wage: $44,702 (reported on 84.5% of returns)
Here:
$44,702
State:
$38,265
(% of AGI for various income ranges: 138.3% for AGIs below $10k, 67.7% for AGIs $10k-25k, 81.8% for AGIs $25k-50k, 82.2% for AGIs $50k-75k, 80.3% for AGIs $75k-100k, 69.8% for AGIs over 100k)
Taxable interest for individuals: $1,148 (reported on 58.9% of returns)
This zip code:
$1,148
Iowa:
$1,768
(% of AGI for various income ranges: 12.0% for AGIs below $10k, 3.7% for AGIs $10k-25k, 2.0% for AGIs $25k-50k, 0.7% for AGIs $50k-75k, 1.1% for AGIs $75k-100k, 0.8% for AGIs over 100k)
Taxable dividends: $1,151 (reported on 24.7% of returns)
Here:
$1,151
State:
$2,510
(% of AGI for various income ranges: 0.6% for AGIs below $10k, 1.3% for AGIs $10k-25k, 0.7% for AGIs $25k-50k, 0.5% for AGIs $50k-75k, 0.2% for AGIs $75k-100k, 0.7% for AGIs over 100k)
Net capital gain/loss: +$1,438 (reported on 16.3% of returns)
Here:
+$1,438
State:
+$6,139
(% of AGI for various income ranges: 0.4% for AGIs $10k-25k, -0.1% for AGIs $25k-50k, 0.3% for AGIs $50k-75k, 1.0% for AGIs $75k-100k, 0.7% for AGIs over 100k)
Profit/loss from business: +$8,523 (reported on 16.6% of returns)
Here:
+$8,523
State:
+$8,574
(% of AGI for various income ranges: 0.3% for AGIs below $10k, 5.1% for AGIs $10k-25k, 2.1% for AGIs $25k-50k, 2.6% for AGIs $50k-75k, 1.1% for AGIs $75k-100k, 4.5% for AGIs over 100k)
Profit/loss from farming: +$2,509 (reported on 8.9% of returns)
Here:
+$2,509
State:
-$74
(% of AGI for various income ranges: 0.2% for AGIs $10k-25k, -0.6% for AGIs $25k-50k, 1.1% for AGIs $50k-75k, 1.0% for AGIs over 100k)
Total itemized deductions: $16,051 (20% of AGI, reported on 39.9% of returns)
Here:
$16,051
State:
$16,976
Here:
20.5% of AGI
State:
20.8% of AGI
(% of AGI for various income ranges: 15.0% for AGIs $10k-25k, 10.9% for AGIs $25k-50k, 13.0% for AGIs $50k-75k, 14.4% for AGIs $75k-100k, 14.3% for AGIs over 100k)
Charity contributions deductions: $2,656 (3% of AGI, reported on 34.3% of returns)
Here:
$2,656
State:
$3,089
Here:
3.2% of AGI
State:
3.6% of AGI
(% of AGI for various income ranges: 4.5% for AGIs below $10k, 1.4% for AGIs $25k-50k, 1.6% for AGIs $50k-75k, 1.6% for AGIs $75k-100k, 2.9% for AGIs over 100k)
Total tax: $6,472 (reported on 82.0% of returns)
50046:
$6,472
State:
$6,177
(% of AGI for various income ranges: 4.2% for AGIs below $10k, 4.5% for AGIs $10k-25k, 7.1% for AGIs $25k-50k, 8.9% for AGIs $50k-75k, 9.7% for AGIs $75k-100k, 17.3% for AGIs over 100k)
Earned income credit: $1,717 (reported on 8.2% of returns)
Here:
$1,717
State:
$1,540
Percentage of individuals using paid preparers for their 2004 taxes: 64.4%
Here:
64%
State:
70%
(% for various income ranges: 46.4% for AGIs below $10k, 68.2% for AGIs $10k-25k, 70.4% for AGIs $25k-50k, 68.7% for AGIs $50k-75k, 61.4% for AGIs $75k-100k, 68.9% for AGIs over 100k)
Household received Food Stamps/SNAP in the past 12 months: 36 Household did not receive Food Stamps/SNAP in the past 12 months: 653
Women who had a birth in the past 12 months: 10 (10 now married, 0 unmarried) Women who did not have a birth in the past 12 months: 335 (239 now married, 94 unmarried)
Housing units in zip code 50046 with a mortgage: 390 (31 second mortgage, 18 both second mortgage and home equity loan) Houses without a mortgage: 5
Median monthly owner costs for units with a mortgage: $1,577 Median monthly owner costs for units without a mortgage: $682
Residents with income below the poverty level in 2022:
This zip code:
7.4%
Whole state:
11.0%
Residents with income below 50% of the poverty level in 2022:
This zip code:
6.4%
Whole state:
5.5%
Median number of rooms in houses and condos:
Here:
7.0
State:
6.8
Median number of rooms in apartments:
Here:
4.7
State:
4.2
Notable locations in this zip code not listed on our city pages
Notable locations in zip code 50046: Heartland Cooperative Company Elevator (A), Cambridge (B), Cambridge Fire and Rescue (C), Cambridge City Hall (D). Display/hide their locations on the map
Churches in zip code 50046 include: Faith Baptist Church (A), Nazareth Lutheran Church (B), United Methodist Church (C). Display/hide their locations on the map
Size of family households: 193 2-persons, 94 3-persons, 76 4-persons, 35 5-persons, 28 6-persons, 11 7-or-more-persons
Size of nonfamily households: 227 1-person, 20 2-persons
373 married couples with children.
72 single-parent households (33 men, 39 women).
94.6% of residents of 50046 zip code speak English at home.
1.2% of residents speak Spanish at home (78% very well, 17% well, 6% not at all).
2.5% of residents speak other Indo-European language at home (100% very well).
0.8% of residents speak Asian or Pacific Island language at home (100% very well).
Foreign born population: 66 (4.0%) (93.7% of them are naturalized citizens)
This zip code:
4.0%
Whole state:
6.0%
89%France
3%Honduras
2%Malaysia
40%German
22%Norwegian
9%English
5%American
4%Danish
3%Northern European
2%Irish
Year of entry for the foreign-born population
62010 or later
02000 to 2009
11990 to 1999
55Before 1990
Facilities with environmental interests located in this zip code:
EAST ELEMENTARY (505 WEST FOURTH STREET in CAMBRIDGE, IA)
(National Center for Education Statistics) - STATE ID-850472 415 Organizations: BALLARD COMM SCHOOL DISTRICT (SCHOOL DISTRICT)
CAMBRIDGE CITY OF STP (CITY CLERK in CAMBRIDGE, IA)
National Pollutant Discharge Elimination System NON-MAJOR (Tracking pollutant discharge elimination systems) - permit Business SIC classification: SEWERAGE SYSTEMS Organizations: CITY OF CAMBRIDGE (CONTACT/OWNER)
CENTRAL IOWA TRADE SERVICE (101 WATER STREET in CAMBRIDGE, IA)
AIR MINOR (AIRS/AFS) Business SIC classification: GENERAL CONTRACTORS-SINGLE-FAMILY HOUSES Alternative names: CENTRAL IOWA TRADE CENTER
CMBRDGE-ALLEMAN COOP (315 SOUTH WATER STREET in CAMBRIDGE, IA)
AIR MINOR (AIRS/AFS) Business SIC classification: NONCLASSIFIABLE ESTABLISHMENTS Alternative names: HEARTLAND CO-OP CAMBRIDGE, HEARTLAND COOPERATIVE COMPANY
HILGENBERGS REPAIR SHOP (101 WATER ST in CAMBRIDGE, IA)
(Resource Conservation and Recovery Act (tracking hazardous waste)) Business NAICS classification: GENERAL AUTOMOTIVE REPAIR.
Housing units lacking complete plumbing facilities: 10.0% Housing units lacking complete kitchen facilities: 7.6%
48.9%Utility gas
42.4%Bottled, tank, or LP gas
8.0%Electricity
1.1%Other fuel
Population in 1990: 1,103. Population change in the 1990s: +287 (+26.0%).
Place of birth for U.S.-born residents:
This state: 1,287
Northeast: 7
Midwest: 167
South: 61
West: 65
62% of the 50046 zip code residents lived in the same house 5 years ago. Out of people who lived in different houses, 57% lived in this county. Out of people who lived in different counties, 50% lived in Iowa.
96% of the 50046 zip code residents lived in the same house 1 year ago. Out of people who lived in different houses, 60% moved from this county. Out of people who lived in different houses, 40% moved from different county within same state. Out of people who lived in different houses, 2% moved from different state.
Private vs. public school enrollment:
Students in private schools in grades 1 to 8 (elementary and middle school): 14
Here:
6.5%
Iowa:
10.6%
Students in private schools in grades 9 to 12 (high school):
Here:
0.0%
Iowa:
7.9%
Students in private undergraduate colleges:
Here:
12.3%
Iowa:
23.9%
Occupation by median earnings in the past 12 months ($)
108,097Business and financial operations occupations
97,987Management occupations
80,825Computer and mathematical occupations
73,205Health diagnosing and treating practitioners and other technical occupations
71,808Arts, design, entertainment, sports, and media occupations
71,682Architecture and engineering occupations
Top industries in this zip code by the number of employees in 2005:
Construction: Poured Concrete Foundation and Structure Contractors (20-49 employees: 1 establishment)
Construction: Plumbing, Heating, and Air-Conditioning Contractors (5-9: 1)
Wholesale Trade: Grain and Field Bean Merchant Wholesalers (5-9: 1)
Construction: New Single-Family Housing Construction (except Operative Builders) (1-4: 3)
Other Services (except Public Administration): Religious Organizations (1-4: 2)
Finance and Insurance: Commercial Banking (1-4: 1)
Health Care and Social Assistance: Other Community Housing Services (1-4: 1)
Professional, Scientific, and Technical Services: Offices of Certified Public Accountants (1-4: 1)
Fatal accident statistics in 2014:
Fatal accident count: 1
Vehicles involved in fatal accidents: 1
Fatal accidents caused by drunken drivers: 0
Fatalities: 1
Persons involved in fatal accidents: 1
Pedestrians involved in fatal accidents: 1
Fatal accident statistics in 2012:
Fatal accident count: 1
Vehicles involved in fatal accidents: 1
Fatal accidents caused by drunken drivers: 0
Fatalities: 1
Persons involved in fatal accidents: 2
Pedestrians involved in fatal accidents: 0
Home Mortgage Disclosure Act Aggregated Statistics For Year 2009 (Based on 2 partial tracts)
A) FHA, FSA/RHS & VA Home Purchase Loans
B) Conventional Home Purchase Loans
C) Refinancings
D) Home Improvement Loans
F) Non-occupant Loans on < 5 Family Dwellings (A B C & D)
G) Loans On Manufactured Home Dwelling (A B C & D)
Number
Average Value
Number
Average Value
Number
Average Value
Number
Average Value
Number
Average Value
Number
Average Value
LOANS ORIGINATED
44
$138,061
36
$142,084
187
$158,928
20
$79,448
3
$87,240
1
$17,790
APPLICATIONS APPROVED, NOT ACCEPTED
0
$0
8
$123,768
21
$189,163
1
$10,160
1
$44,040
1
$21,180
APPLICATIONS DENIED
5
$148,734
8
$96,558
36
$175,988
4
$45,315
1
$67,760
3
$44,043
APPLICATIONS WITHDRAWN
4
$146,742
5
$167,876
25
$169,502
2
$191,845
3
$130,437
0
$0
FILES CLOSED FOR INCOMPLETENESS
0
$0
0
$0
3
$182,387
1
$135,520
0
$0
0
$0
Aggregated Statistics For Year 2008 (Based on 2 partial tracts)
A) FHA, FSA/RHS & VA Home Purchase Loans
B) Conventional Home Purchase Loans
C) Refinancings
D) Home Improvement Loans
E) Loans on Dwellings For 5+ Families
F) Non-occupant Loans on < 5 Family Dwellings (A B C & D)
G) Loans On Manufactured Home Dwelling (A B C & D)
Number
Average Value
Number
Average Value
Number
Average Value
Number
Average Value
Number
Average Value
Number
Average Value
Number
Average Value
LOANS ORIGINATED
24
$134,955
62
$165,793
95
$126,961
27
$46,114
1
$237,160
15
$116,095
6
$39,103
APPLICATIONS APPROVED, NOT ACCEPTED
2
$117,310
9
$167,518
14
$163,713
3
$51,103
0
$0
1
$140,600
2
$80,465
APPLICATIONS DENIED
5
$129,422
9
$61,926
49
$145,943
14
$57,112
0
$0
0
$0
11
$43,659
APPLICATIONS WITHDRAWN
1
$64,370
8
$205,928
24
$185,670
1
$105,880
0
$0
0
$0
1
$34,730
FILES CLOSED FOR INCOMPLETENESS
0
$0
4
$158,600
3
$136,650
0
$0
0
$0
0
$0
0
$0
Aggregated Statistics For Year 2007 (Based on 2 partial tracts)
A) FHA, FSA/RHS & VA Home Purchase Loans
B) Conventional Home Purchase Loans
C) Refinancings
D) Home Improvement Loans
F) Non-occupant Loans on < 5 Family Dwellings (A B C & D)
G) Loans On Manufactured Home Dwelling (A B C & D)
Number
Average Value
Number
Average Value
Number
Average Value
Number
Average Value
Number
Average Value
Number
Average Value
LOANS ORIGINATED
10
$150,427
119
$132,032
105
$124,896
37
$49,286
17
$86,195
8
$33,669
APPLICATIONS APPROVED, NOT ACCEPTED
0
$0
8
$95,605
19
$126,649
1
$24,560
2
$100,795
2
$27,530
APPLICATIONS DENIED
0
$0
14
$65,461
53
$123,198
14
$56,446
2
$27,950
9
$48,373
APPLICATIONS WITHDRAWN
0
$0
5
$86,564
18
$116,980
2
$24,565
3
$94,017
1
$36,420
FILES CLOSED FOR INCOMPLETENESS
0
$0
0
$0
5
$152,122
2
$47,010
1
$76,230
0
$0
Aggregated Statistics For Year 2006 (Based on 2 partial tracts)
A) FHA, FSA/RHS & VA Home Purchase Loans
B) Conventional Home Purchase Loans
C) Refinancings
D) Home Improvement Loans
E) Loans on Dwellings For 5+ Families
F) Non-occupant Loans on < 5 Family Dwellings (A B C & D)
G) Loans On Manufactured Home Dwelling (A B C & D)
Number
Average Value
Number
Average Value
Number
Average Value
Number
Average Value
Number
Average Value
Number
Average Value
Number
Average Value
LOANS ORIGINATED
6
$113,640
147
$122,769
119
$121,897
35
$40,656
3
$426,040
19
$90,317
9
$36,232
APPLICATIONS APPROVED, NOT ACCEPTED
0
$0
26
$122,913
25
$102,894
4
$102,910
0
$0
1
$117,730
3
$38,117
APPLICATIONS DENIED
0
$0
27
$99,256
46
$108,711
8
$54,844
1
$79,620
3
$106,723
8
$52,302
APPLICATIONS WITHDRAWN
1
$159,240
8
$121,650
23
$129,480
3
$60,700
0
$0
1
$124,510
2
$40,235
FILES CLOSED FOR INCOMPLETENESS
0
$0
8
$112,439
13
$125,682
3
$117,170
0
$0
1
$93,170
0
$0
Aggregated Statistics For Year 2005 (Based on 2 partial tracts)
A) FHA, FSA/RHS & VA Home Purchase Loans
B) Conventional Home Purchase Loans
C) Refinancings
D) Home Improvement Loans
E) Loans on Dwellings For 5+ Families
F) Non-occupant Loans on < 5 Family Dwellings (A B C & D)
G) Loans On Manufactured Home Dwelling (A B C & D)
Number
Average Value
Number
Average Value
Number
Average Value
Number
Average Value
Number
Average Value
Number
Average Value
Number
Average Value
LOANS ORIGINATED
8
$114,662
123
$106,550
130
$102,826
25
$25,580
1
$47,430
14
$67,941
3
$42,067
APPLICATIONS APPROVED, NOT ACCEPTED
0
$0
15
$139,981
17
$98,451
3
$36,987
0
$0
1
$26,260
3
$38,963
APPLICATIONS DENIED
1
$71,150
29
$111,746
58
$112,052
16
$35,309
0
$0
7
$113,377
11
$39,501
APPLICATIONS WITHDRAWN
2
$96,560
10
$95,965
41
$111,783
5
$58,952
0
$0
1
$18,630
0
$0
FILES CLOSED FOR INCOMPLETENESS
0
$0
7
$90,991
17
$108,914
0
$0
0
$0
0
$0
0
$0
Aggregated Statistics For Year 2004 (Based on 2 partial tracts)
A) FHA, FSA/RHS & VA Home Purchase Loans
B) Conventional Home Purchase Loans
C) Refinancings
D) Home Improvement Loans
F) Non-occupant Loans on < 5 Family Dwellings (A B C & D)
G) Loans On Manufactured Home Dwelling (A B C & D)
Detailed PMIC statistics for the following Tracts:0101.00
2002 - 2018 National Fire Incident Reporting System (NFIRS) incidents
According to the data from the years 2002 - 2018 the average number of fires per year is 8. The highest number of reported fires - 29 took place in 2012, and the least - 0 in 2008. The data has a growing trend.
When looking into fire subcategories, the most reports belonged to: Outside Fires (45.1%), and Mobile Property/Vehicle Fires (34.0%).
Fire incident types reported to NFIRS in Zip Code 50046


+$2,509
-$74
(% of AGI for various income ranges: 0.2% for AGIs $10k-25k, -0.6% for AGIs $25k-50k, 1.1% for AGIs $50k-75k, 1.0% for AGIs over 100k)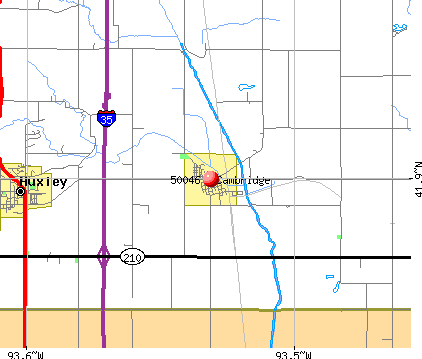 Nearest zip codes: 50124, 50073, 50007, 50161, 50244, 50010.


 According to the data from the years 2002 - 2018 the average number of fires per year is 8. The highest number of reported fires - 29 took place in 2012, and the least - 0 in 2008. The data has a growing trend.
 When looking into fire subcategories, the most reports belonged to: Outside Fires (45.1%), and Mobile Property/Vehicle Fires (34.0%).