Estimated zip code population in 2022: 1,194 Zip code population in 2010: 1,372 Zip code population in 2000: 1,484
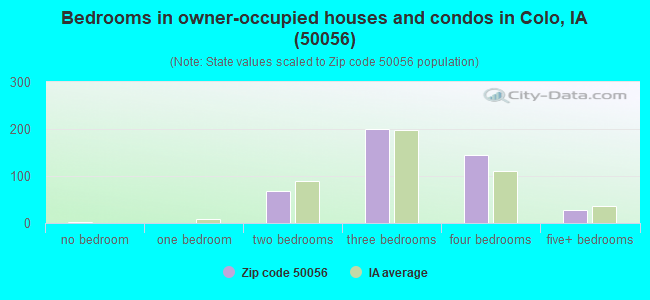
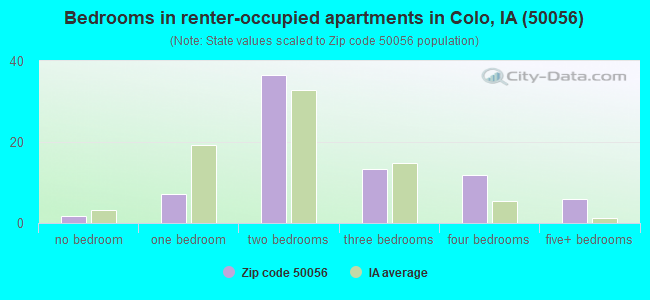
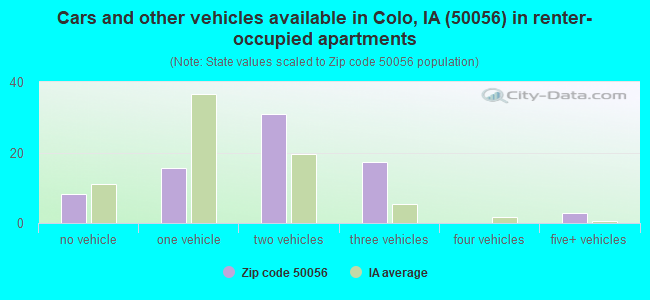
Houses and condos: 524 Renter-occupied apartments: 75
% of renters here:
15%
State:
28%
March 2022 cost of living index in zip code 50056: 83.6 (less than average, U.S. average is 100)
Land area: 57.5 sq. mi. Water area: 0.1 sq. mi.
Population density: 21 people per square mile
(very low).
OSM Map
General Map
Google Map
MSN Map
OSM Map
General Map
Google Map
MSN Map
OSM Map
General Map
Google Map
MSN Map
OSM Map
General Map
Google Map
MSN Map
Please wait while loading the map...
Real estate property taxes paid for housing units in 2022:
This zip code:
1.2% ($2,113)
Iowa:
1.4% ($2,724)
Median real estate property taxes paid for housing units with mortgages in 2022: $2,239 (1.2%) Median real estate property taxes paid for housing units with no mortgage in 2022: $1,823 (1.1%)
Business Search- 14 Million verified businesses
Males: 593
(49.7%)
Females: 600
(50.3%)
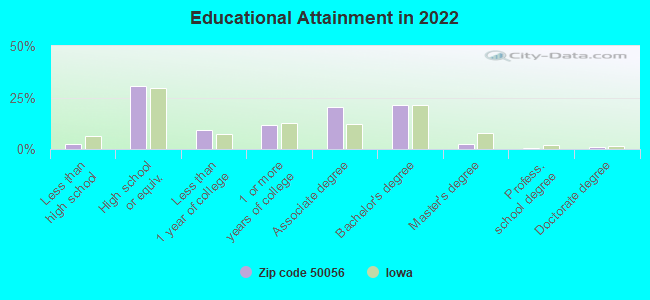
For population 25 years and over in 50056:
High school or higher: 97.2%
Bachelor's degree or higher: 25.4%
Graduate or professional degree: 4.0%
Unemployed: 2.3%
Mean travel time to work (commute): 27.4 minutes
For population 15 years and over in 50056:
Never married: 22.6%
Now married: 60.1%
Separated: 0.0%
Widowed: 6.8%
Divorced: 10.6%
Zip code 50056 compared to state average:
Black race population percentage significantly below state average.
Hispanic race population percentage significantly below state average.
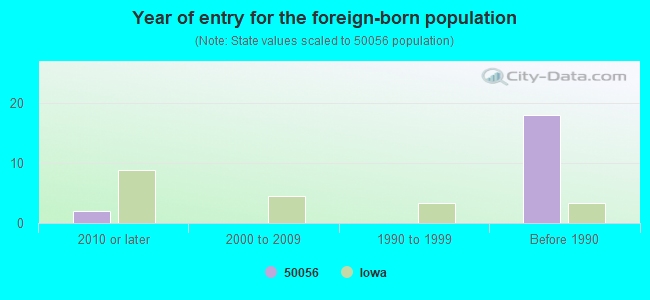
Foreign-born population percentage significantly below state average.
Renting percentage below state average.
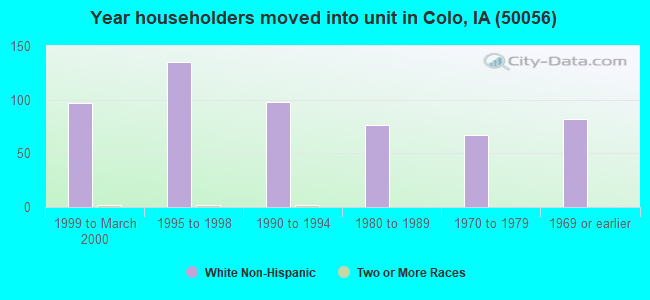
Length of stay since moving in significantly above state average.
Estimated median house/condo value in 2022: $175,311
50056:
$175,311
Iowa:
$194,600
According to our research of Iowa and other state lists, there were 2 registered sex offenders living in 50056 zip code as of May 23, 2024. The ratio of all residents to sex offenders in zip code 50056 is 740 to 1. The ratio of registered sex offenders to all residents in this zip code is lower than the state average.
Median resident age:
This zip code:
40.2 years
Iowa median age:
38.9 years
Average household size:
This zip code:
2.3 people
Iowa:
2.3 people
Averages for the 2020 tax year for zip code 50056, filed in 2021:
Average Adjusted Gross Income (AGI) in 2020: $65,591 (Individual Income Tax Returns)
Here:
$65,591
State:
$71,087
Salary/wage: $54,782 (reported on 85.1% of returns)
Here:
$54,782
State:
$57,361
(% of AGI for various income ranges: 1113.3% for AGIs below $25k, 4083.8% for AGIs $25k-50k, 5951.1% for AGIs $50k-75k, 8801.4% for AGIs $75k-100k, 26128.0% for AGIs $100k-200k)
Taxable interest for individuals: $1,114 (reported on 32.8% of returns)
This zip code:
$1,114
Iowa:
$1,633
(% of AGI for various income ranges: 22.5% for AGIs below $25k, 9.2% for AGIs $25k-50k, 18.9% for AGIs $50k-75k, 70.0% for AGIs $75k-100k, 280.0% for AGIs $100k-200k)
Ordinary dividends: $2,542 (reported on 17.9% of returns)
Here:
$2,542
State:
$5,432
(% of AGI for various income ranges: 34.2% for AGIs below $25k, 21.1% for AGIs $50k-75k, 151.4% for AGIs $75k-100k, 278.0% for AGIs $100k-200k)
Net capital gain/loss in AGI: +$7,867 (reported on 13.4% of returns)
Here:
+$7,867
State:
+$15,243
(% of AGI for various income ranges: 21.5% for AGIs $25k-50k, 214.3% for AGIs $75k-100k, 1060.0% for AGIs $100k-200k)
Profit/loss from business: +$7,322 (reported on 13.4% of returns)
Here:
+$7,322
State:
+$11,763
(% of AGI for various income ranges: 346.7% for AGIs below $25k, 163.3% for AGIs $50k-75k, 192.0% for AGIs $100k-200k)
Taxable individual retirement arrangement distribution: $11,240 (reported on 7.5% of returns)
50056:
$11,240
Iowa:
$17,324
(% of AGI for various income ranges: 137.5% for AGIs below $25k, 441.1% for AGIs $50k-75k)
Total itemized deductions: $33,000 (reported on 3.0% of returns)
Here:
$33,000
State:
$33,775
(% of AGI for various income ranges: 733.3% for AGIs $50k-75k)
Taxes paid: $6,800 (reported on 3.0% of returns)
50056:
$6,800
State:
$7,704
(% of AGI for various income ranges: 151.1% for AGIs $50k-75k)
Earned income credit: $1,900 (reported on 10.4% of returns)
Here:
$1,900
State:
$2,195
(% of AGI for various income ranges: 67.5% for AGIs below $25k, 40.0% for AGIs $25k-50k)
Percentage of individuals using paid preparers for their 2020 taxes: 95.5%
Here:
96%
State:
95%
(% for various income ranges: 94.1% for AGIs below $25k, 94.1% for AGIs $25k-50k, 100.0% for AGIs $50k-75k, 100.0% for AGIs $75k-100k, 91.7% for AGIs $100k-200k)
Averages for the 2012 tax year for zip code 50056, filed in 2013:
Average Adjusted Gross Income (AGI) in 2012: $49,493 (Individual Income Tax Returns)
Here:
$49,493
State:
$58,860
Salary/wage: $44,139 (reported on 80.6% of returns)
Here:
$44,139
State:
$46,659
(% of AGI for various income ranges: 71.8% for AGIs below $25k, 78.8% for AGIs $25k-50k, 77.0% for AGIs $50k-75k, 76.9% for AGIs $75k-100k, 61.3% for AGIs $100k-200k)
Taxable interest for individuals: $1,008 (reported on 35.8% of returns)
This zip code:
$1,008
Iowa:
$1,537
(% of AGI for various income ranges: 0.8% for AGIs below $25k, 1.2% for AGIs $25k-50k, 0.6% for AGIs $50k-75k, 0.5% for AGIs $75k-100k, 0.7% for AGIs $100k-200k)
Ordinary dividends: $2,038 (reported on 19.4% of returns)
Here:
$2,038
State:
$4,542
(% of AGI for various income ranges: 1.9% for AGIs $25k-50k, 1.0% for AGIs $50k-75k, 0.8% for AGIs $100k-200k)
Net capital gain/loss in AGI: +$1,629 (reported on 10.4% of returns)
Here:
+$1,629
State:
+$11,802
(% of AGI for various income ranges: 1.3% for AGIs $100k-200k)
Profit/loss from business: +$6,900 (reported on 13.4% of returns)
Here:
+$6,900
State:
+$10,509
(% of AGI for various income ranges: 5.9% for AGIs below $25k, 3.4% for AGIs $25k-50k, 3.8% for AGIs $75k-100k)
Taxable individual retirement arrangement distribution: $6,129 (reported on 10.4% of returns)
50056:
$6,129
Iowa:
$11,773
Total itemized deductions: $18,183 (23% of AGI, reported on 26.9% of returns)
Here:
$18,183
State:
$21,278
Here:
22.8% of AGI
State:
18.9% of AGI
(% of AGI for various income ranges: 13.2% for AGIs $25k-50k, 9.7% for AGIs $50k-75k, 8.7% for AGIs $75k-100k, 11.3% for AGIs $100k-200k)
Charity contributions: $2,279 (reported on 20.9% of returns)
Here:
$2,279
State:
$4,044
(% of AGI for various income ranges: 0.9% for AGIs $25k-50k, 0.9% for AGIs $50k-75k, 0.8% for AGIs $75k-100k, 1.4% for AGIs $100k-200k)
Taxes paid: $5,944 (reported on 26.9% of returns)
50056:
$5,944
State:
$8,846
(% of AGI for various income ranges: 2.6% for AGIs $25k-50k, 2.4% for AGIs $50k-75k, 3.2% for AGIs $75k-100k, 5.1% for AGIs $100k-200k)
Earned income credit: $2,033 (reported on 13.4% of returns)
Here:
$2,033
State:
$2,098
(% of AGI for various income ranges: 5.3% for AGIs below $25k, 0.7% for AGIs $25k-50k)
Percentage of individuals using paid preparers for their 2012 taxes: 65.7%
Here:
66%
State:
65%
(% for various income ranges: 54.5% for AGIs below $25k, 64.7% for AGIs $25k-50k, 75.0% for AGIs $50k-75k, 75.0% for AGIs $75k-100k, 75.0% for AGIs $100k-200k)
Averages for the 2004 tax year for zip code 50056, filed in 2005:
Average Adjusted Gross Income (AGI) in 2004: $40,833 (Individual Income Tax Returns)
Here:
$40,833
State:
$43,875
Salary/wage: $38,201 (reported on 85.2% of returns)
Here:
$38,201
State:
$38,265
(% of AGI for various income ranges: 148.1% for AGIs below $10k, 72.4% for AGIs $10k-25k, 80.3% for AGIs $25k-50k, 84.1% for AGIs $50k-75k, 81.7% for AGIs $75k-100k, 65.2% for AGIs over 100k)
Taxable interest for individuals: $1,195 (reported on 49.8% of returns)
This zip code:
$1,195
Iowa:
$1,768
(% of AGI for various income ranges: 7.0% for AGIs below $10k, 3.9% for AGIs $10k-25k, 1.9% for AGIs $25k-50k, 0.5% for AGIs $50k-75k, 1.2% for AGIs $75k-100k, 0.8% for AGIs over 100k)
Taxable dividends: $1,331 (reported on 24.2% of returns)
Here:
$1,331
State:
$2,510
(% of AGI for various income ranges: 1.2% for AGIs below $10k, 1.9% for AGIs $10k-25k, 0.8% for AGIs $25k-50k, 0.2% for AGIs $50k-75k, 0.7% for AGIs $75k-100k, 1.2% for AGIs over 100k)
Net capital gain/loss: +$600 (reported on 17.0% of returns)
Here:
+$600
State:
+$6,139
(% of AGI for various income ranges: 3.3% for AGIs below $10k, 0.8% for AGIs $10k-25k, -0.2% for AGIs $25k-50k, 0.1% for AGIs $50k-75k, 0.5% for AGIs $75k-100k, 0.4% for AGIs over 100k)
Profit/loss from business: +$5,450 (reported on 15.4% of returns)
Here:
+$5,450
State:
+$8,574
(% of AGI for various income ranges: -3.7% for AGIs below $10k, 4.1% for AGIs $10k-25k, 4.5% for AGIs $25k-50k, 0.9% for AGIs $50k-75k, 1.7% for AGIs $75k-100k)
Profit/loss from farming: +$4,923 (reported on 4.0% of returns)
Here:
+$4,923
State:
-$74
Total itemized deductions: $14,972 (22% of AGI, reported on 27.5% of returns)
Here:
$14,972
State:
$16,976
Here:
21.7% of AGI
State:
20.8% of AGI
(% of AGI for various income ranges: 9.4% for AGIs $10k-25k, 8.0% for AGIs $25k-50k, 11.1% for AGIs $50k-75k, 12.8% for AGIs $75k-100k, 10.1% for AGIs over 100k)
Charity contributions deductions: $2,079 (3% of AGI, reported on 23.3% of returns)
Here:
$2,079
State:
$3,089
Here:
2.9% of AGI
State:
3.6% of AGI
(% of AGI for various income ranges: 1.1% for AGIs $10k-25k, 0.6% for AGIs $25k-50k, 1.3% for AGIs $50k-75k, 1.7% for AGIs $75k-100k, 1.4% for AGIs over 100k)
Total tax: $4,097 (reported on 80.9% of returns)
50056:
$4,097
State:
$6,177
(% of AGI for various income ranges: 2.3% for AGIs below $10k, 4.6% for AGIs $10k-25k, 6.6% for AGIs $25k-50k, 8.4% for AGIs $50k-75k, 9.0% for AGIs $75k-100k, 11.7% for AGIs over 100k)
Earned income credit: $1,422 (reported on 9.9% of returns)
Here:
$1,422
State:
$1,540
Percentage of individuals using paid preparers for their 2004 taxes: 73.6%
Here:
74%
State:
70%
(% for various income ranges: 67.2% for AGIs below $10k, 70.7% for AGIs $10k-25k, 76.2% for AGIs $25k-50k, 75.8% for AGIs $50k-75k, 73.6% for AGIs $75k-100k, 88.5% for AGIs over 100k)
Household received Food Stamps/SNAP in the past 12 months: 19 Household did not receive Food Stamps/SNAP in the past 12 months: 499
Women who had a birth in the past 12 months: 19 (19 now married, 0 unmarried) Women who did not have a birth in the past 12 months: 218 (115 now married, 102 unmarried)
Housing units in zip code 50056 with a mortgage: 299 (19 second mortgage, 14 both second mortgage and home equity loan) Houses without a mortgage: 3
Median monthly owner costs for units with a mortgage: $1,353 Median monthly owner costs for units without a mortgage: $486
Residents with income below the poverty level in 2022:
This zip code:
3.9%
Whole state:
11.0%
Residents with income below 50% of the poverty level in 2022:
This zip code:
0.9%
Whole state:
5.5%
Median number of rooms in houses and condos:
Here:
7.5
State:
6.8
Median number of rooms in apartments:
Here:
5.5
State:
4.2
Notable locations in this zip code not listed on our city pages
Notable locations in zip code 50056: Twin Anchors Campground (A), Colo (B), Colo Fire and Rescue (C), Sherman Townhall (D). Display/hide their locations on the map
Size of family households: 165 2-persons, 75 3-persons, 54 4-persons, 8 5-persons, 12 6-persons, 13 7-or-more-persons
Size of nonfamily households: 144 1-person, 35 2-persons, 7 3-persons
261 married couples with children.
36 single-parent households (5 men, 31 women).
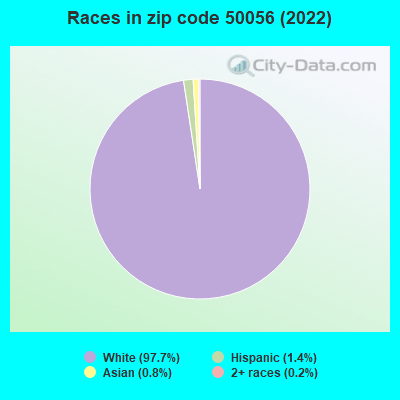
97.2% of residents of 50056 zip code speak English at home.
1.7% of residents speak Spanish at home (85% very well, 15% well).
0.7% of residents speak Asian or Pacific Island language at home (88% very well, 12% well).
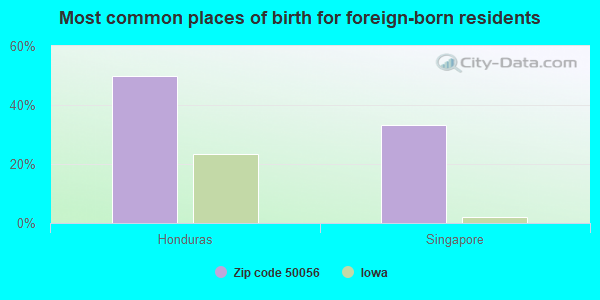
Foreign born population: 6 (0.5%) (100.0% of them are naturalized citizens)
This zip code:
0.5%
Whole state:
6.0%
50%Honduras
33%Singapore
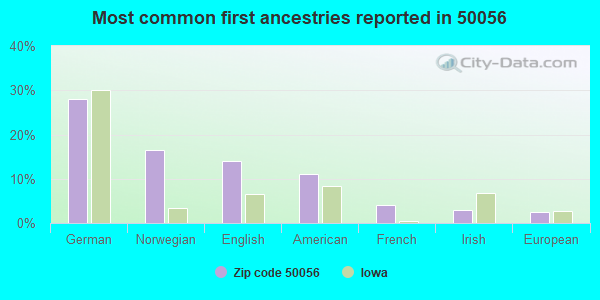
28%German
16%Norwegian
14%English
11%American
4%French
3%Irish
2%European
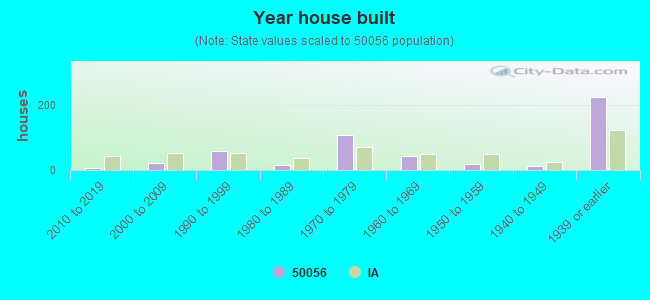
Year of entry for the foreign-born population
22010 or later
02000 to 2009
01990 to 1999
18Before 1990
Facilities with environmental interests located in this zip code:
COLO-NESCO SENIOR HIGH SCHOOL (919 WEST ST in COLO, IA)
(Geographic Names Information System) (National Center for Education Statistics) - STATE ID-851359 172 Organizations: COLO-NESCO COMM SCHOOL DISTRICT (SCHOOL DISTRICT)
COLO ELEMENTARY SCHOOL (919 WEST ST in COLO, IA)
(National Center for Education Statistics) - STATE ID-851359 409 Organizations: COLO-NESCO COMM SCHOOL DISTRICT (SCHOOL DISTRICT)
COLO CITY OF STP (0.5 MILE SOUTH OF RAY STREET & in COLO, IA)
National Pollutant Discharge Elimination System NON-MAJOR (Tracking pollutant discharge elimination systems) - permit Business SIC classification: SEWERAGE SYSTEMS Organizations: CITY OF COLO (CONTACT/OWNER)
TWIN ANCHORS CAMPGROUND STP (68132 US HIGHWAY 30 in COLO, IA)
National Pollutant Discharge Elimination System NON-MAJOR (Tracking pollutant discharge elimination systems) - permit Business SIC classification: RECREATIONAL VEHICLE PARKS AND CAMPSITES Organizations: JOHN ANGELL (CONTACT/OWNER)
HEARTLAND CO-OP COLO (417 2ND STREET in COLO, IA)
AIR MINOR (AIRS/AFS) COMPLIANCE ACTIVITY (Tracking inspections of insecticide, fungicide, and rodenticide, and toxic substances) Business SIC classification: GRAIN AND FIELD BEANS Alternative names: COLO FRS GRAIN COOP, FARMERS COOPERATIVE EXCHANGE, FARMERS COOPERATIVE EXCHANGE COLO NH3, FARMERS GRAIN COOP-COLO, HEARTLAND COOP
BOBS PAINT & REPAIR (605 PARK in COLO, IA)
Conditionally Exempt Small Quantity Generators, less than 100 kg/month of hazardous waste (Resource Conservation and Recovery Act (tracking hazardous waste)) Business NAICS classification: AUTOMOTIVE BODY, PAINT, AND INTERIOR REPAIR AND MAINTENANCE.
COLO-NESCO COMMUNITY ELEMENTARY SCHOOL (919 WEST STREET in COLO, IA)
COMPLIANCE ACTIVITY (Tracking inspections of insecticide, fungicide, and rodenticide, and toxic substances) Alternative names: COCO-NESCO C S D
Housing units lacking complete plumbing facilities: 0.5% Housing units lacking complete kitchen facilities: 3.0%
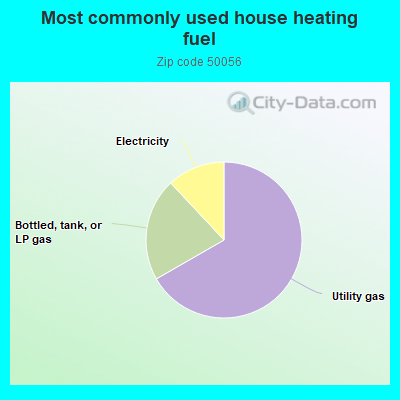
66.9%Utility gas
21.4%Bottled, tank, or LP gas
12.0%Electricity
Population in 1990: 1,293. Population change in the 1990s: +191 (+14.8%).
Place of birth for U.S.-born residents:
This state: 1,044
Northeast: 3
Midwest: 52
South: 27
West: 44
62% of the 50056 zip code residents lived in the same house 5 years ago. Out of people who lived in different houses, 70% lived in this county. Out of people who lived in different counties, 50% lived in Iowa.
89% of the 50056 zip code residents lived in the same house 1 year ago. Out of people who lived in different houses, 72% moved from this county. Out of people who lived in different houses, 12% moved from different county within same state. Out of people who lived in different houses, 10% moved from different state. Out of people who lived in different houses, 2% moved from abroad.
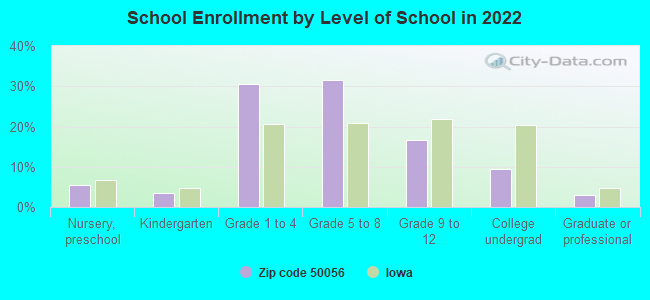
Private vs. public school enrollment:
Students in private schools in grades 1 to 8 (elementary and middle school): 51
Here:
27.7%
Iowa:
10.6%
Students in private schools in grades 9 to 12 (high school): 12
Here:
24.1%
Iowa:
7.9%
Students in private undergraduate colleges:
Here:
0.0%
Iowa:
23.9%
Occupation by median earnings in the past 12 months ($)
101,828Management occupations
88,663Business and financial operations occupations
86,040Architecture and engineering occupations
85,431Computer and mathematical occupations
72,059Transportation occupations
63,814Installation, maintenance, and repair occupations
Top industries in this zip code by the number of employees in 2005:
Wholesale Trade: Grain and Field Bean Merchant Wholesalers (10-19: 1)
Wholesale Trade: Farm and Garden Machinery and Equipment Merchant Wholesalers (5-9: 1)
Wholesale Trade: Meat and Meat Product Merchant Wholesalers (5-9: 1)
Other Services (except Public Administration): Commercial and Industrial Machinery and Equipment (except Automotive and Electronic) Repair and Maintenance (1-4: 1)
Construction: Plumbing, Heating, and Air-Conditioning Contractors (1-4: 1)
Home Mortgage Disclosure Act Aggregated Statistics For Year 2009 (Based on 4 partial tracts)
A) FHA, FSA/RHS & VA Home Purchase Loans
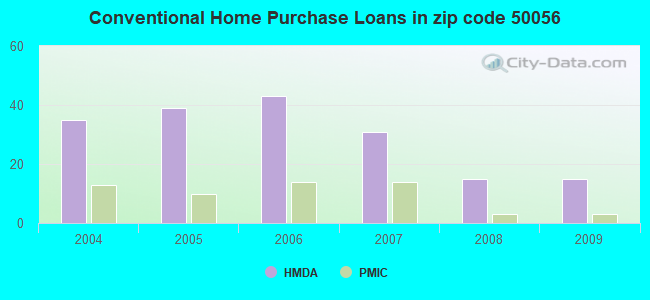
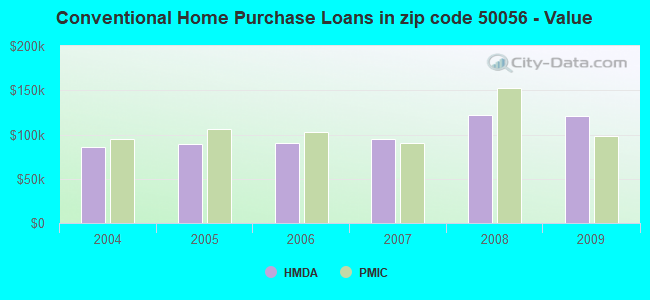
B) Conventional Home Purchase Loans
C) Refinancings
D) Home Improvement Loans
E) Loans on Dwellings For 5+ Families
F) Non-occupant Loans on < 5 Family Dwellings (A B C & D)
G) Loans On Manufactured Home Dwelling (A B C & D)
Number
Average Value
Number
Average Value
Number
Average Value
Number
Average Value
Number
Average Value
Number
Average Value
Number
Average Value
LOANS ORIGINATED
13
$101,012
15
$120,360
69
$125,219
9
$38,912
1
$156,860
3
$58,537
1
$42,750
APPLICATIONS APPROVED, NOT ACCEPTED
1
$101,200
2
$183,215
7
$162,721
0
$0
0
$0
1
$10,820
0
$0
APPLICATIONS DENIED
2
$104,160
4
$66,362
20
$135,216
3
$55,123
0
$0
0
$0
1
$28,680
APPLICATIONS WITHDRAWN
1
$147,210
2
$94,355
16
$119,670
1
$33,010
0
$0
0
$0
1
$40,050
FILES CLOSED FOR INCOMPLETENESS
0
$0
0
$0
2
$107,970
0
$0
0
$0
0
$0
0
$0
Aggregated Statistics For Year 2008 (Based on 4 partial tracts)
A) FHA, FSA/RHS & VA Home Purchase Loans
B) Conventional Home Purchase Loans
C) Refinancings
D) Home Improvement Loans
F) Non-occupant Loans on < 5 Family Dwellings (A B C & D)
G) Loans On Manufactured Home Dwelling (A B C & D)
Number
Average Value
Number
Average Value
Number
Average Value
Number
Average Value
Number
Average Value
Number
Average Value
LOANS ORIGINATED
9
$109,634
15
$121,649
44
$101,622
10
$40,293
5
$32,932
1
$61,160
APPLICATIONS APPROVED, NOT ACCEPTED
0
$0
1
$168,390
4
$67,415
1
$71,440
0
$0
1
$28,140
APPLICATIONS DENIED
2
$102,015
5
$59,100
22
$123,958
3
$83,343
1
$67,110
3
$16,237
APPLICATIONS WITHDRAWN
0
$0
4
$179,812
11
$125,166
1
$106,150
1
$90,380
0
$0
FILES CLOSED FOR INCOMPLETENESS
0
$0
0
$0
1
$78,670
0
$0
0
$0
0
$0
Aggregated Statistics For Year 2007 (Based on 4 partial tracts)
A) FHA, FSA/RHS & VA Home Purchase Loans
B) Conventional Home Purchase Loans
C) Refinancings
D) Home Improvement Loans
F) Non-occupant Loans on < 5 Family Dwellings (A B C & D)
G) Loans On Manufactured Home Dwelling (A B C & D)
Number
Average Value
Number
Average Value
Number
Average Value
Number
Average Value
Number
Average Value
Number
Average Value
LOANS ORIGINATED
5
$120,456
31
$94,398
43
$85,677
12
$43,523
6
$75,612
1
$111,490
APPLICATIONS APPROVED, NOT ACCEPTED
0
$0
2
$84,970
10
$96,096
2
$36,800
0
$0
1
$48,170
APPLICATIONS DENIED
1
$75,770
6
$74,928
38
$111,147
14
$69,251
1
$75,770
3
$77,390
APPLICATIONS WITHDRAWN
0
$0
0
$0
13
$123,025
1
$62,240
0
$0
1
$11,180
FILES CLOSED FOR INCOMPLETENESS
0
$0
1
$154,450
4
$128,602
0
$0
0
$0
0
$0
Aggregated Statistics For Year 2006 (Based on 4 partial tracts)
A) FHA, FSA/RHS & VA Home Purchase Loans
B) Conventional Home Purchase Loans
C) Refinancings
D) Home Improvement Loans
F) Non-occupant Loans on < 5 Family Dwellings (A B C & D)
G) Loans On Manufactured Home Dwelling (A B C & D)
Number
Average Value
Number
Average Value
Number
Average Value
Number
Average Value
Number
Average Value
Number
Average Value
LOANS ORIGINATED
5
$90,886
43
$90,159
48
$102,854
9
$33,699
4
$70,240
2
$89,445
APPLICATIONS APPROVED, NOT ACCEPTED
1
$59,200
6
$87,362
11
$81,610
1
$35,180
1
$59,320
1
$45,460
APPLICATIONS DENIED
1
$60,010
11
$68,535
34
$83,075
7
$41,401
2
$40,880
2
$10,115
APPLICATIONS WITHDRAWN
0
$0
3
$74,523
20
$96,484
2
$112,715
1
$77,930
1
$46,540
FILES CLOSED FOR INCOMPLETENESS
0
$0
2
$78,205
11
$103,583
0
$0
0
$0
0
$0
Aggregated Statistics For Year 2005 (Based on 4 partial tracts)
A) FHA, FSA/RHS & VA Home Purchase Loans
B) Conventional Home Purchase Loans
C) Refinancings
D) Home Improvement Loans
F) Non-occupant Loans on < 5 Family Dwellings (A B C & D)
G) Loans On Manufactured Home Dwelling (A B C & D)
Number
Average Value
Number
Average Value
Number
Average Value
Number
Average Value
Number
Average Value
Number
Average Value
LOANS ORIGINATED
2
$96,590
39
$89,614
72
$89,826
14
$26,908
9
$45,389
2
$48,435
APPLICATIONS APPROVED, NOT ACCEPTED
0
$0
2
$130,635
10
$90,278
2
$43,025
0
$0
0
$0
APPLICATIONS DENIED
0
$0
12
$69,886
41
$92,685
12
$33,327
1
$36,450
4
$33,095
APPLICATIONS WITHDRAWN
1
$74,020
5
$79,022
20
$97,466
2
$61,455
1
$10,820
1
$27,720
FILES CLOSED FOR INCOMPLETENESS
1
$17,320
2
$82,500
11
$126,306
1
$46,210
1
$32,470
0
$0
Aggregated Statistics For Year 2004 (Based on 4 partial tracts)
A) FHA, FSA/RHS & VA Home Purchase Loans
B) Conventional Home Purchase Loans
C) Refinancings
D) Home Improvement Loans
E) Loans on Dwellings For 5+ Families
F) Non-occupant Loans on < 5 Family Dwellings (A B C & D)
G) Loans On Manufactured Home Dwelling (A B C & D)


+$4,923
-$74
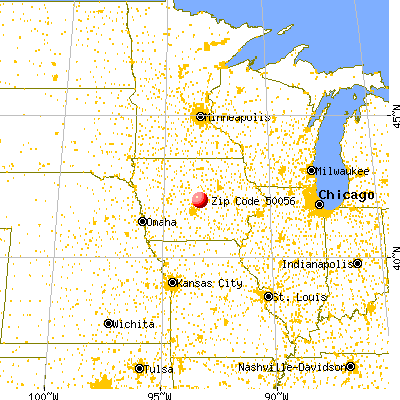
 Nearest zip codes: 50278, 50247, 50055, 50201, 50239, 50234.