Estimated zip code population in 2022: 1,186 Zip code population in 2010: 1,039 Zip code population in 2000: 1,160
Houses and condos: 527 Renter-occupied apartments: 46
% of renters here:
9%
State:
28%
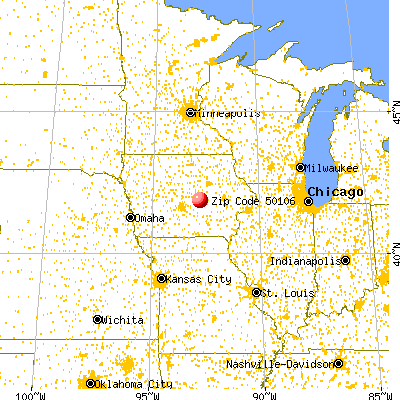
March 2022 cost of living index in zip code 50106: 81.0 (low, U.S. average is 100)
Land area: 65.7 sq. mi. Water area: 0.0 sq. mi.
Population density: 18 people per square mile
(very low).
OSM Map
General Map
Google Map
MSN Map
OSM Map
General Map
Google Map
MSN Map
OSM Map
General Map
Google Map
MSN Map
OSM Map
General Map
Google Map
MSN Map
Please wait while loading the map...
Real estate property taxes paid for housing units in 2022:
This zip code:
1.2% ($1,353)
Iowa:
1.4% ($2,724)
Median real estate property taxes paid for housing units with mortgages in 2022: $1,333 (1.0%) Median real estate property taxes paid for housing units with no mortgage in 2022: $1,409 (1.5%)
Business Search- 14 Million verified businesses
Males: 596
(50.3%)
Females: 589
(49.7%)
For population 25 years and over in 50106:
High school or higher: 92.6%
Bachelor's degree or higher: 21.7%
Graduate or professional degree: 8.0%
Unemployed: 3.0%
Mean travel time to work (commute): 23.6 minutes
For population 15 years and over in 50106:
Never married: 22.5%
Now married: 58.5%
Separated: 2.1%
Widowed: 3.6%
Divorced: 13.3%
Zip code 50106 compared to state average:
Median house value below state average.
Black race population percentage significantly below state average.
Hispanic race population percentage below state average.
Foreign-born population percentage significantly below state average.
Renting percentage significantly below state average.
Length of stay since moving in significantly above state average.
House age above state average.
Number of college students significantly below state average.
Percentage of population with a bachelor's degree or higher below state average.
Estimated median house/condo value in 2022: $115,195
50106:
$115,195
Iowa:
$194,600
According to our research of Iowa and other state lists, there were 2 registered sex offenders living in 50106 zip code as of June 07, 2024. The ratio of all residents to sex offenders in zip code 50106 is 540 to 1. The ratio of registered sex offenders to all residents in this zip code is near the state average.
Median resident age:
This zip code:
42.6 years
Iowa median age:
38.9 years
Average household size:
This zip code:
2.3 people
Iowa:
2.3 people
Averages for the 2020 tax year for zip code 50106, filed in 2021:
Average Adjusted Gross Income (AGI) in 2020: $55,690 (Individual Income Tax Returns)
Here:
$55,690
State:
$71,087
Salary/wage: $44,562 (reported on 80.8% of returns)
Here:
$44,562
State:
$57,361
(% of AGI for various income ranges: 1410.0% for AGIs below $25k, 3863.3% for AGIs $25k-50k, 6964.0% for AGIs $50k-75k, 12563.3% for AGIs $75k-100k, 13438.0% for AGIs $100k-200k)
Taxable interest for individuals: $1,553 (reported on 32.7% of returns)
This zip code:
$1,553
Iowa:
$1,633
(% of AGI for various income ranges: 10.0% for AGIs below $25k, 60.0% for AGIs $25k-50k, 138.0% for AGIs $50k-75k, 150.0% for AGIs $75k-100k, 174.0% for AGIs $100k-200k)
Ordinary dividends: $1,611 (reported on 17.3% of returns)
Here:
$1,611
State:
$5,432
(% of AGI for various income ranges: 42.2% for AGIs $25k-50k, 58.0% for AGIs $50k-75k, 156.0% for AGIs $100k-200k)
Net capital gain/loss in AGI: +$7,456 (reported on 17.3% of returns)
Here:
+$7,456
State:
+$15,243
(% of AGI for various income ranges: 21.1% for AGIs below $25k, 176.0% for AGIs $50k-75k, 1128.0% for AGIs $100k-200k)
Profit/loss from business: +$4,660 (reported on 9.6% of returns)
Here:
+$4,660
State:
+$11,763
(% of AGI for various income ranges: 152.2% for AGIs $25k-50k, 320.0% for AGIs $75k-100k)
Taxable individual retirement arrangement distribution: $12,860 (reported on 9.6% of returns)
50106:
$12,860
Iowa:
$17,324
(% of AGI for various income ranges: 394.4% for AGIs $25k-50k, 960.0% for AGIs $75k-100k)
Earned income credit: $2,017 (reported on 11.5% of returns)
Here:
$2,017
State:
$2,195
(% of AGI for various income ranges: 80.0% for AGIs below $25k, 54.4% for AGIs $25k-50k)
Percentage of individuals using paid preparers for their 2020 taxes: 92.3%
Here:
92%
State:
95%
(% for various income ranges: 93.3% for AGIs below $25k, 85.7% for AGIs $25k-50k, 100.0% for AGIs $50k-75k, 83.3% for AGIs $75k-100k, 100.0% for AGIs $100k-200k)
Averages for the 2012 tax year for zip code 50106, filed in 2013:
Average Adjusted Gross Income (AGI) in 2012: $51,506 (Individual Income Tax Returns)
Here:
$51,506
State:
$58,860
Salary/wage: $35,956 (reported on 82.7% of returns)
Here:
$35,956
State:
$46,659
(% of AGI for various income ranges: 69.7% for AGIs below $25k, 76.6% for AGIs $25k-50k, 69.3% for AGIs $50k-75k, 69.2% for AGIs $75k-100k, 29.0% for AGIs $100k-200k)
Taxable interest for individuals: $1,665 (reported on 38.5% of returns)
This zip code:
$1,665
Iowa:
$1,537
(% of AGI for various income ranges: 1.6% for AGIs below $25k, 0.3% for AGIs $25k-50k, 1.7% for AGIs $50k-75k, 0.3% for AGIs $75k-100k, 1.9% for AGIs $100k-200k)
Ordinary dividends: $1,844 (reported on 17.3% of returns)
Here:
$1,844
State:
$4,542
(% of AGI for various income ranges: 0.7% for AGIs $25k-50k, 1.4% for AGIs $50k-75k, 0.5% for AGIs $100k-200k)
Net capital gain/loss in AGI: +$2,614 (reported on 13.5% of returns)
Here:
+$2,614
State:
+$11,802
Profit/loss from business: +$5,286 (reported on 13.5% of returns)
Here:
+$5,286
State:
+$10,509
(% of AGI for various income ranges: 3.4% for AGIs below $25k, 3.5% for AGIs $25k-50k, 2.0% for AGIs $50k-75k)
Taxable individual retirement arrangement distribution: $8,567 (reported on 11.5% of returns)
50106:
$8,567
Iowa:
$11,773
Total itemized deductions: $16,573 (19% of AGI, reported on 21.2% of returns)
Here:
$16,573
State:
$21,278
Here:
18.5% of AGI
State:
18.9% of AGI
(% of AGI for various income ranges: 8.1% for AGIs $25k-50k, 12.9% for AGIs $50k-75k, 6.7% for AGIs $100k-200k)
Charity contributions: $2,062 (reported on 15.4% of returns)
Here:
$2,062
State:
$4,044
(% of AGI for various income ranges: 1.4% for AGIs below $25k, 1.0% for AGIs $50k-75k, 0.8% for AGIs $100k-200k)
Taxes paid: $6,455 (reported on 21.2% of returns)
50106:
$6,455
State:
$8,846
(% of AGI for various income ranges: 1.7% for AGIs $25k-50k, 4.6% for AGIs $50k-75k, 3.8% for AGIs $100k-200k)
Earned income credit: $1,975 (reported on 15.4% of returns)
Here:
$1,975
State:
$2,098
(% of AGI for various income ranges: 5.6% for AGIs below $25k, 1.1% for AGIs $25k-50k)
Percentage of individuals using paid preparers for their 2012 taxes: 78.8%
Here:
79%
State:
65%
(% for various income ranges: 70.6% for AGIs below $25k, 76.9% for AGIs $25k-50k, 81.8% for AGIs $50k-75k, 83.3% for AGIs $75k-100k, 100.0% for AGIs $100k-200k)
Averages for the 2004 tax year for zip code 50106, filed in 2005:
Average Adjusted Gross Income (AGI) in 2004: $36,686 (Individual Income Tax Returns)
Here:
$36,686
State:
$43,875
Salary/wage: $32,321 (reported on 84.0% of returns)
Here:
$32,321
State:
$38,265
(% of AGI for various income ranges: 104.2% for AGIs below $10k, 62.8% for AGIs $10k-25k, 74.2% for AGIs $25k-50k, 81.4% for AGIs $50k-75k, 77.0% for AGIs $75k-100k, 57.6% for AGIs over 100k)
Taxable interest for individuals: $1,291 (reported on 49.2% of returns)
This zip code:
$1,291
Iowa:
$1,768
(% of AGI for various income ranges: 9.4% for AGIs below $10k, 3.5% for AGIs $10k-25k, 1.7% for AGIs $25k-50k, 0.8% for AGIs $50k-75k, 1.3% for AGIs $75k-100k, 1.5% for AGIs over 100k)
Taxable dividends: $1,177 (reported on 25.9% of returns)
Here:
$1,177
State:
$2,510
(% of AGI for various income ranges: 1.8% for AGIs below $10k, 0.4% for AGIs $10k-25k, 1.7% for AGIs $25k-50k, 0.6% for AGIs $50k-75k, 0.3% for AGIs $75k-100k)
Net capital gain/loss: +$2,240 (reported on 18.3% of returns)
Here:
+$2,240
State:
+$6,139
(% of AGI for various income ranges: 0.8% for AGIs $10k-25k, 2.5% for AGIs $25k-50k, 0.8% for AGIs $50k-75k, 0.2% for AGIs $75k-100k)
Profit/loss from business: +$5,318 (reported on 16.1% of returns)
Here:
+$5,318
State:
+$8,574
Profit/loss from farming: +$2,241 (reported on 10.6% of returns)
Here:
+$2,241
State:
-$74
IRA payment deduction: $3,077 (reported on 2.4% of returns)
50106:
$3,077
Iowa:
$2,970
Total itemized deductions: $13,418 (22% of AGI, reported on 18.0% of returns)
Here:
$13,418
State:
$16,976
Here:
22.4% of AGI
State:
20.8% of AGI
(% of AGI for various income ranges: 10.7% for AGIs $10k-25k, 5.3% for AGIs $25k-50k, 4.3% for AGIs $50k-75k, 7.9% for AGIs $75k-100k, 11.4% for AGIs over 100k)
Charity contributions deductions: $2,024 (4% of AGI, reported on 15.0% of returns)
Here:
$2,024
State:
$3,089
Here:
3.6% of AGI
State:
3.6% of AGI
(% of AGI for various income ranges: 0.9% for AGIs $10k-25k, 0.5% for AGIs $25k-50k, 0.6% for AGIs $50k-75k, 3.1% for AGIs $75k-100k)
Total tax: $4,057 (reported on 80.6% of returns)
50106:
$4,057
State:
$6,177
(% of AGI for various income ranges: 4.7% for AGIs below $10k, 4.6% for AGIs $10k-25k, 7.0% for AGIs $25k-50k, 8.8% for AGIs $50k-75k, 10.6% for AGIs $75k-100k, 17.7% for AGIs over 100k)
Earned income credit: $1,565 (reported on 12.7% of returns)
Here:
$1,565
State:
$1,540
Percentage of individuals using paid preparers for their 2004 taxes: 81.3%
Here:
81%
State:
70%
(% for various income ranges: 68.5% for AGIs below $10k, 82.7% for AGIs $10k-25k, 83.8% for AGIs $25k-50k, 84.3% for AGIs $50k-75k, 83.3% for AGIs $75k-100k, 93.3% for AGIs over 100k)
Likely homosexual households (counted as self-reported same-sex unmarried-partner households)
Lesbian couples: 0.3% of all households
Gay men: 0.0% of all households
Household received Food Stamps/SNAP in the past 12 months: 31 Household did not receive Food Stamps/SNAP in the past 12 months: 472
Women who had a birth in the past 12 months: 24 (15 now married, 8 unmarried) Women who did not have a birth in the past 12 months: 230 (124 now married, 106 unmarried)
Housing units in zip code 50106 with a mortgage: 264 (17 second mortgage, 14 both second mortgage and home equity loan) Median monthly owner costs for units with a mortgage: $1,160 Median monthly owner costs for units without a mortgage: $505
Residents with income below the poverty level in 2022:
This zip code:
6.9%
Whole state:
11.0%
Residents with income below 50% of the poverty level in 2022:
This zip code:
2.1%
Whole state:
5.5%
Median number of rooms in houses and condos:
Here:
6.9
State:
6.8
Median number of rooms in apartments:
Here:
4.2
State:
4.2
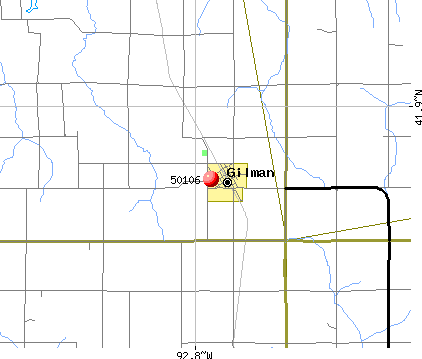
Notable locations in this zip code not listed on our city pages
Notable locations in zip code 50106: Gilman Waterworks (A), Pickering (B), Gilman Fire Department (C), Gilman Town Hall (D), Gilman Public Library (E). Display/hide their locations on the map
Churches in zip code 50106 include: Strand Lutheran Church (A), Gilman United Methodist Church (B), Gilman Community Church (C). Display/hide their locations on the map
Size of family households: 155 2-persons, 89 3-persons, 38 4-persons, 34 5-persons, 4 6-persons, 15 7-or-more-persons
Size of nonfamily households: 142 1-person, 20 2-persons, 2 4-persons
219 married couples with children.
89 single-parent households (37 men, 52 women).
91.7% of residents of 50106 zip code speak English at home.
0.5% of residents speak Spanish at home (100% very well).
10.4% of residents speak other Indo-European language at home (33% very well, 67% well).
Foreign born population: 0 (0.0%)
:
0.0%
Whole state:
6.0%
39%American
17%German
15%European
10%English
7%Norwegian
3%Irish
1%French
Year of entry for the foreign-born population
02010 or later
02000 to 2009
01990 to 1999
2Before 1990
Facilities with environmental interests located in this zip code:
BARKER ENTERPRISES & SALVAGE (121 SOUTH MILL STREET in GILMAN, IA)
AIR MINOR (AIRS/AFS) (Integrated Compliance Information System) - ICIS-07-2000-0142, FORMAL ENFORCEMENT ACTION COMPLIANCE ACTIVITY (Tracking inspections of insecticide, fungicide, and rodenticide, and toxic substances) Business SIC classification: SCRAP AND WASTE MATERIALS
EAST MARSHALL MIDDLE SCHOOL (225 S ELM in GILMAN, IA)
(Geographic Names Information System) (National Center for Education Statistics) - STATE ID-641968 209 Organizations: EAST MARSHALL COMM SCHOOL DISTRICT (SCHOOL DISTRICT)
CENTRAL COUNTIES COOPERATIVE (3111 290TH STREET in GILMAN, IA)
AIR MINOR (AIRS/AFS) Business SIC classification: FARM PRODUCT WAREHOUSING AND STORAGE; GRAIN AND FIELD BEANS Alternative names: CENTRAL COUNTIES COOPERATIVE PICKERING NH3
AT&T (2973 310TH ST in GILMAN, IA)
(Resource Conservation and Recovery Act (tracking hazardous waste))
CENTRAL COUNTIES COOP (102 SOUTH MAIN STREET in GILMAN, IA)
AIR MINOR (AIRS/AFS) Business SIC classification: FARM PRODUCT WAREHOUSING AND STORAGE; GRAIN AND FIELD BEANS Alternative names: CENTRAL COUNTIES COOPERATIVE GILMAN NH3
SEMCO C S D (HWY 146 in GILMAN, IA)
COMPLIANCE ACTIVITY (Tracking inspections of insecticide, fungicide, and rodenticide, and toxic substances)
EAST MARSHALL CSD (225 S ELEM in GILMAN, IA)
COMPLIANCE ACTIVITY (Tracking inspections of insecticide, fungicide, and rodenticide, and toxic substances)
Housing units lacking complete plumbing facilities: 1.0% Housing units lacking complete kitchen facilities: 3.0%
82.6%Bottled, tank, or LP gas
16.4%Electricity
1.2%Utility gas
Population in 1990: 1,221.
Place of birth for U.S.-born residents:
This state: 914
Northeast: 5
Midwest: 91
South: 121
West: 48
70% of the 50106 zip code residents lived in the same house 5 years ago. Out of people who lived in different houses, 59% lived in this county. Out of people who lived in different counties, 50% lived in Iowa.
94% of the 50106 zip code residents lived in the same house 1 year ago. Out of people who lived in different houses, 57% moved from this county. Out of people who lived in different houses, 48% moved from different county within same state.
Private vs. public school enrollment:
Students in private schools in grades 1 to 8 (elementary and middle school): 28
Here:
19.2%
Iowa:
10.6%
Students in private schools in grades 9 to 12 (high school): 2
Here:
4.5%
Iowa:
7.9%
Students in private undergraduate colleges: 4
Here:
37.5%
Iowa:
23.9%
Occupation by median earnings in the past 12 months ($)
107,744Sales and related occupations
69,091Production occupations
59,138Construction and extraction occupations
54,267Management occupations
45,684Material moving occupations
44,989Building and grounds cleaning and maintenance occupations
Top industries in this zip code by the number of employees in 2005:
Wholesale Trade: Grain and Field Bean Merchant Wholesalers (10-19 employees: 1 establishment, 1-4 employees: 1 establishment)
Finance and Insurance: Commercial Banking (10-19: 1)
Accommodation and Food Services: Drinking Places (Alcoholic Beverages) (1-4: 1)
Construction: Site Preparation Contractors (1-4: 1)
Professional, Scientific, and Technical Services: Veterinary Services (1-4: 1)
2003 - 2018 National Fire Incident Reporting System (NFIRS) incidents
According to the data from the years 2003 - 2018 the average number of fires per year is 7. The highest number of fires - 21 took place in 2017, and the least - 1 in 2006. The data has a decreasing trend.
When looking into fire subcategories, the most incidents belonged to: Outside Fires (56.0%), and Structure Fires (37.9%).
Fire incident types reported to NFIRS in Zip Code 50106


+$2,241
-$74
 Nearest zip codes: 50078, 50173, 50142, 50141, 50135, 50112.


 According to the data from the years 2003 - 2018 the average number of fires per year is 7. The highest number of fires - 21 took place in 2017, and the least - 1 in 2006. The data has a decreasing trend.
 When looking into fire subcategories, the most incidents belonged to: Outside Fires (56.0%), and Structure Fires (37.9%).