Estimated zip code population in 2022: 834 Zip code population in 2010: 842 Zip code population in 2000: 721
Houses and condos: 428 Renter-occupied apartments: 53
% of renters here:
15%
State:
28%
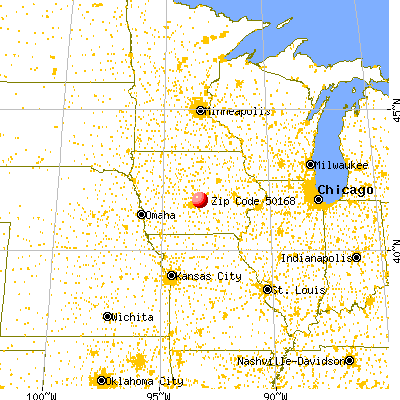
March 2022 cost of living index in zip code 50168: 83.3 (low, U.S. average is 100)
Land area: 40.4 sq. mi. Water area: 0.0 sq. mi.
Population density: 21 people per square mile
(very low).
OSM Map
General Map
Google Map
MSN Map
OSM Map
General Map
Google Map
MSN Map
OSM Map
General Map
Google Map
MSN Map
OSM Map
General Map
Google Map
MSN Map
Please wait while loading the map...
Real estate property taxes paid for housing units in 2022:
This zip code:
1.3% ($3,214)
Iowa:
1.4% ($2,724)
Median real estate property taxes paid for housing units with mortgages in 2022: $3,628 (1.3%) Median real estate property taxes paid for housing units with no mortgage in 2022: $1,677 (1.0%)
Business Search- 14 Million verified businesses
Males: 360
(43.2%)
Females: 473
(56.8%)
For population 25 years and over in 50168:
High school or higher: 96.8%
Bachelor's degree or higher: 26.0%
Graduate or professional degree: 4.2%
Unemployed: 1.7%
Mean travel time to work (commute): 29.3 minutes
For population 15 years and over in 50168:
Never married: 18.3%
Now married: 63.3%
Separated: 0.3%
Widowed: 4.8%
Divorced: 13.3%
Zip code 50168 compared to state average:
Unemployed percentage below state average.
Black race population percentage significantly below state average.
Hispanic race population percentage significantly below state average.
Median age significantly above state average.
Foreign-born population percentage significantly below state average.
Renting percentage below state average.
Length of stay since moving in above state average.
Averages for the 2020 tax year for zip code 50168, filed in 2021:
Average Adjusted Gross Income (AGI) in 2020: $75,044 (Individual Income Tax Returns)
Here:
$75,044
State:
$71,087
Salary/wage: $67,003 (reported on 82.9% of returns)
Here:
$67,003
State:
$57,361
(% of AGI for various income ranges: 1200.0% for AGIs below $25k, 3642.0% for AGIs $25k-50k, 7095.0% for AGIs $50k-75k, 8268.0% for AGIs $75k-100k, 21913.3% for AGIs $100k-200k)
Taxable interest for individuals: $631 (reported on 39.0% of returns)
This zip code:
$631
Iowa:
$1,633
(% of AGI for various income ranges: 16.0% for AGIs $25k-50k, 2.5% for AGIs $50k-75k, 38.0% for AGIs $75k-100k, 121.7% for AGIs $100k-200k)
Ordinary dividends: $2,083 (reported on 14.6% of returns)
Here:
$2,083
State:
$5,432
(% of AGI for various income ranges: 126.0% for AGIs $25k-50k, 103.3% for AGIs $100k-200k)
Net capital gain/loss in AGI: +$7,183 (reported on 14.6% of returns)
Here:
+$7,183
State:
+$15,243
(% of AGI for various income ranges: 250.0% for AGIs $50k-75k, 551.7% for AGIs $100k-200k)
Profit/loss from business: +$4,650 (reported on 19.5% of returns)
Here:
+$4,650
State:
+$11,763
(% of AGI for various income ranges: 247.1% for AGIs below $25k, 427.5% for AGIs $50k-75k, 46.7% for AGIs $100k-200k)
Taxable individual retirement arrangement distribution: $18,600 (reported on 9.8% of returns)
50168:
$18,600
Iowa:
$17,324
(% of AGI for various income ranges: 1488.0% for AGIs $75k-100k)
Total itemized deductions: $30,733 (reported on 7.3% of returns)
Here:
$30,733
State:
$33,775
(% of AGI for various income ranges: 1844.0% for AGIs $75k-100k)
Taxes paid: $9,050 (reported on 4.9% of returns)
50168:
$9,050
State:
$7,704
(% of AGI for various income ranges: 362.0% for AGIs $25k-50k)
Earned income credit: $1,375 (reported on 9.8% of returns)
Here:
$1,375
State:
$2,195
(% of AGI for various income ranges: 78.6% for AGIs below $25k)
Percentage of individuals using paid preparers for their 2020 taxes: 92.7%
Here:
93%
State:
95%
(% for various income ranges: 90.0% for AGIs below $25k, 85.7% for AGIs $25k-50k, 100.0% for AGIs $50k-75k, 85.7% for AGIs $75k-100k, 100.0% for AGIs $100k-200k)
Averages for the 2012 tax year for zip code 50168, filed in 2013:
Average Adjusted Gross Income (AGI) in 2012: $57,530 (Individual Income Tax Returns)
Here:
$57,530
State:
$58,860
Salary/wage: $48,688 (reported on 85.0% of returns)
Here:
$48,688
State:
$46,659
(% of AGI for various income ranges: 66.0% for AGIs below $25k, 72.8% for AGIs $25k-50k, 75.7% for AGIs $50k-75k, 87.4% for AGIs $75k-100k, 62.3% for AGIs $100k-200k)
Taxable interest for individuals: $1,260 (reported on 37.5% of returns)
This zip code:
$1,260
Iowa:
$1,537
(% of AGI for various income ranges: 1.5% for AGIs below $25k, 0.8% for AGIs $25k-50k, 1.0% for AGIs $50k-75k, 0.1% for AGIs $75k-100k, 1.0% for AGIs $100k-200k)
Ordinary dividends: $1,686 (reported on 17.5% of returns)
Here:
$1,686
State:
$4,542
Profit/loss from business: +$6,483 (reported on 15.0% of returns)
Here:
+$6,483
State:
+$10,509
Taxable individual retirement arrangement distribution: $14,500 (reported on 10.0% of returns)
50168:
$14,500
Iowa:
$11,773
Total itemized deductions: $16,753 (20% of AGI, reported on 37.5% of returns)
Here:
$16,753
State:
$21,278
Here:
20.0% of AGI
State:
18.9% of AGI
(% of AGI for various income ranges: 11.7% for AGIs $25k-50k, 14.6% for AGIs $50k-75k, 10.5% for AGIs $75k-100k, 10.8% for AGIs $100k-200k)
Charity contributions: $2,945 (reported on 27.5% of returns)
Here:
$2,945
State:
$4,044
(% of AGI for various income ranges: 2.2% for AGIs $50k-75k, 1.1% for AGIs $75k-100k, 1.8% for AGIs $100k-200k)
Taxes paid: $6,853 (reported on 37.5% of returns)
50168:
$6,853
State:
$8,846
(% of AGI for various income ranges: 3.1% for AGIs $25k-50k, 4.9% for AGIs $50k-75k, 4.2% for AGIs $75k-100k, 5.5% for AGIs $100k-200k)
Earned income credit: $2,080 (reported on 12.5% of returns)
Here:
$2,080
State:
$2,098
(% of AGI for various income ranges: 7.0% for AGIs below $25k)
Percentage of individuals using paid preparers for their 2012 taxes: 70.0%
Here:
70%
State:
65%
(% for various income ranges: 66.7% for AGIs below $25k, 71.4% for AGIs $25k-50k, 75.0% for AGIs $50k-75k, 66.7% for AGIs $75k-100k, 71.4% for AGIs $100k-200k)
Averages for the 2004 tax year for zip code 50168, filed in 2005:
Average Adjusted Gross Income (AGI) in 2004: $41,978 (Individual Income Tax Returns)
Here:
$41,978
State:
$43,875
Salary/wage: $40,143 (reported on 85.2% of returns)
Here:
$40,143
State:
$38,265
(% of AGI for various income ranges: 98.5% for AGIs below $10k, 68.0% for AGIs $10k-25k, 79.1% for AGIs $25k-50k, 87.2% for AGIs $50k-75k, 88.9% for AGIs $75k-100k, 69.7% for AGIs over 100k)
Taxable interest for individuals: $1,127 (reported on 49.0% of returns)
This zip code:
$1,127
Iowa:
$1,768
(% of AGI for various income ranges: 10.8% for AGIs below $10k, 4.8% for AGIs $10k-25k, 1.5% for AGIs $25k-50k, 0.4% for AGIs $50k-75k, 0.4% for AGIs $75k-100k, 1.1% for AGIs over 100k)
Taxable dividends: $380 (reported on 25.8% of returns)
Here:
$380
State:
$2,510
(% of AGI for various income ranges: 1.5% for AGIs below $10k, 0.5% for AGIs $10k-25k, 0.3% for AGIs $25k-50k, 0.2% for AGIs $50k-75k, 0.1% for AGIs $75k-100k, 0.2% for AGIs over 100k)
Net capital gain/loss: +$2,369 (reported on 20.1% of returns)
Here:
+$2,369
State:
+$6,139
(% of AGI for various income ranges: -3.5% for AGIs below $10k, 0.1% for AGIs $25k-50k, 1.1% for AGIs $50k-75k, 3.7% for AGIs $75k-100k)
Profit/loss from business: +$2,259 (reported on 13.9% of returns)
Here:
+$2,259
State:
+$8,574
(% of AGI for various income ranges: -5.1% for AGIs $10k-25k, 2.2% for AGIs $25k-50k, 0.3% for AGIs $50k-75k, 2.3% for AGIs $75k-100k)
Total itemized deductions: $14,703 (23% of AGI, reported on 35.4% of returns)
Here:
$14,703
State:
$16,976
Here:
22.7% of AGI
State:
20.8% of AGI
(% of AGI for various income ranges: 12.1% for AGIs $10k-25k, 12.2% for AGIs $25k-50k, 12.7% for AGIs $50k-75k, 12.1% for AGIs $75k-100k, 13.9% for AGIs over 100k)
Charity contributions deductions: $1,789 (3% of AGI, reported on 29.4% of returns)
Here:
$1,789
State:
$3,089
Here:
2.7% of AGI
State:
3.6% of AGI
(% of AGI for various income ranges: 6.9% for AGIs below $10k, 1.1% for AGIs $25k-50k, 1.3% for AGIs $50k-75k, 1.1% for AGIs $75k-100k, 1.8% for AGIs over 100k)
Total tax: $5,052 (reported on 78.7% of returns)
50168:
$5,052
State:
$6,177
(% of AGI for various income ranges: 4.2% for AGIs below $10k, 4.8% for AGIs $10k-25k, 8.0% for AGIs $25k-50k, 8.4% for AGIs $50k-75k, 10.7% for AGIs $75k-100k, 14.6% for AGIs over 100k)
Earned income credit: $1,583 (reported on 11.5% of returns)
Here:
$1,583
State:
$1,540
Percentage of individuals using paid preparers for their 2004 taxes: 70.1%
Here:
70%
State:
70%
(% for various income ranges: 60.8% for AGIs below $10k, 72.0% for AGIs $10k-25k, 74.8% for AGIs $25k-50k, 71.2% for AGIs $50k-75k, 66.7% for AGIs $75k-100k, 76.2% for AGIs over 100k)
Household received Food Stamps/SNAP in the past 12 months: 18 Household did not receive Food Stamps/SNAP in the past 12 months: 336
Women who had a birth in the past 12 months: 20 (15 now married, 4 unmarried) Women who did not have a birth in the past 12 months: 139 (66 now married, 73 unmarried)
Housing units in zip code 50168 with a mortgage: 211 (26 second mortgage, 26 both second mortgage and home equity loan) Median monthly owner costs for units with a mortgage: $2,025 Median monthly owner costs for units without a mortgage: $616
Residents with income below the poverty level in 2022:
This zip code:
2.4%
Whole state:
11.0%
Median number of rooms in houses and condos:
Here:
6.2
State:
6.8
Median number of rooms in apartments:
Here:
4.0
State:
4.2
Notable locations in this zip code not listed on our city pages
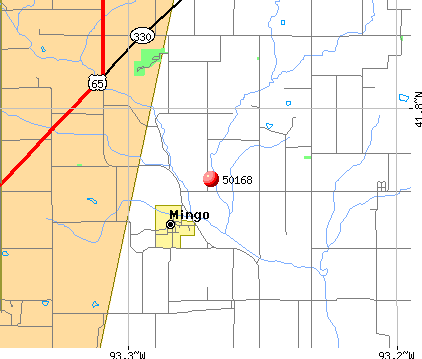
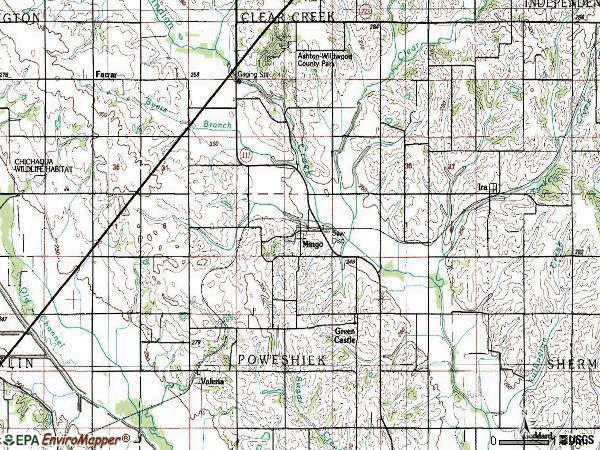
Notable locations in zip code 50168: Farmers Co-op Exchange Elevator (A), Mingo City Hall (B), Mingo Fire Department (C). Display/hide their locations on the map
Cemeteries: Sams Cemetery (1), Kintz Cemetery (2), Union Chapel Cemetery (3), Ashton Cemetery (4), Graham Cemetery (5). Display/hide their locations on the map
Size of family households: 125 2-persons, 105 3-persons, 25 4-persons, 12 5-persons, 6 6-persons
Size of nonfamily households: 53 1-person, 25 2-persons
111 married couples with children.
29 single-parent households (10 men, 19 women).
99.1% of residents of 50168 zip code speak English at home.
0.3% of residents speak Spanish at home (100% very well).
0.3% of residents speak other Indo-European language at home (100% very well).
Foreign born population: 2 (0.3%) (0.0% of them are naturalized citizens)
:
0.3%
Whole state:
6.0%
50%Ivory Coast
36%German
31%American
9%English
8%Irish
4%Swedish
2%British
2%Norwegian
Year of entry for the foreign-born population
22010 or later
02000 to 2009
01990 to 1999
0Before 1990
Facilities with environmental interests located in this zip code:
COLFAX-MINGO MIDDLE SCHOOL (MOHAWK DR in MINGO, IA)
(Geographic Names Information System) (National Center for Education Statistics) - STATE ID-501332 418 Organizations: COLFAX-MINGO COMM SCHOOL DISTRICT (SCHOOL DISTRICT)
AMERICAN CYANAMID - FORMER SITE OF (11872 HWY F-24 in MINGO, IA)
(Resource Conservation and Recovery Act (tracking hazardous waste))
CROP PRODUCTION SERVICES FARM CENTER (206 RAILROAD STREET in MINGO, IA)
COMPLIANCE ACTIVITY (Tracking inspections of insecticide, fungicide, and rodenticide, and toxic substances) Conditionally Exempt Small Quantity Generators, less than 100 kg/month of hazardous waste (Resource Conservation and Recovery Act (tracking hazardous waste)) - notification Organizations: CROP PRODUCTION SERVICES INC (CONTACT/OWNER)
Alternative names: C P S FARM CENTER, C P S FARM CENTER (MINGO)
Housing units lacking complete plumbing facilities: 5.9% Housing units lacking complete kitchen facilities: 0.4%
39.3%Bottled, tank, or LP gas
35.2%Utility gas
21.4%Electricity
4.7%Other fuel
Population in 1990: 725.
Place of birth for U.S.-born residents:
This state: 726
Midwest: 49
South: 42
West: 12
66% of the 50168 zip code residents lived in the same house 5 years ago. Out of people who lived in different houses, 62% lived in this county. Out of people who lived in different counties, 50% lived in Iowa.
96% of the 50168 zip code residents lived in the same house 1 year ago. Out of people who lived in different houses, 54% moved from this county. Out of people who lived in different houses, 36% moved from different county within same state. Out of people who lived in different houses, 11% moved from different state.
Private vs. public school enrollment:
Students in private schools in grades 1 to 8 (elementary and middle school):
Here:
0.0%
Iowa:
10.6%
Students in private schools in grades 9 to 12 (high school): 9
Here:
23.4%
Iowa:
7.9%
Students in private undergraduate colleges:
Here:
0.0%
Iowa:
23.9%
Occupation by median earnings in the past 12 months ($)
78,409Transportation occupations
64,033Office and administrative support occupations
61,880Installation, maintenance, and repair occupations
53,362Production occupations
49,999Management occupations
46,393Construction and extraction occupations
Top industries in this zip code by the number of employees in 2005:
Construction: Highway, Street, and Bridge Construction (5-9 employees: 1 establishment)
Construction: Site Preparation Contractors (1-4: 1)
Finance and Insurance: Insurance Agencies and Brokerages (1-4: 1)
Construction: Residential Remodelers (1-4: 1)
Finance and Insurance: Commercial Banking (1-4: 1)
Other Services (except Public Administration): Religious Organizations (1-4: 1)
Administrative and Support and Waste Management and Remediation Services: All Other Business Support Services (1-4: 1)
Professional, Scientific, and Technical Services: Offices of Lawyers (1-4: 1)
Fatal accident statistics in 2014:
Fatal accident count: 1
Vehicles involved in fatal accidents: 1
Fatal accidents caused by drunken drivers: 0
Fatalities: 2
Persons involved in fatal accidents: 3
Pedestrians involved in fatal accidents: 0
Fatal accident statistics in 2012:
Fatal accident count: 1
Vehicles involved in fatal accidents: 1
Fatal accidents caused by drunken drivers: 1
Fatalities: 1
Persons involved in fatal accidents: 1
Pedestrians involved in fatal accidents: 0
2002 - 2018 National Fire Incident Reporting System (NFIRS) incidents
Based on the data from the years 2002 - 2018 the average number of fires per year is 8. The highest number of fire incidents - 15 took place in 2012, and the least - 1 in 2002. The data has a growing trend.
When looking into fire subcategories, the most incidents belonged to: Outside Fires (48.3%), and Structure Fires (30.1%).
Fire incident types reported to NFIRS in Zip Code 50168


 Nearest zip codes: 50127, 50055, 50054, 50028, 50161, 50234.


 Based on the data from the years 2002 - 2018 the average number of fires per year is 8. The highest number of fire incidents - 15 took place in 2012, and the least - 1 in 2002. The data has a growing trend.
 When looking into fire subcategories, the most incidents belonged to: Outside Fires (48.3%), and Structure Fires (30.1%).