Estimated zip code population in 2022: 3,048 Zip code population in 2010: 3,093 Zip code population in 2000: 2,891
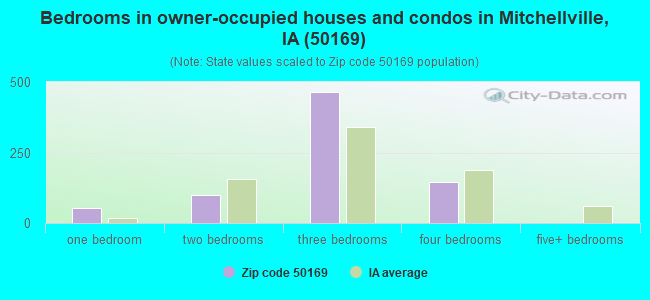
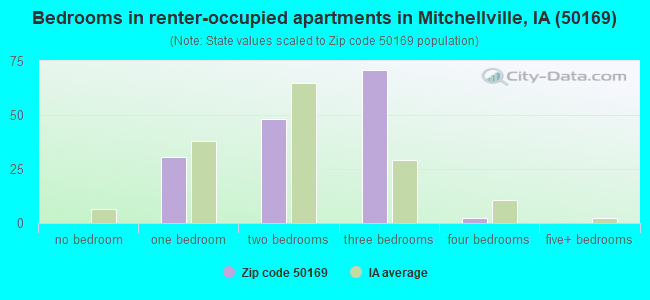
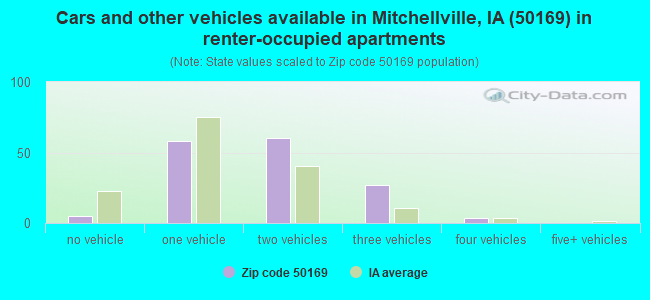
Houses and condos: 938 Renter-occupied apartments: 155
% of renters here:
17%
State:
28%
March 2022 cost of living index in zip code 50169: 82.8 (low, U.S. average is 100)
Land area: 39.8 sq. mi. Water area: 0.1 sq. mi.
Population density: 77 people per square mile
(very low).
OSM Map
General Map
Google Map
MSN Map
OSM Map
General Map
Google Map
MSN Map
OSM Map
General Map
Google Map
MSN Map
OSM Map
General Map
Google Map
MSN Map
Please wait while loading the map...
Real estate property taxes paid for housing units in 2022:
This zip code:
1.5% ($2,927)
Iowa:
1.4% ($2,724)
Median real estate property taxes paid for housing units with mortgages in 2022: $2,806 (1.5%) Median real estate property taxes paid for housing units with no mortgage in 2022: $3,230 (1.6%)
Business Search- 14 Million verified businesses
Males: 1,097
(36.0%)
Females: 1,949
(64.0%)
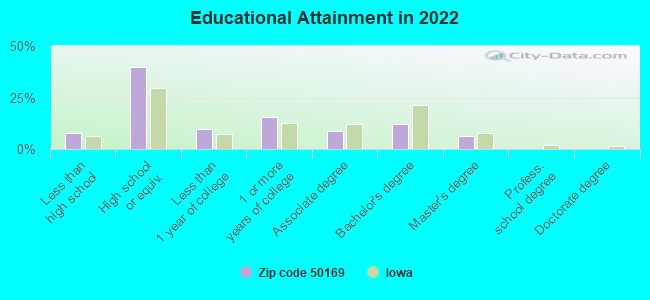
For population 25 years and over in 50169:
High school or higher: 90.8%
Bachelor's degree or higher: 17.9%
Graduate or professional degree: 6.0%
Unemployed: 0.5%
Mean travel time to work (commute): 25.6 minutes
For population 15 years and over in 50169:
Never married: 32.0%
Now married: 42.2%
Separated: 1.3%
Widowed: 2.9%
Divorced: 21.6%
Zip code 50169 compared to state average:
Unemployed percentage significantly below state average.
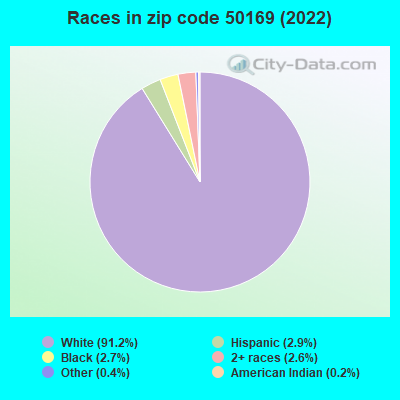
Hispanic race population percentage below state average.
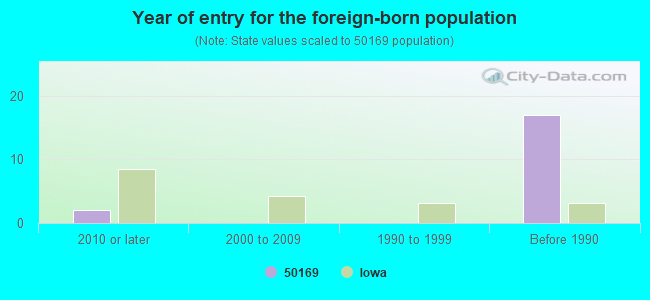
Foreign-born population percentage significantly below state average.
Renting percentage below state average.
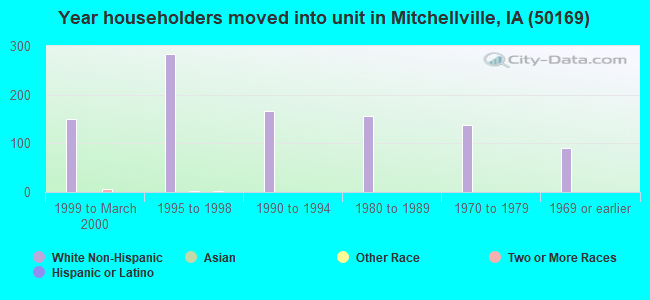
Length of stay since moving in significantly above state average.
Number of college students below state average.
Percentage of population with a bachelor's degree or higher below state average.
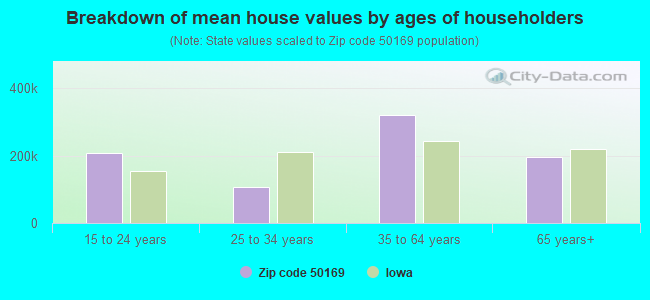
Estimated median house/condo value in 2022: $189,456
50169:
$189,456
Iowa:
$194,600
According to our research of Iowa and other state lists, there were 3 registered sex offenders living in 50169 zip code as of June 15, 2024. The ratio of all residents to sex offenders in zip code 50169 is 1,102 to 1. The ratio of registered sex offenders to all residents in this zip code is lower than the state average.
Median resident age:
This zip code:
38.0 years
Iowa median age:
38.9 years
Average household size:
This zip code:
2.5 people
Iowa:
2.3 people
Averages for the 2020 tax year for zip code 50169, filed in 2021:
Average Adjusted Gross Income (AGI) in 2020: $71,525 (Individual Income Tax Returns)
Here:
$71,525
State:
$71,087
Salary/wage: $58,215 (reported on 85.3% of returns)
Here:
$58,215
State:
$57,361
(% of AGI for various income ranges: 1079.5% for AGIs below $25k, 3482.1% for AGIs $25k-50k, 5548.2% for AGIs $50k-75k, 10149.0% for AGIs $75k-100k, 17267.3% for AGIs $100k-200k)
Taxable interest for individuals: $1,277 (reported on 30.2% of returns)
This zip code:
$1,277
Iowa:
$1,633
(% of AGI for various income ranges: 9.5% for AGIs below $25k, 24.2% for AGIs $25k-50k, 35.3% for AGIs $50k-75k, 51.0% for AGIs $75k-100k, 86.0% for AGIs $100k-200k)
Ordinary dividends: $4,504 (reported on 18.6% of returns)
Here:
$4,504
State:
$5,432
(% of AGI for various income ranges: 15.0% for AGIs below $25k, 14.6% for AGIs $25k-50k, 50.6% for AGIs $50k-75k, 75.0% for AGIs $75k-100k, 196.0% for AGIs $100k-200k)
Net capital gain/loss in AGI: +$20,625 (reported on 15.5% of returns)
Here:
+$20,625
State:
+$15,243
(% of AGI for various income ranges: 12.9% for AGIs $25k-50k, 58.8% for AGIs $50k-75k, 211.0% for AGIs $75k-100k, 356.0% for AGIs $100k-200k)
Profit/loss from business: +$9,562 (reported on 12.4% of returns)
Here:
+$9,562
State:
+$11,763
(% of AGI for various income ranges: 71.4% for AGIs below $25k, 98.8% for AGIs $25k-50k, 125.3% for AGIs $50k-75k, 615.3% for AGIs $100k-200k)
Taxable individual retirement arrangement distribution: $11,491 (reported on 8.5% of returns)
50169:
$11,491
Iowa:
$17,324
(% of AGI for various income ranges: 124.1% for AGIs below $25k, 124.7% for AGIs $50k-75k, 290.0% for AGIs $75k-100k, 326.0% for AGIs $100k-200k)
Total itemized deductions: $24,812 (reported on 6.2% of returns)
Here:
$24,812
State:
$33,775
(% of AGI for various income ranges: 516.5% for AGIs $50k-75k, 738.0% for AGIs $100k-200k)
Charity contributions: $6,900 (reported on 3.9% of returns)
Here:
$6,900
State:
$13,075
(% of AGI for various income ranges: 230.0% for AGIs $100k-200k)
Taxes paid: $7,412 (reported on 6.2% of returns)
50169:
$7,412
State:
$7,704
(% of AGI for various income ranges: 132.4% for AGIs $50k-75k, 245.3% for AGIs $100k-200k)
Earned income credit: $2,255 (reported on 8.5% of returns)
Here:
$2,255
State:
$2,195
(% of AGI for various income ranges: 66.4% for AGIs below $25k, 42.5% for AGIs $25k-50k)
Percentage of individuals using paid preparers for their 2020 taxes: 91.5%
Here:
91%
State:
95%
(% for various income ranges: 79.4% for AGIs below $25k, 93.3% for AGIs $25k-50k, 95.2% for AGIs $50k-75k, 100.0% for AGIs $75k-100k, 95.8% for AGIs $100k-200k, 100.0% for AGIs over 200k)
Averages for the 2012 tax year for zip code 50169, filed in 2013:
Average Adjusted Gross Income (AGI) in 2012: $63,189 (Individual Income Tax Returns)
Here:
$63,189
State:
$58,860
Salary/wage: $47,254 (reported on 89.5% of returns)
Here:
$47,254
State:
$46,659
(% of AGI for various income ranges: 71.6% for AGIs below $25k, 80.1% for AGIs $25k-50k, 76.1% for AGIs $50k-75k, 79.6% for AGIs $75k-100k, 71.5% for AGIs $100k-200k, 30.2% for AGIs over 200k)
Taxable interest for individuals: $767 (reported on 34.2% of returns)
This zip code:
$767
Iowa:
$1,537
(% of AGI for various income ranges: 1.5% for AGIs below $25k, 0.1% for AGIs $25k-50k, 0.3% for AGIs $50k-75k, 0.4% for AGIs $75k-100k, 0.5% for AGIs $100k-200k, 0.3% for AGIs over 200k)
Ordinary dividends: $2,041 (reported on 19.3% of returns)
Here:
$2,041
State:
$4,542
(% of AGI for various income ranges: 1.7% for AGIs below $25k, 0.3% for AGIs $25k-50k, 0.3% for AGIs $50k-75k, 0.1% for AGIs $75k-100k, 1.6% for AGIs $100k-200k)
Net capital gain/loss in AGI: +$9,693 (reported on 13.2% of returns)
Here:
+$9,693
State:
+$11,802
(% of AGI for various income ranges: 8.2% for AGIs $100k-200k)
Profit/loss from business: +$16,644 (reported on 15.8% of returns)
Here:
+$16,644
State:
+$10,509
(% of AGI for various income ranges: 3.7% for AGIs below $25k, 1.6% for AGIs $25k-50k, 0.7% for AGIs $50k-75k, 2.6% for AGIs $75k-100k, 12.6% for AGIs $100k-200k)
Taxable individual retirement arrangement distribution: $11,125 (reported on 10.5% of returns)
50169:
$11,125
Iowa:
$11,773
(% of AGI for various income ranges: 2.6% for AGIs below $25k, 1.9% for AGIs $25k-50k, 4.4% for AGIs $50k-75k, 2.3% for AGIs $100k-200k)
Total itemized deductions: $19,981 (20% of AGI, reported on 41.2% of returns)
Here:
$19,981
State:
$21,278
Here:
20.0% of AGI
State:
18.9% of AGI
(% of AGI for various income ranges: 15.8% for AGIs below $25k, 10.8% for AGIs $25k-50k, 15.3% for AGIs $50k-75k, 15.1% for AGIs $75k-100k, 13.9% for AGIs $100k-200k, 8.8% for AGIs over 200k)
Charity contributions: $3,059 (reported on 32.5% of returns)
Here:
$3,059
State:
$4,044
(% of AGI for various income ranges: 1.1% for AGIs $25k-50k, 1.5% for AGIs $50k-75k, 1.6% for AGIs $75k-100k, 1.9% for AGIs $100k-200k, 2.0% for AGIs over 200k)
Taxes paid: $8,004 (reported on 42.1% of returns)
50169:
$8,004
State:
$8,846
(% of AGI for various income ranges: 3.4% for AGIs below $25k, 3.4% for AGIs $25k-50k, 5.1% for AGIs $50k-75k, 6.0% for AGIs $75k-100k, 6.5% for AGIs $100k-200k, 5.5% for AGIs over 200k)
Earned income credit: $1,879 (reported on 12.3% of returns)
Here:
$1,879
State:
$2,098
(% of AGI for various income ranges: 4.2% for AGIs below $25k, 0.8% for AGIs $25k-50k)
Percentage of individuals using paid preparers for their 2012 taxes: 60.5%
Here:
61%
State:
65%
(% for various income ranges: 52.9% for AGIs below $25k, 53.6% for AGIs $25k-50k, 63.6% for AGIs $50k-75k, 69.2% for AGIs $75k-100k, 78.6% for AGIs $100k-200k, 66.7% for AGIs over 200k)
Averages for the 2004 tax year for zip code 50169, filed in 2005:
Average Adjusted Gross Income (AGI) in 2004: $51,002 (Individual Income Tax Returns)
Here:
$51,002
State:
$43,875
Salary/wage: $42,618 (reported on 88.8% of returns)
Here:
$42,618
State:
$38,265
(% of AGI for various income ranges: 125.0% for AGIs below $10k, 77.3% for AGIs $10k-25k, 84.2% for AGIs $25k-50k, 84.9% for AGIs $50k-75k, 86.3% for AGIs $75k-100k, 50.3% for AGIs over 100k)
Taxable interest for individuals: $1,232 (reported on 43.9% of returns)
This zip code:
$1,232
Iowa:
$1,768
(% of AGI for various income ranges: 10.4% for AGIs below $10k, 3.4% for AGIs $10k-25k, 1.5% for AGIs $25k-50k, 0.6% for AGIs $50k-75k, 0.4% for AGIs $75k-100k, 0.7% for AGIs over 100k)
Taxable dividends: $1,047 (reported on 22.8% of returns)
Here:
$1,047
State:
$2,510
(% of AGI for various income ranges: 1.5% for AGIs below $10k, 0.6% for AGIs $10k-25k, 0.2% for AGIs $25k-50k, 0.2% for AGIs $50k-75k, 0.3% for AGIs $75k-100k, 0.9% for AGIs over 100k)
Net capital gain/loss: +$1,633 (reported on 16.8% of returns)
Here:
+$1,633
State:
+$6,139
(% of AGI for various income ranges: -1.5% for AGIs below $10k, 0.5% for AGIs $10k-25k, 0.8% for AGIs $25k-50k, 0.2% for AGIs $50k-75k, 0.5% for AGIs $75k-100k, 0.7% for AGIs over 100k)
Profit/loss from business: +$7,047 (reported on 15.4% of returns)
Here:
+$7,047
State:
+$8,574
(% of AGI for various income ranges: 4.9% for AGIs below $10k, 1.8% for AGIs $10k-25k, 1.5% for AGIs $25k-50k, 1.2% for AGIs $50k-75k, 3.1% for AGIs $75k-100k, 2.5% for AGIs over 100k)
Profit/loss from farming: +$111 (reported on 4.0% of returns)
Here:
+$111
State:
-$74
IRA payment deduction: $2,250 (reported on 1.4% of returns)
50169:
$2,250
Iowa:
$2,970
Total itemized deductions: $17,072 (20% of AGI, reported on 41.2% of returns)
Here:
$17,072
State:
$16,976
Here:
19.8% of AGI
State:
20.8% of AGI
(% of AGI for various income ranges: 14.8% for AGIs $10k-25k, 14.4% for AGIs $25k-50k, 13.7% for AGIs $50k-75k, 17.2% for AGIs $75k-100k, 11.6% for AGIs over 100k)
Charity contributions deductions: $2,173 (2% of AGI, reported on 35.1% of returns)
Here:
$2,173
State:
$3,089
Here:
2.5% of AGI
State:
3.6% of AGI
(% of AGI for various income ranges: 1.2% for AGIs $10k-25k, 1.5% for AGIs $25k-50k, 1.6% for AGIs $50k-75k, 1.9% for AGIs $75k-100k, 1.3% for AGIs over 100k)
Total tax: $7,096 (reported on 78.6% of returns)
50169:
$7,096
State:
$6,177
(% of AGI for various income ranges: 4.0% for AGIs below $10k, 4.4% for AGIs $10k-25k, 6.6% for AGIs $25k-50k, 8.0% for AGIs $50k-75k, 10.0% for AGIs $75k-100k, 18.0% for AGIs over 100k)
Earned income credit: $1,523 (reported on 9.9% of returns)
Here:
$1,523
State:
$1,540
Percentage of individuals using paid preparers for their 2004 taxes: 68.3%
Here:
68%
State:
70%
(% for various income ranges: 54.1% for AGIs below $10k, 66.8% for AGIs $10k-25k, 75.6% for AGIs $25k-50k, 65.7% for AGIs $50k-75k, 74.2% for AGIs $75k-100k, 76.7% for AGIs over 100k)
Household received Food Stamps/SNAP in the past 12 months: 45 Household did not receive Food Stamps/SNAP in the past 12 months: 881
Women who had a birth in the past 12 months: 109 (15 now married, 86 unmarried) Women who did not have a birth in the past 12 months: 1,038 (270 now married, 769 unmarried)
Housing units in zip code 50169 with a mortgage: 522 (41 second mortgage, 38 both second mortgage and home equity loan) Houses without a mortgage: 15
Median monthly owner costs for units with a mortgage: $1,200 Median monthly owner costs for units without a mortgage: $654
Residents with income below the poverty level in 2022:
This zip code:
4.7%
Whole state:
11.0%
Residents with income below 50% of the poverty level in 2022:
This zip code:
3.8%
Whole state:
5.5%
Median number of rooms in houses and condos:
Here:
6.8
State:
6.8
Median number of rooms in apartments:
Here:
4.3
State:
4.2
Notable locations in this zip code not listed on our city pages
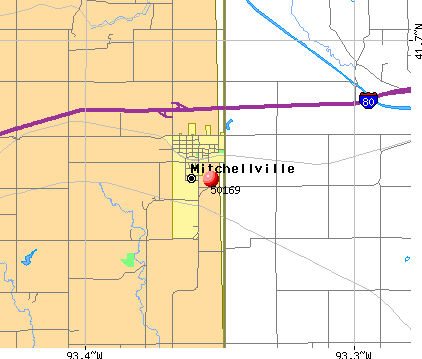
Notable locations in zip code 50169: Heartland Co-op Elevator (A), Mitchellville (B), Mitchellville West Bound Rest Area (C), Mitchellville East Bound Rest Area (D), Woodville (E), Mitchell Station (F), Iowa Correctional Institution for Women (G), Mitchellville Public Library (H), Mitchellville Fire Department (I). Display/hide their locations on the map
Churches in zip code 50169 include: Santiago United Methodist Church (A), Mitchellville Assembly of God Church (B), Mitchellville United Methodist Church (C), Mitchellville Christian Church (D), First Congregational Church (E). Display/hide their locations on the map
In group quarters: 778 (-1 institutionalized population)
Size of family households: 266 2-persons, 110 3-persons, 107 4-persons, 96 5-persons, 4 6-persons, 18 7-or-more-persons
Size of nonfamily households: 272 1-person, 47 2-persons
421 married couples with children.
93 single-parent households (44 men, 49 women).
97.5% of residents of 50169 zip code speak English at home.
1.8% of residents speak Spanish at home (96% very well, 4% well).
0.4% of residents speak other Indo-European language at home (100% very well).
Foreign born population: 9 (0.3%) (78.4% of them are naturalized citizens)
This zip code:
0.3%
Whole state:
6.0%
22%Sweden
22%United Kingdom, excluding England and Scotland
22%France
11%Honduras
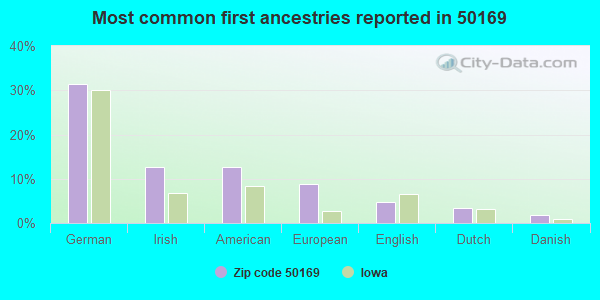
32%German
13%Irish
13%American
9%European
5%English
3%Dutch
2%Danish
Year of entry for the foreign-born population
22010 or later
02000 to 2009
01990 to 1999
17Before 1990
Facilities with environmental interests located in this zip code:
MITCHELLVILLE ELEMENTARY SCHOOL (308 ELM ST NW in MITCHELLVILLE, IA)
(National Center for Education Statistics) - STATE ID-776101 427 Organizations: SOUTHEAST POLK COMM SCHOOL DISTRICT (SCHOOL DISTRICT)
BEUKEMA TRUCKING (810 CENTER AVE S in MITCHELLVILLE, IA)
(Resource Conservation and Recovery Act (tracking hazardous waste)) Organizations: HARRY BEUKEMA (CONTACT/OWNER)
HEARTLAND CO-OP MITCHELLVILLE (101 CENTER AVENUE SOUTH in MITCHELLVILLE, IA)
AIR MINOR (AIRS/AFS) Alternative names: HEARTLAND COOP
DEN MARK MARBLE IND INC (112 1ST STREET NW in MITCHELLVILLE, IA)
AIR MINOR (AIRS/AFS) Business SIC classification: SPECIAL TRADE CONTRACTORS
SILVER SERVICE REFINING EAST (205 NW 6TH ST in MITCHELLVILLE, IA)
Conditionally Exempt Small Quantity Generators, less than 100 kg/month of hazardous waste (Resource Conservation and Recovery Act (tracking hazardous waste)) TRANSPORTER (Resource Conservation and Recovery Act (tracking hazardous waste))
MITCHELLVILLE CITY OF STP (110 2ND STREET NE in MITCHELLVILLE, IA)
National Pollutant Discharge Elimination System MAJOR (Tracking pollutant discharge elimination systems) - permit Business SIC classification: SEWERAGE SYSTEMS Organizations: CITY OF MITCHELLVILLE (CONTACT/OWNER)
Housing units lacking complete kitchen facilities: 1.6%
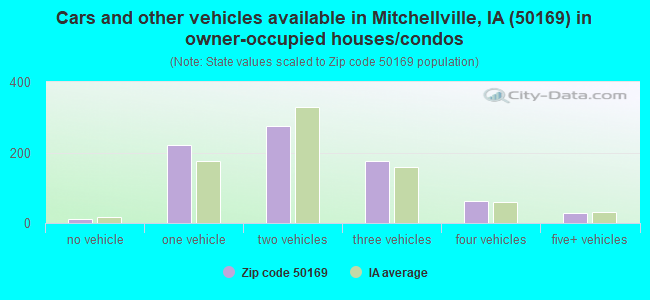
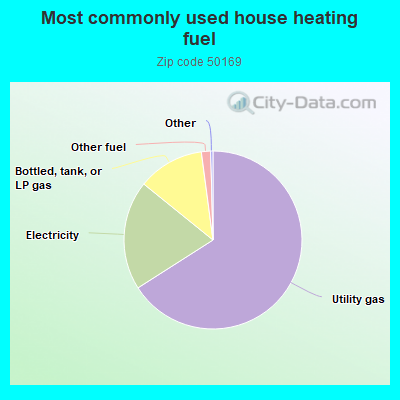
66.1%Utility gas
19.9%Electricity
12.1%Bottled, tank, or LP gas
1.7%Other fuel
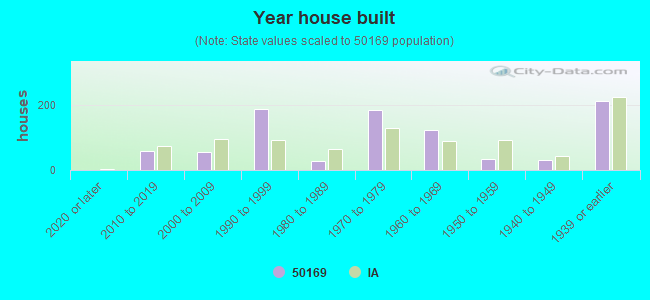
Population in 1990: 2,363. Population change in the 1990s: +528 (+22.3%).
Place of birth for U.S.-born residents:
This state: 2,523
Northeast: 33
Midwest: 312
South: 71
West: 81
55% of the 50169 zip code residents lived in the same house 5 years ago. Out of people who lived in different houses, 54% lived in this county. Out of people who lived in different counties, 50% lived in Iowa.
75% of the 50169 zip code residents lived in the same house 1 year ago. Out of people who lived in different houses, 39% moved from this county. Out of people who lived in different houses, 56% moved from different county within same state. Out of people who lived in different houses, 3% moved from different state.
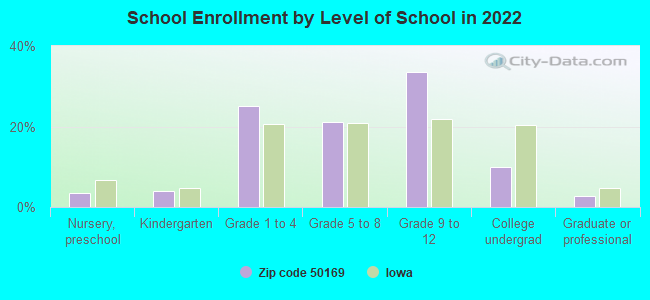
Private vs. public school enrollment:
Students in private schools in grades 1 to 8 (elementary and middle school):
Here:
0.0%
Iowa:
10.6%
Students in private schools in grades 9 to 12 (high school): 3
Here:
1.6%
Iowa:
7.9%
Students in private undergraduate colleges: 8
Here:
15.0%
Iowa:
23.9%
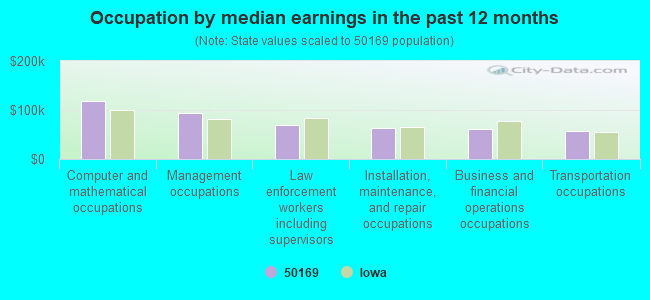
Occupation by median earnings in the past 12 months ($)
119,263Computer and mathematical occupations
93,292Management occupations
69,585Law enforcement workers including supervisors
62,422Installation, maintenance, and repair occupations
62,033Business and financial operations occupations
57,246Transportation occupations
Top industries in this zip code by the number of employees in 2005:
Health Care and Social Assistance: Nursing Care Facilities (50-99 employees: 1 establishment)
Finance and Insurance: Commercial Banking (10-19: 1)
Construction: Electrical Contractors (5-9: 2)
Other Services (except Public Administration): Religious Organizations (5-9: 1, 1-4: 1)
Construction: Framing Contractors (5-9: 1)
Construction: New Single-Family Housing Construction (except Operative Builders) (5-9: 1)
Arts, Entertainment, and Recreation: Other Spectator Sports (5-9: 1)
People in group quarters in 2010:
549 people in state prisons
58 people in nursing facilities/skilled-nursing facilities
People in group quarters in 2000:
322 people in state prisons
55 people in nursing homes
Fatal accident statistics in 2012:
Fatal accident count: 1
Vehicles involved in fatal accidents: 2
Fatal accidents caused by drunken drivers: 0
Fatalities: 1
Persons involved in fatal accidents: 3
Pedestrians involved in fatal accidents: 1
Home Mortgage Disclosure Act Aggregated Statistics For Year 2009 (Based on 4 partial tracts)
A) FHA, FSA/RHS & VA Home Purchase Loans
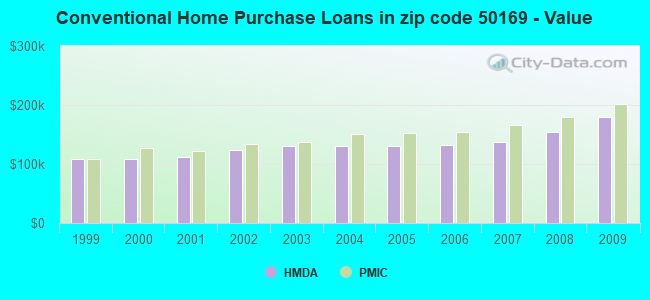
B) Conventional Home Purchase Loans
C) Refinancings
D) Home Improvement Loans
F) Non-occupant Loans on < 5 Family Dwellings (A B C & D)
G) Loans On Manufactured Home Dwelling (A B C & D)
Number
Average Value
Number
Average Value
Number
Average Value
Number
Average Value
Number
Average Value
Number
Average Value
LOANS ORIGINATED
44
$154,883
26
$179,037
159
$165,676
13
$49,023
8
$93,161
4
$123,465
APPLICATIONS APPROVED, NOT ACCEPTED
2
$119,235
1
$98,960
24
$178,319
0
$0
1
$43,260
0
$0
APPLICATIONS DENIED
5
$134,976
4
$175,955
57
$172,864
3
$59,260
2
$45,240
0
$0
APPLICATIONS WITHDRAWN
1
$168,810
2
$164,235
25
$185,610
2
$76,455
0
$0
0
$0
FILES CLOSED FOR INCOMPLETENESS
1
$62,510
0
$0
7
$178,057
0
$0
0
$0
0
$0
Aggregated Statistics For Year 2008 (Based on 4 partial tracts)
A) FHA, FSA/RHS & VA Home Purchase Loans
B) Conventional Home Purchase Loans
C) Refinancings
D) Home Improvement Loans
F) Non-occupant Loans on < 5 Family Dwellings (A B C & D)
G) Loans On Manufactured Home Dwelling (A B C & D)
Number
Average Value
Number
Average Value
Number
Average Value
Number
Average Value
Number
Average Value
Number
Average Value
LOANS ORIGINATED
17
$159,508
46
$154,932
77
$149,687
16
$45,898
12
$96,906
2
$55,015
APPLICATIONS APPROVED, NOT ACCEPTED
1
$95,380
6
$173,333
16
$153,799
4
$87,020
0
$0
1
$23,560
APPLICATIONS DENIED
2
$179,165
7
$161,481
54
$169,323
9
$37,228
1
$351,160
3
$114,950
APPLICATIONS WITHDRAWN
1
$48,230
3
$173,173
19
$175,408
3
$32,293
0
$0
0
$0
FILES CLOSED FOR INCOMPLETENESS
0
$0
1
$40,190
6
$188,480
1
$217,580
0
$0
0
$0
Aggregated Statistics For Year 2007 (Based on 4 partial tracts)
A) FHA, FSA/RHS & VA Home Purchase Loans
B) Conventional Home Purchase Loans
C) Refinancings
D) Home Improvement Loans
F) Non-occupant Loans on < 5 Family Dwellings (A B C & D)
G) Loans On Manufactured Home Dwelling (A B C & D)
Number
Average Value
Number
Average Value
Number
Average Value
Number
Average Value
Number
Average Value
Number
Average Value
LOANS ORIGINATED
5
$152,752
73
$137,414
93
$133,940
25
$44,904
4
$96,275
5
$51,434
APPLICATIONS APPROVED, NOT ACCEPTED
1
$138,250
7
$104,749
21
$140,005
3
$26,573
0
$0
1
$51,560
APPLICATIONS DENIED
2
$142,785
10
$128,618
67
$155,910
9
$55,277
1
$335,410
3
$75,083
APPLICATIONS WITHDRAWN
2
$108,685
6
$136,798
15
$170,012
2
$31,955
0
$0
0
$0
FILES CLOSED FOR INCOMPLETENESS
0
$0
4
$150,340
10
$176,111
2
$71,365
0
$0
0
$0
Aggregated Statistics For Year 2006 (Based on 4 partial tracts)
A) FHA, FSA/RHS & VA Home Purchase Loans
B) Conventional Home Purchase Loans
C) Refinancings
D) Home Improvement Loans
E) Loans on Dwellings For 5+ Families
F) Non-occupant Loans on < 5 Family Dwellings (A B C & D)
G) Loans On Manufactured Home Dwelling (A B C & D)
Number
Average Value
Number
Average Value
Number
Average Value
Number
Average Value
Number
Average Value
Number
Average Value
Number
Average Value
LOANS ORIGINATED
6
$123,312
75
$133,018
91
$128,476
23
$40,429
1
$330,980
8
$101,988
6
$85,492
APPLICATIONS APPROVED, NOT ACCEPTED
1
$42,690
10
$152,174
19
$119,312
3
$30,873
0
$0
0
$0
1
$42,690
APPLICATIONS DENIED
1
$101,730
14
$135,499
58
$128,355
16
$42,818
0
$0
2
$78,310
2
$84,805
APPLICATIONS WITHDRAWN
1
$109,010
7
$137,769
26
$140,387
2
$76,610
0
$0
0
$0
0
$0
FILES CLOSED FOR INCOMPLETENESS
0
$0
2
$135,820
18
$160,669
0
$0
0
$0
0
$0
0
$0
Aggregated Statistics For Year 2005 (Based on 4 partial tracts)
A) FHA, FSA/RHS & VA Home Purchase Loans
B) Conventional Home Purchase Loans
C) Refinancings
D) Home Improvement Loans
F) Non-occupant Loans on < 5 Family Dwellings (A B C & D)
G) Loans On Manufactured Home Dwelling (A B C & D)
Number
Average Value
Number
Average Value
Number
Average Value
Number
Average Value
Number
Average Value
Number
Average Value
LOANS ORIGINATED
7
$134,564
93
$131,200
123
$124,323
18
$35,032
7
$104,283
4
$78,748
APPLICATIONS APPROVED, NOT ACCEPTED
0
$0
15
$113,618
16
$131,500
2
$49,545
0
$0
3
$51,950
APPLICATIONS DENIED
0
$0
15
$106,978
53
$145,575
15
$41,629
1
$141,790
3
$74,593
APPLICATIONS WITHDRAWN
1
$167,980
8
$103,385
33
$110,044
2
$99,780
0
$0
1
$150,770
FILES CLOSED FOR INCOMPLETENESS
0
$0
4
$144,192
21
$150,999
3
$64,300
1
$121,410
0
$0
Aggregated Statistics For Year 2004 (Based on 4 partial tracts)
A) FHA, FSA/RHS & VA Home Purchase Loans
B) Conventional Home Purchase Loans
C) Refinancings
D) Home Improvement Loans
E) Loans on Dwellings For 5+ Families
F) Non-occupant Loans on < 5 Family Dwellings (A B C & D)
G) Loans On Manufactured Home Dwelling (A B C & D)
Number
Average Value
Number
Average Value
Number
Average Value
Number
Average Value
Number
Average Value
Number
Average Value
Number
Average Value
LOANS ORIGINATED
7
$120,243
63
$130,780
109
$125,569
23
$26,659
2
$199,195
6
$108,370
2
$62,730
APPLICATIONS APPROVED, NOT ACCEPTED
0
$0
12
$137,174
20
$115,263
3
$22,433
0
$0
0
$0
2
$64,975
APPLICATIONS DENIED
0
$0
7
$104,653
39
$137,606
9
$46,698
0
$0
0
$0
5
$48,462
APPLICATIONS WITHDRAWN
1
$108,270
9
$111,556
25
$122,241
4
$32,325
0
$0
1
$97,530
0
$0
FILES CLOSED FOR INCOMPLETENESS
0
$0
4
$151,165
16
$143,238
1
$28,000
0
$0
0
$0
1
$44,070
Aggregated Statistics For Year 2003 (Based on 4 partial tracts)
A) FHA, FSA/RHS & VA Home Purchase Loans
B) Conventional Home Purchase Loans
C) Refinancings
D) Home Improvement Loans
F) Non-occupant Loans on < 5 Family Dwellings (A B C & D)
Number
Average Value
Number
Average Value
Number
Average Value
Number
Average Value
Number
Average Value
LOANS ORIGINATED
8
$116,626
69
$130,577
226
$120,424
29
$19,806
5
$88,528
APPLICATIONS APPROVED, NOT ACCEPTED
0
$0
11
$130,975
23
$129,310
2
$22,475
1
$55,440
APPLICATIONS DENIED
0
$0
13
$108,912
67
$114,934
11
$15,648
1
$96,780
APPLICATIONS WITHDRAWN
1
$68,790
9
$121,293
36
$111,906
1
$35,790
0
$0
FILES CLOSED FOR INCOMPLETENESS
0
$0
2
$95,015
9
$125,749
2
$18,110
0
$0
Aggregated Statistics For Year 2002 (Based on 4 partial tracts)
A) FHA, FSA/RHS & VA Home Purchase Loans
B) Conventional Home Purchase Loans
C) Refinancings
D) Home Improvement Loans
E) Loans on Dwellings For 5+ Families
F) Non-occupant Loans on < 5 Family Dwellings (A B C & D)
Number
Average Value
Number
Average Value
Number
Average Value
Number
Average Value
Number
Average Value
Number
Average Value
LOANS ORIGINATED
9
$105,767
55
$123,479
149
$125,900
20
$24,126
1
$140,040
4
$75,178
APPLICATIONS APPROVED, NOT ACCEPTED
1
$91,750
6
$127,648
12
$110,483
0
$0
0
$0
0
$0
APPLICATIONS DENIED
0
$0
11
$91,864
37
$104,249
8
$20,992
0
$0
0
$0
APPLICATIONS WITHDRAWN
2
$94,225
8
$123,255
22
$118,776
0
$0
0
$0
1
$64,900
FILES CLOSED FOR INCOMPLETENESS
0
$0
2
$101,070
9
$126,832
0
$0
0
$0
0
$0
Aggregated Statistics For Year 2001 (Based on 4 partial tracts)
A) FHA, FSA/RHS & VA Home Purchase Loans
B) Conventional Home Purchase Loans
C) Refinancings
D) Home Improvement Loans
E) Loans on Dwellings For 5+ Families
F) Non-occupant Loans on < 5 Family Dwellings (A B C & D)
Number
Average Value
Number
Average Value
Number
Average Value
Number
Average Value
Number
Average Value
Number
Average Value
LOANS ORIGINATED
8
$107,791
50
$111,100
128
$108,809
21
$16,122
1
$108,850
3
$46,457
APPLICATIONS APPROVED, NOT ACCEPTED
1
$91,720
4
$131,810
15
$101,583
3
$21,907
0
$0
0
$0
APPLICATIONS DENIED
1
$83,950
13
$84,945
38
$117,396
9
$16,242
0
$0
0
$0
APPLICATIONS WITHDRAWN
1
$80,530
5
$111,376
20
$96,201
1
$31,770
0
$0
1
$61,820
FILES CLOSED FOR INCOMPLETENESS
0
$0
2
$154,830
6
$135,907
0
$0
0
$0
0
$0
Aggregated Statistics For Year 2000 (Based on 4 partial tracts)
A) FHA, FSA/RHS & VA Home Purchase Loans
B) Conventional Home Purchase Loans
C) Refinancings
D) Home Improvement Loans
F) Non-occupant Loans on < 5 Family Dwellings (A B C & D)
Number
Average Value
Number
Average Value
Number
Average Value
Number
Average Value
Number
Average Value
LOANS ORIGINATED
8
$94,721
44
$109,239
35
$96,004
30
$21,008
3
$85,050
APPLICATIONS APPROVED, NOT ACCEPTED
1
$112,300
6
$77,643
9
$77,010
3
$12,800
0
$0
APPLICATIONS DENIED
0
$0
12
$61,355
29
$70,090
9
$12,787
2
$53,770
APPLICATIONS WITHDRAWN
0
$0
4
$116,432
15
$62,932
2
$14,990
0
$0
FILES CLOSED FOR INCOMPLETENESS
0
$0
0
$0
6
$71,823
0
$0
0
$0
Aggregated Statistics For Year 1999 (Based on 2 partial tracts)
A) FHA, FSA/RHS & VA Home Purchase Loans
B) Conventional Home Purchase Loans
C) Refinancings
D) Home Improvement Loans
F) Non-occupant Loans on < 5 Family Dwellings (A B C & D)


+$111
-$74
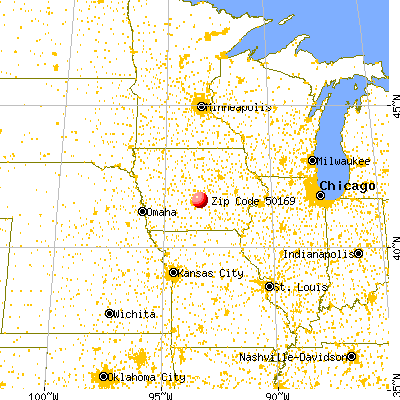
 Nearest zip codes: 50009, 50237, 50054, 50035, 50228, 50327.