Estimated zip code population in 2022: 7,170 Zip code population in 2010: 4,724 Zip code population in 2000: 3,360
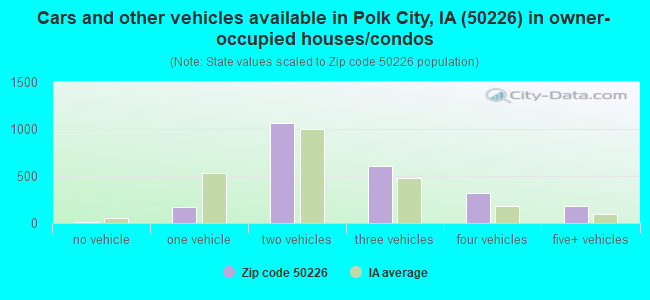
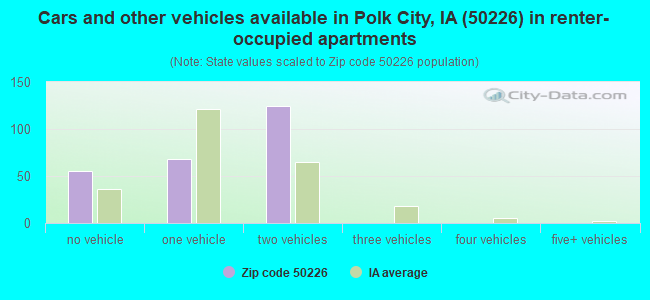
Houses and condos: 2,589 Renter-occupied apartments: 248
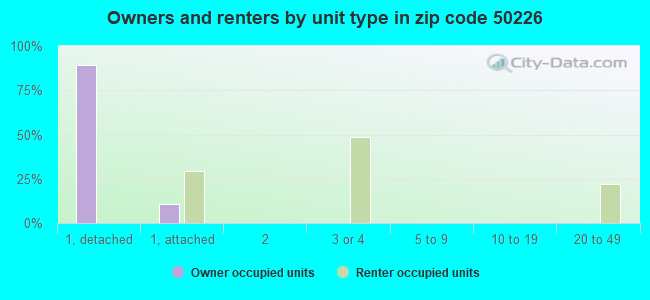
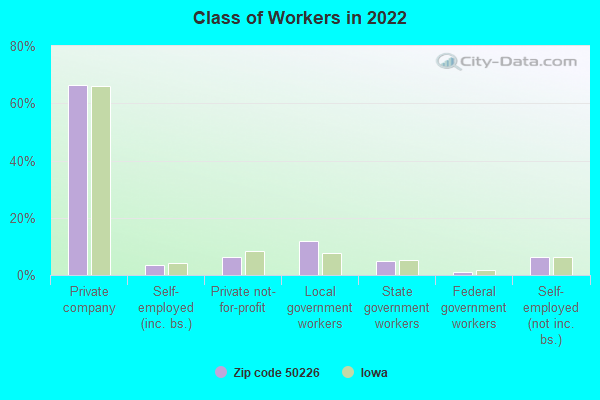
% of renters here:
10%
State:
28%
March 2022 cost of living index in zip code 50226: 88.1 (less than average, U.S. average is 100)
Land area: 37.5 sq. mi. Water area: 4.9 sq. mi.
Population density: 191 people per square mile
(very low).
OSM Map
General Map
Google Map
MSN Map
OSM Map
General Map
Google Map
MSN Map
OSM Map
General Map
Google Map
MSN Map
OSM Map
General Map
Google Map
MSN Map
Please wait while loading the map...
Real estate property taxes paid for housing units in 2022:
This zip code:
1.6% ($6,145)
Iowa:
1.4% ($2,724)
Median real estate property taxes paid for housing units with mortgages in 2022: $5,887 (1.6%) Median real estate property taxes paid for housing units with no mortgage in 2022: $7,037 (1.5%)
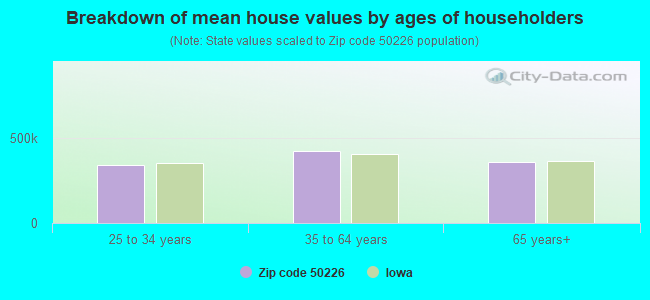
Estimated median house/condo value in 2022: $386,950
50226:
$386,950
Iowa:
$194,600
According to our research of Iowa and other state lists, there were 8 registered sex offenders living in 50226 zip code as of May 17, 2024. The ratio of all residents to sex offenders in zip code 50226 is 750 to 1. The ratio of registered sex offenders to all residents in this zip code is lower than the state average.
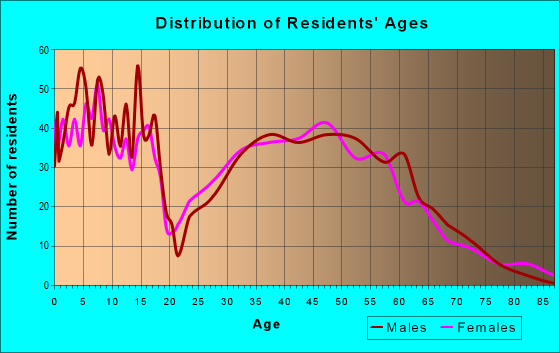
Median resident age:
This zip code:
37.9 years
Iowa median age:
38.9 years
Average household size:
This zip code:
2.8 people
Iowa:
2.3 people
Averages for the 2020 tax year for zip code 50226, filed in 2021:
Average Adjusted Gross Income (AGI) in 2020: $115,515 (Individual Income Tax Returns)
Here:
$115,515
State:
$71,087
Salary/wage: $96,925 (reported on 87.7% of returns)
Here:
$96,925
State:
$57,361
(% of AGI for various income ranges: 1173.1% for AGIs below $25k, 3696.4% for AGIs $25k-50k, 6477.7% for AGIs $50k-75k, 8991.7% for AGIs $75k-100k, 19229.2% for AGIs $100k-200k, 64689.3% for AGIs over 200k)
Taxable interest for individuals: $1,345 (reported on 45.3% of returns)
This zip code:
$1,345
Iowa:
$1,633
(% of AGI for various income ranges: 17.7% for AGIs below $25k, 27.8% for AGIs $25k-50k, 67.7% for AGIs $50k-75k, 93.5% for AGIs $75k-100k, 112.4% for AGIs $100k-200k, 449.3% for AGIs over 200k)
Ordinary dividends: $5,091 (reported on 30.4% of returns)
Here:
$5,091
State:
$5,432
(% of AGI for various income ranges: 30.3% for AGIs below $25k, 51.7% for AGIs $25k-50k, 61.0% for AGIs $50k-75k, 196.5% for AGIs $75k-100k, 212.5% for AGIs $100k-200k, 1796.0% for AGIs over 200k)
Net capital gain/loss in AGI: +$12,190 (reported on 27.5% of returns)
Here:
+$12,190
State:
+$15,243
(% of AGI for various income ranges: 26.4% for AGIs below $25k, 18.3% for AGIs $25k-50k, 94.3% for AGIs $50k-75k, 99.6% for AGIs $75k-100k, 289.7% for AGIs $100k-200k, 5476.7% for AGIs over 200k)
Profit/loss from business: +$12,280 (reported on 17.1% of returns)
Here:
+$12,280
State:
+$11,763
(% of AGI for various income ranges: 112.1% for AGIs below $25k, 126.1% for AGIs $25k-50k, 179.7% for AGIs $50k-75k, 536.1% for AGIs $75k-100k, 378.1% for AGIs $100k-200k, 1158.0% for AGIs over 200k)
Taxable individual retirement arrangement distribution: $21,843 (reported on 11.7% of returns)
50226:
$21,843
Iowa:
$17,324
(% of AGI for various income ranges: 66.7% for AGIs below $25k, 176.9% for AGIs $25k-50k, 252.7% for AGIs $50k-75k, 354.3% for AGIs $75k-100k, 654.4% for AGIs $100k-200k, 1167.3% for AGIs over 200k)
Total itemized deductions: $31,226 (reported on 14.6% of returns)
Here:
$31,226
State:
$33,775
(% of AGI for various income ranges: 206.9% for AGIs $25k-50k, 380.3% for AGIs $50k-75k, 614.8% for AGIs $75k-100k, 840.2% for AGIs $100k-200k, 4071.3% for AGIs over 200k)
Charity contributions: $9,569 (reported on 11.1% of returns)
Here:
$9,569
State:
$13,075
(% of AGI for various income ranges: 68.0% for AGIs $50k-75k, 68.3% for AGIs $75k-100k, 189.5% for AGIs $100k-200k, 1246.7% for AGIs over 200k)
Taxes paid: $8,981 (reported on 13.6% of returns)
50226:
$8,981
State:
$7,704
(% of AGI for various income ranges: 30.3% for AGIs $25k-50k, 121.3% for AGIs $50k-75k, 199.6% for AGIs $75k-100k, 251.9% for AGIs $100k-200k, 962.7% for AGIs over 200k)
Earned income credit: $2,000 (reported on 4.1% of returns)
Here:
$2,000
State:
$2,195
(% of AGI for various income ranges: 41.8% for AGIs below $25k, 26.9% for AGIs $25k-50k)
Percentage of individuals using paid preparers for their 2020 taxes: 95.3%
Here:
95%
State:
95%
(% for various income ranges: 91.4% for AGIs below $25k, 93.5% for AGIs $25k-50k, 95.0% for AGIs $50k-75k, 97.0% for AGIs $75k-100k, 96.9% for AGIs $100k-200k, 97.6% for AGIs over 200k)
Averages for the 2012 tax year for zip code 50226, filed in 2013:
Average Adjusted Gross Income (AGI) in 2012: $89,563 (Individual Income Tax Returns)
Here:
$89,563
State:
$58,860
Salary/wage: $75,152 (reported on 90.4% of returns)
Here:
$75,152
State:
$46,659
(% of AGI for various income ranges: 83.4% for AGIs below $25k, 80.6% for AGIs $25k-50k, 79.6% for AGIs $50k-75k, 77.3% for AGIs $75k-100k, 84.5% for AGIs $100k-200k, 59.9% for AGIs over 200k)
Taxable interest for individuals: $785 (reported on 48.3% of returns)
This zip code:
$785
Iowa:
$1,537
(% of AGI for various income ranges: 0.9% for AGIs below $25k, 0.5% for AGIs $25k-50k, 0.6% for AGIs $50k-75k, 0.5% for AGIs $75k-100k, 0.3% for AGIs $100k-200k, 0.4% for AGIs over 200k)
Ordinary dividends: $2,353 (reported on 30.4% of returns)
Here:
$2,353
State:
$4,542
(% of AGI for various income ranges: 1.7% for AGIs below $25k, 0.9% for AGIs $25k-50k, 1.1% for AGIs $50k-75k, 0.8% for AGIs $75k-100k, 0.5% for AGIs $100k-200k, 0.9% for AGIs over 200k)
Net capital gain/loss in AGI: +$8,364 (reported on 21.7% of returns)
Here:
+$8,364
State:
+$11,802
(% of AGI for various income ranges: 0.6% for AGIs $75k-100k, 0.2% for AGIs $100k-200k, 6.7% for AGIs over 200k)
Profit/loss from business: +$12,771 (reported on 18.3% of returns)
Here:
+$12,771
State:
+$10,509
(% of AGI for various income ranges: 5.5% for AGIs below $25k, 3.0% for AGIs $25k-50k, 3.6% for AGIs $50k-75k, 2.4% for AGIs $75k-100k, 3.3% for AGIs $100k-200k, 1.0% for AGIs over 200k)
Taxable individual retirement arrangement distribution: $16,326 (reported on 10.0% of returns)
50226:
$16,326
Iowa:
$11,773
(% of AGI for various income ranges: 3.1% for AGIs below $25k, 2.1% for AGIs $25k-50k, 2.2% for AGIs $50k-75k, 2.3% for AGIs $75k-100k, 2.7% for AGIs $100k-200k)
Total itemized deductions: $23,691 (18% of AGI, reported on 55.2% of returns)
Here:
$23,691
State:
$21,278
Here:
17.7% of AGI
State:
18.9% of AGI
(% of AGI for various income ranges: 12.3% for AGIs below $25k, 10.2% for AGIs $25k-50k, 15.2% for AGIs $50k-75k, 15.9% for AGIs $75k-100k, 16.7% for AGIs $100k-200k, 12.1% for AGIs over 200k)
Charity contributions: $3,502 (reported on 47.4% of returns)
Here:
$3,502
State:
$4,044
(% of AGI for various income ranges: 1.0% for AGIs below $25k, 0.9% for AGIs $25k-50k, 1.6% for AGIs $50k-75k, 1.8% for AGIs $75k-100k, 1.9% for AGIs $100k-200k, 2.2% for AGIs over 200k)
Taxes paid: $11,257 (reported on 55.2% of returns)
50226:
$11,257
State:
$8,846
(% of AGI for various income ranges: 2.8% for AGIs below $25k, 2.9% for AGIs $25k-50k, 6.1% for AGIs $50k-75k, 7.0% for AGIs $75k-100k, 8.2% for AGIs $100k-200k, 6.8% for AGIs over 200k)
Earned income credit: $1,427 (reported on 6.5% of returns)
Here:
$1,427
State:
$2,098
(% of AGI for various income ranges: 2.1% for AGIs below $25k, 0.7% for AGIs $25k-50k)
Percentage of individuals using paid preparers for their 2012 taxes: 52.2%
Here:
52%
State:
65%
(% for various income ranges: 39.6% for AGIs below $25k, 47.4% for AGIs $25k-50k, 58.8% for AGIs $50k-75k, 59.4% for AGIs $75k-100k, 54.2% for AGIs $100k-200k, 71.4% for AGIs over 200k)
Averages for the 2004 tax year for zip code 50226, filed in 2005:
Average Adjusted Gross Income (AGI) in 2004: $63,675 (Individual Income Tax Returns)
Here:
$63,675
State:
$43,875
Salary/wage: $57,045 (reported on 92.4% of returns)
Here:
$57,045
State:
$38,265
(% of AGI for various income ranges: 133.0% for AGIs below $10k, 75.0% for AGIs $10k-25k, 82.4% for AGIs $25k-50k, 83.7% for AGIs $50k-75k, 88.8% for AGIs $75k-100k, 79.3% for AGIs over 100k)
Taxable interest for individuals: $1,015 (reported on 59.2% of returns)
This zip code:
$1,015
Iowa:
$1,768
(% of AGI for various income ranges: 2.1% for AGIs below $10k, 2.2% for AGIs $10k-25k, 1.6% for AGIs $25k-50k, 0.9% for AGIs $50k-75k, 0.3% for AGIs $75k-100k, 1.0% for AGIs over 100k)
Taxable dividends: $1,010 (reported on 30.4% of returns)
Here:
$1,010
State:
$2,510
(% of AGI for various income ranges: 3.6% for AGIs below $10k, 0.8% for AGIs $10k-25k, 0.5% for AGIs $25k-50k, 0.4% for AGIs $50k-75k, 0.3% for AGIs $75k-100k, 0.5% for AGIs over 100k)
Net capital gain/loss: +$5,289 (reported on 22.3% of returns)
Here:
+$5,289
State:
+$6,139
(% of AGI for various income ranges: -1.8% for AGIs below $10k, -0.4% for AGIs $10k-25k, 0.1% for AGIs $25k-50k, 0.0% for AGIs $50k-75k, 0.7% for AGIs $75k-100k, 3.8% for AGIs over 100k)
Profit/loss from business: +$9,635 (reported on 19.8% of returns)
Here:
+$9,635
State:
+$8,574
(% of AGI for various income ranges: 1.1% for AGIs below $10k, 7.6% for AGIs $10k-25k, 4.3% for AGIs $25k-50k, 4.4% for AGIs $50k-75k, 2.8% for AGIs $75k-100k, 1.9% for AGIs over 100k)
Profit/loss from farming: +$1,949 (reported on 2.3% of returns)
Here:
+$1,949
State:
-$74
IRA payment deduction: $2,925 (reported on 2.3% of returns)
50226:
$2,925
Iowa:
$2,970
Self-employed pension: $8,727 (reported on 0.6% of returns)
Here:
$8,727
Iowa:
$11,928
Total itemized deductions: $18,391 (20% of AGI, reported on 54.1% of returns)
Here:
$18,391
State:
$16,976
Here:
19.5% of AGI
State:
20.8% of AGI
(% of AGI for various income ranges: 10.4% for AGIs below $10k, 13.6% for AGIs $10k-25k, 14.0% for AGIs $25k-50k, 16.8% for AGIs $50k-75k, 17.4% for AGIs $75k-100k, 15.0% for AGIs over 100k)
Charity contributions deductions: $2,308 (2% of AGI, reported on 49.4% of returns)
Here:
$2,308
State:
$3,089
Here:
2.4% of AGI
State:
3.6% of AGI
(% of AGI for various income ranges: 1.9% for AGIs $10k-25k, 1.4% for AGIs $25k-50k, 1.9% for AGIs $50k-75k, 1.9% for AGIs $75k-100k, 1.9% for AGIs over 100k)
Total tax: $9,146 (reported on 85.4% of returns)
50226:
$9,146
State:
$6,177
(% of AGI for various income ranges: 2.7% for AGIs below $10k, 5.7% for AGIs $10k-25k, 7.5% for AGIs $25k-50k, 8.5% for AGIs $50k-75k, 9.4% for AGIs $75k-100k, 17.0% for AGIs over 100k)
Earned income credit: $1,506 (reported on 5.1% of returns)
Here:
$1,506
State:
$1,540
Percentage of individuals using paid preparers for their 2004 taxes: 59.0%
Here:
59%
State:
70%
(% for various income ranges: 40.5% for AGIs below $10k, 52.8% for AGIs $10k-25k, 65.0% for AGIs $25k-50k, 67.5% for AGIs $50k-75k, 58.8% for AGIs $75k-100k, 64.6% for AGIs over 100k)
Household received Food Stamps/SNAP in the past 12 months: 14 Household did not receive Food Stamps/SNAP in the past 12 months: 2,587
Women who had a birth in the past 12 months: 56 (57 now married, 0 unmarried) Women who did not have a birth in the past 12 months: 1,315 (944 now married, 368 unmarried)
Housing units in zip code 50226 with a mortgage: 1,876 (193 second mortgage, 142 both second mortgage and home equity loan) Houses without a mortgage: 37
Median monthly owner costs for units with a mortgage: $2,166 Median monthly owner costs for units without a mortgage: $978
Residents with income below the poverty level in 2022:
This zip code:
6.4%
Whole state:
11.0%
Residents with income below 50% of the poverty level in 2022:
This zip code:
2.0%
Whole state:
5.5%
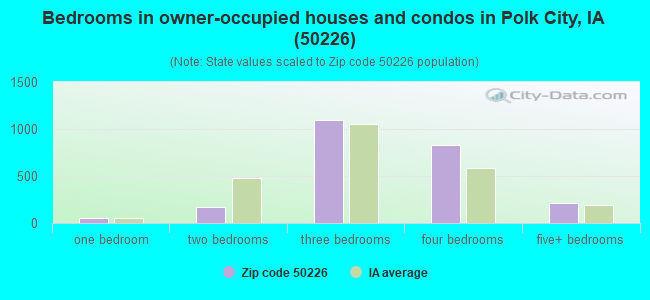
Median number of rooms in houses and condos:
Here:
7.5
State:
6.8
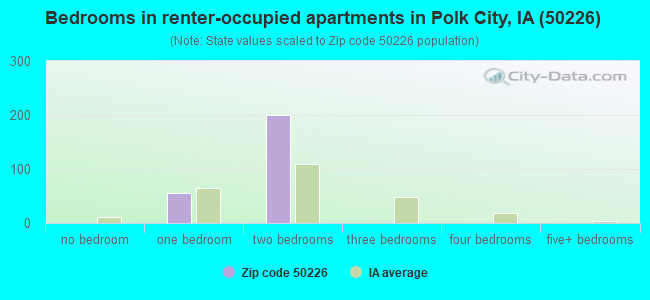
Median number of rooms in apartments:
Here:
3.9
State:
4.2
Notable locations in this zip code not listed on our city pages
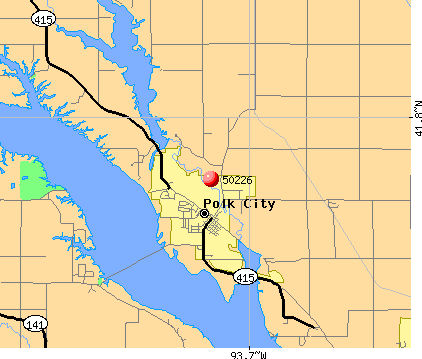
Notable locations in zip code 50226: Crocker (A), Ulm (B), Palmer (C), Polk City City Hall (D), Polk City Volunteer Fire and Rescue Department (E), Polk City Police Station (F), Polk City Community Library (G). Display/hide their locations on the map
Cemeteries: Sheldahl Cemetery (1), Crocker Cemetery (2), Union Cemetery (3), Hopkins Grove Cemetery (4), Polk City Cemetery (5), Beebe Cemetery (6), Davis Farm Cemetery (7). Display/hide their locations on the map
In group quarters: 56 (-1 institutionalized population)
Size of family households: 934 2-persons, 456 3-persons, 466 4-persons, 170 5-persons, 157 6-persons
Size of nonfamily households: 274 1-person, 95 2-persons
1,645 married couples with children.
187 single-parent households (67 men, 120 women).
98.6% of residents of 50226 zip code speak English at home.
0.5% of residents speak Spanish at home (100% very well).
0.1% of residents speak other Indo-European language at home (100% very well).
0.1% of residents speak other language at home (100% very well).
Foreign born population: 0 (0.0%)
:
0.0%
Whole state:
6.0%
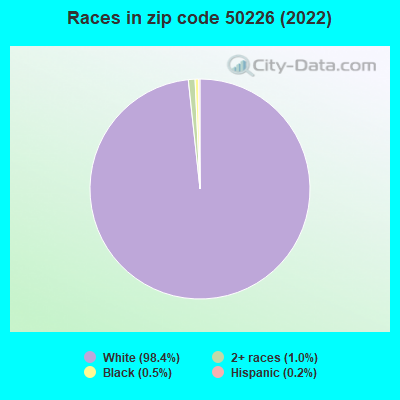
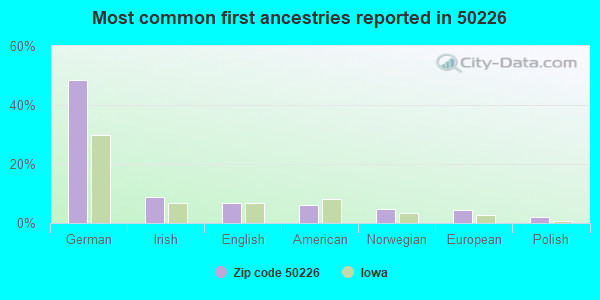
48%German
9%Irish
7%English
6%American
5%Norwegian
4%European
2%Polish
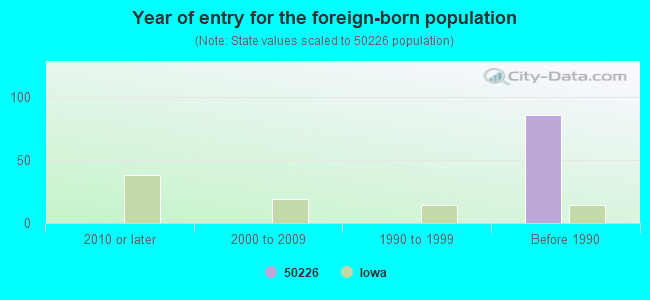
Year of entry for the foreign-born population
02010 or later
02000 to 2009
01990 to 1999
86Before 1990
Facilities with environmental interests located in this zip code:
NORTH POLK WEST ELEMENTARY SCHOOL (1400 W BROADWAY in POLK CITY, IA)
(National Center for Education Statistics) - STATE ID-774779 418 Organizations: NORTH POLK COMM SCHOOL DISTRICT (SCHOOL DISTRICT)
POLK CITY WATER PLANT (402 NORTH 3RD STREET in POLK CITY, IA)
AIR MINOR (AIRS/AFS) COMMUNITY WATER SYSTEM (SDWIS) Business SIC classification: GENERAL GOVERNMENT Alternative names: CITY OF POLK CITY, POLK CITY WATER SUPPLY
POLK CITY, CITY OF STP (LOCATED AT SE END OF E. BROADW in POLK CITY, IA)
National Pollutant Discharge Elimination System NON-MAJOR (Tracking pollutant discharge elimination systems) - permit Business SIC classification: SEWERAGE SYSTEMS Organizations: POLK CITY CITY OF (CONTACT/OWNER)
BROKEN ARROW PROMO (3RD & BROADWAY AVE-SW CORNER in POLK CITY, IA)
(Resource Conservation and Recovery Act (tracking hazardous waste))
SCHWARZ MARINA INC / SAYLORVILLE LAKE (6170 POLK CITY DR in POLK CITY, IA)
(Resource Conservation and Recovery Act (tracking hazardous waste))
POLK CITY MAINT SHOP (6555 NW 118TH ST in POLK CITY, IA)
(Resource Conservation and Recovery Act (tracking hazardous waste))
BIG CREEK STATE PARK IDNR (12397 NW 89TH COURT in POLK CITY, IA)
CUSTOM CONVEYOR CORPORATION (109 1ST STREET in POLK CITY, IA)
AIR SYNTHETIC MINOR (AIRS/AFS) Business SIC classification: WELDING REPAIR
POLK COUNTY (EX) RIFLE RANGE ( in POLK CITY, IA)
SUPERFUND (Superfund database) Alternative names: POLK COUNTY MILITIA TARGET RANGE
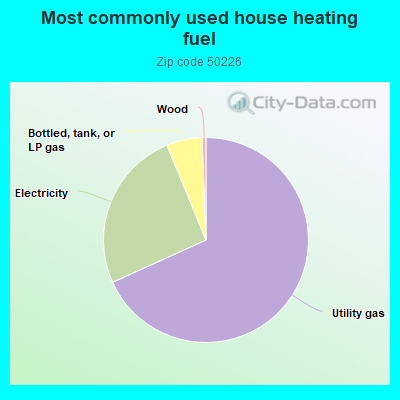
68.1%Utility gas
25.5%Electricity
5.6%Bottled, tank, or LP gas
0.6%Wood
Population in 1990: 4,203.
Place of birth for U.S.-born residents:
This state: 5,928
Northeast: 27
Midwest: 610
South: 105
West: 401
57% of the 50226 zip code residents lived in the same house 5 years ago. Out of people who lived in different houses, 67% lived in this county. Out of people who lived in different counties, 50% lived in Iowa.
94% of the 50226 zip code residents lived in the same house 1 year ago. Out of people who lived in different houses, 67% moved from this county. Out of people who lived in different houses, 36% moved from different county within same state.
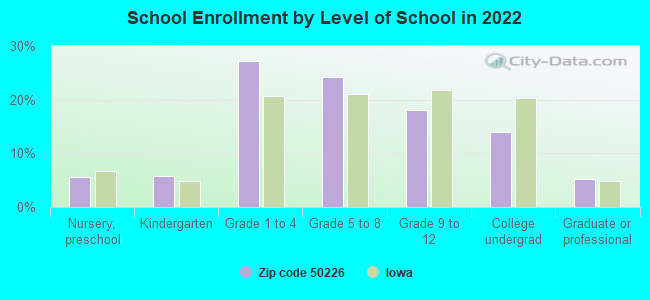
Private vs. public school enrollment:
Students in private schools in grades 1 to 8 (elementary and middle school): 119
Here:
11.7%
Iowa:
10.6%
Students in private schools in grades 9 to 12 (high school): 34
Here:
9.6%
Iowa:
7.9%
Students in private undergraduate colleges: 66
Here:
24.5%
Iowa:
23.9%
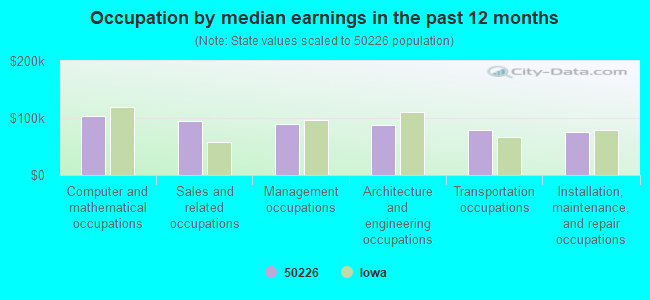
Occupation by median earnings in the past 12 months ($)
102,643Computer and mathematical occupations
95,325Sales and related occupations
88,923Management occupations
88,245Architecture and engineering occupations
78,189Transportation occupations
74,597Installation, maintenance, and repair occupations
Companies with federal contracts located in this zip code (POLK CITY, IA):
LAWNS UNLIMITED, INC (311 TYLER; small business) : $78,294 in 3 contractsfrom 2001 to 2003
$26,098 with U.S. Army Corps of Engineers - civil program financing only for Landscaping/Groundskeeping Services. Signed on 2003-01-28. Completion date: 2003-03-31.
$26,098, same as above.Signed on 2002-01-23. Completion date: 2003-03-31.
$26,098, same as above.Signed on 2001-03-05. Completion date: 2004-03-31.
MARVIN DE NOOY (10190 NW LAKE DR; small business) : $62,270 in 4 contractsfrom 2002 to 2004
$17,860 with U.S. Army Corps of Engineers - civil program financing only for Custodial Janitorial Services. Signed on 2004-01-28. Completion date: 2003-02-28.
$17,860 with Army for Custodial Janitorial Services. Signed on 2004-01-28. Completion date: 2003-02-28.
$14,040 with U.S. Army Corps of Engineers - civil program financing only for Custodial Janitorial Services. Signed on 2003-01-15. Completion date: 2003-02-28.
$12,510, same as above.Signed on 2002-05-13. Completion date: 2003-02-28.
IOWA NATURAL RESOURCES CORPORA (605 STIPPICH ST) : $55,817 in 14 contractsfrom 2004 to 2005
Contracts for Other Natural Resources and Conservation Services, Landscaping/Groundskeeping Services by U.S. Army Corps of Engineers - civil program financing only, Army Signed by year:2000: $0; 2001: $0; 2002: $0; 2003: $0; 2004: $4,657; 2005: $51,160; 2006: $0.
Biggest contracts:
$8,166 with U.S. Army Corps of Engineers - civil program financing only for Other Natural Resources and Conservation Services. Signed on 2005-01-13. Completion date: 2005-01-11.
$6,800 with Army for Landscaping/Groundskeeping Services. Signed on 2005-04-05. Completion date: 2005-01-11.
$6,800 with U.S. Army Corps of Engineers - civil program financing only for Landscaping/Groundskeeping Services. Signed on 2005-04-05. Completion date: 2005-01-11.
$5,527 with U.S. Army Corps of Engineers - civil program financing only for Other Natural Resources and Conservation Services. Signed on 2005-08-23. Completion date: 2005-08-22.
DE NOOY, RUTH (10190 NW LAKE DR; small business) : $41,580 in 2 contractsin 2005
$20,790 with Army for Custodial Janitorial Services. Signed on 2005-02-08. Completion date: 2006-03-31.
$20,790 with U.S. Army Corps of Engineers - civil program financing only for Custodial Janitorial Services. Signed on 2005-02-08. Completion date: 2006-03-31.
HELEN R WEBER (NW 94TH AVE; small business) : $20,313 in 4 contractsfrom 2002 to 2004
$10,458 with U.S. Army Corps of Engineers - civil program financing only for Custodial Janitorial Services. Signed on 2002-01-16. Completion date: 2003-02-28.
$10,325, same as above.Signed on 2003-01-23. Completion date: 2003-02-28.
-$235 with Army for Custodial Janitorial Services. Signed on 2004-01-07. Completion date: 2003-02-28.
-$235 with U.S. Army Corps of Engineers - civil program financing only for Custodial Janitorial Services. Signed on 2004-01-07. Completion date: 2003-02-28.
THOMAS W SCHLIFE (5110 NW 118TH AVE; small business) : $11,725 in 3 contractsin 2002
$11,085 with U.S. Army Corps of Engineers - civil program financing only for Custodial Janitorial Services. Signed on 2002-02-19. Completion date: 2002-10-31.
$640, same as above.Signed on 2002-09-11. Completion date: 2002-10-31.
$0, same as above.Signed on 2002-02-19. Completion date: 2002-10-31.
Top industries in this zip code by the number of employees in 2005:
Health Care and Social Assistance: Child Day Care Services (50-99 employees: 1 establishment, 1-4 employees: 1 establishment)
Health Care and Social Assistance: Nursing Care Facilities (50-99: 1)
Professional, Scientific, and Technical Services: Graphic Design Services (20-49: 1)
Construction: Plumbing, Heating, and Air-Conditioning Contractors (20-49: 1)
Finance and Insurance: Commercial Banking (20-49: 1)
Arts, Entertainment, and Recreation: Golf Courses and Country Clubs (20-49: 1)
Other Services (except Public Administration): Religious Organizations (10-19: 1, 1-4: 2)
People in group quarters in 2010:
57 people in nursing facilities/skilled-nursing facilities
People in group quarters in 2000:
62 people in nursing homes
Fatal accident statistics in 2011:
Fatal accident count: 1
Vehicles involved in fatal accidents: 1
Fatal accidents caused by drunken drivers: 0
Fatalities: 1
Persons involved in fatal accidents: 1
Pedestrians involved in fatal accidents: 0
Home Mortgage Disclosure Act Aggregated Statistics For Year 2009 (Based on 4 partial tracts)
A) FHA, FSA/RHS & VA Home Purchase Loans
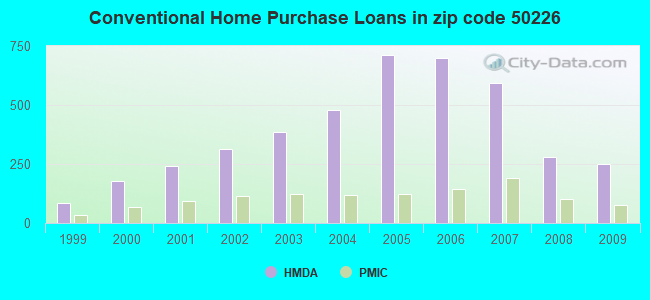
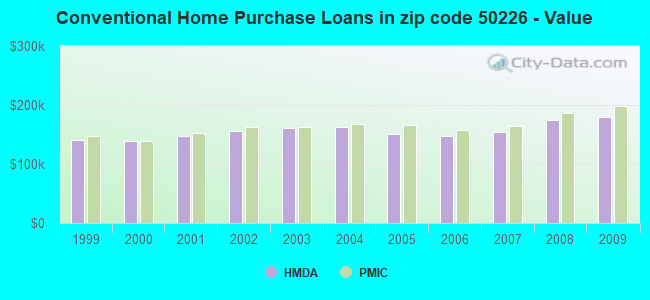
B) Conventional Home Purchase Loans
C) Refinancings
D) Home Improvement Loans
E) Loans on Dwellings For 5+ Families
F) Non-occupant Loans on < 5 Family Dwellings (A B C & D)
G) Loans On Manufactured Home Dwelling (A B C & D)
Number
Average Value
Number
Average Value
Number
Average Value
Number
Average Value
Number
Average Value
Number
Average Value
Number
Average Value
LOANS ORIGINATED
210
$170,566
252
$178,935
1,022
$189,666
26
$55,161
2
$1,728,340
16
$147,103
1
$176,530
APPLICATIONS APPROVED, NOT ACCEPTED
4
$138,435
14
$150,068
92
$176,300
2
$99,640
0
$0
1
$154,280
0
$0
APPLICATIONS DENIED
17
$174,574
22
$180,635
165
$197,933
14
$40,401
0
$0
3
$72,710
1
$12,750
APPLICATIONS WITHDRAWN
17
$179,045
25
$171,903
164
$202,373
3
$70,933
0
$0
2
$115,780
1
$118,130
FILES CLOSED FOR INCOMPLETENESS
3
$163,390
3
$302,710
22
$219,231
1
$33,560
0
$0
1
$62,420
0
$0
Aggregated Statistics For Year 2008 (Based on 4 partial tracts)
A) FHA, FSA/RHS & VA Home Purchase Loans
B) Conventional Home Purchase Loans
C) Refinancings
D) Home Improvement Loans
E) Loans on Dwellings For 5+ Families
F) Non-occupant Loans on < 5 Family Dwellings (A B C & D)
G) Loans On Manufactured Home Dwelling (A B C & D)
Number
Average Value
Number
Average Value
Number
Average Value
Number
Average Value
Number
Average Value
Number
Average Value
Number
Average Value
LOANS ORIGINATED
80
$168,609
281
$173,761
375
$185,704
37
$49,358
2
$340,570
27
$140,082
1
$368,560
APPLICATIONS APPROVED, NOT ACCEPTED
6
$155,690
23
$155,237
45
$200,314
8
$41,262
0
$0
2
$90,055
1
$31,430
APPLICATIONS DENIED
10
$149,073
23
$145,508
151
$174,463
17
$64,430
0
$0
9
$145,101
2
$66,760
APPLICATIONS WITHDRAWN
8
$177,741
28
$164,511
81
$195,343
4
$89,418
0
$0
1
$148,080
0
$0
FILES CLOSED FOR INCOMPLETENESS
2
$148,505
7
$191,484
21
$203,118
1
$21,930
0
$0
0
$0
0
$0
Aggregated Statistics For Year 2007 (Based on 4 partial tracts)
A) FHA, FSA/RHS & VA Home Purchase Loans
B) Conventional Home Purchase Loans
C) Refinancings
D) Home Improvement Loans
E) Loans on Dwellings For 5+ Families
F) Non-occupant Loans on < 5 Family Dwellings (A B C & D)
G) Loans On Manufactured Home Dwelling (A B C & D)
Number
Average Value
Number
Average Value
Number
Average Value
Number
Average Value
Number
Average Value
Number
Average Value
Number
Average Value
LOANS ORIGINATED
27
$162,835
594
$155,007
329
$167,095
61
$42,788
1
$1,932,760
30
$171,786
1
$95,910
APPLICATIONS APPROVED, NOT ACCEPTED
1
$125,510
32
$128,219
71
$154,857
13
$38,249
0
$0
2
$236,260
0
$0
APPLICATIONS DENIED
6
$161,112
48
$160,716
184
$166,635
30
$67,876
0
$0
4
$102,272
3
$48,823
APPLICATIONS WITHDRAWN
3
$148,347
35
$168,791
61
$172,994
3
$209,413
0
$0
1
$226,190
0
$0
FILES CLOSED FOR INCOMPLETENESS
0
$0
36
$189,665
44
$186,514
1
$122,040
0
$0
2
$160,595
0
$0
Aggregated Statistics For Year 2006 (Based on 4 partial tracts)
A) FHA, FSA/RHS & VA Home Purchase Loans
B) Conventional Home Purchase Loans
C) Refinancings
D) Home Improvement Loans
F) Non-occupant Loans on < 5 Family Dwellings (A B C & D)
G) Loans On Manufactured Home Dwelling (A B C & D)
Number
Average Value
Number
Average Value
Number
Average Value
Number
Average Value
Number
Average Value
Number
Average Value
LOANS ORIGINATED
43
$150,758
699
$147,414
365
$149,398
65
$49,356
25
$129,999
1
$138,940
APPLICATIONS APPROVED, NOT ACCEPTED
1
$213,440
69
$125,248
57
$135,077
11
$156,920
1
$85,080
1
$110,750
APPLICATIONS DENIED
4
$119,138
67
$169,992
136
$142,082
30
$47,419
11
$169,996
2
$67,115
APPLICATIONS WITHDRAWN
3
$162,777
48
$155,537
69
$195,074
5
$36,782
2
$121,825
0
$0
FILES CLOSED FOR INCOMPLETENESS
1
$222,170
33
$150,347
55
$198,571
2
$89,605
1
$67,120
1
$55,560
Aggregated Statistics For Year 2005 (Based on 4 partial tracts)
A) FHA, FSA/RHS & VA Home Purchase Loans
B) Conventional Home Purchase Loans
C) Refinancings
D) Home Improvement Loans
F) Non-occupant Loans on < 5 Family Dwellings (A B C & D)
G) Loans On Manufactured Home Dwelling (A B C & D)
Number
Average Value
Number
Average Value
Number
Average Value
Number
Average Value
Number
Average Value
Number
Average Value
LOANS ORIGINATED
35
$148,251
710
$151,507
392
$152,451
45
$51,621
27
$138,920
5
$89,116
APPLICATIONS APPROVED, NOT ACCEPTED
1
$221,500
63
$155,623
61
$146,912
7
$42,866
0
$0
1
$40,200
APPLICATIONS DENIED
3
$128,037
61
$146,475
133
$162,738
21
$44,815
5
$130,560
1
$100,680
APPLICATIONS WITHDRAWN
2
$133,235
49
$167,347
103
$175,821
2
$45,820
2
$128,320
0
$0
FILES CLOSED FOR INCOMPLETENESS
0
$0
27
$186,406
63
$196,770
2
$125,850
0
$0
1
$120,820
Aggregated Statistics For Year 2004 (Based on 4 partial tracts)
A) FHA, FSA/RHS & VA Home Purchase Loans
B) Conventional Home Purchase Loans
C) Refinancings
D) Home Improvement Loans
F) Non-occupant Loans on < 5 Family Dwellings (A B C & D)
G) Loans On Manufactured Home Dwelling (A B C & D)
Number
Average Value
Number
Average Value
Number
Average Value
Number
Average Value
Number
Average Value
Number
Average Value
LOANS ORIGINATED
20
$148,743
479
$163,234
382
$154,842
58
$38,840
12
$209,895
2
$697,540
APPLICATIONS APPROVED, NOT ACCEPTED
0
$0
35
$158,293
50
$169,936
2
$61,040
1
$61,400
1
$61,400
APPLICATIONS DENIED
4
$144,980
25
$145,460
110
$149,716
23
$35,393
1
$71,150
2
$54,365
APPLICATIONS WITHDRAWN
1
$100,010
26
$137,501
70
$166,917
8
$68,132
2
$97,275
0
$0
FILES CLOSED FOR INCOMPLETENESS
2
$117,700
20
$132,754
40
$195,442
6
$34,372
1
$71,150
0
$0
Aggregated Statistics For Year 2003 (Based on 4 partial tracts)
A) FHA, FSA/RHS & VA Home Purchase Loans
B) Conventional Home Purchase Loans
C) Refinancings
D) Home Improvement Loans
F) Non-occupant Loans on < 5 Family Dwellings (A B C & D)
Number
Average Value
Number
Average Value
Number
Average Value
Number
Average Value
Number
Average Value
LOANS ORIGINATED
42
$136,313
386
$160,680
818
$154,265
36
$27,990
17
$185,703
APPLICATIONS APPROVED, NOT ACCEPTED
1
$92,630
35
$158,954
63
$175,158
8
$26,328
0
$0
APPLICATIONS DENIED
3
$135,197
36
$154,242
131
$157,281
17
$25,067
4
$61,900
APPLICATIONS WITHDRAWN
1
$108,060
27
$162,926
79
$140,415
1
$63,090
1
$55,710
FILES CLOSED FOR INCOMPLETENESS
3
$189,257
14
$131,325
26
$180,578
0
$0
0
$0
Aggregated Statistics For Year 2002 (Based on 4 partial tracts)
A) FHA, FSA/RHS & VA Home Purchase Loans
B) Conventional Home Purchase Loans
C) Refinancings
D) Home Improvement Loans
E) Loans on Dwellings For 5+ Families
F) Non-occupant Loans on < 5 Family Dwellings (A B C & D)
Number
Average Value
Number
Average Value
Number
Average Value
Number
Average Value
Number
Average Value
Number
Average Value
LOANS ORIGINATED
29
$136,082
313
$155,231
430
$154,256
34
$20,763
1
$8,770
9
$114,633
APPLICATIONS APPROVED, NOT ACCEPTED
0
$0
27
$138,057
35
$148,420
6
$26,705
0
$0
1
$53,020
APPLICATIONS DENIED
2
$144,980
40
$138,318
64
$135,876
11
$33,255
0
$0
1
$34,360
APPLICATIONS WITHDRAWN
0
$0
13
$144,429
51
$131,813
2
$14,655
0
$0
0
$0
FILES CLOSED FOR INCOMPLETENESS
0
$0
6
$192,278
16
$203,124
1
$14,620
0
$0
0
$0
Aggregated Statistics For Year 2001 (Based on 4 partial tracts)
A) FHA, FSA/RHS & VA Home Purchase Loans
B) Conventional Home Purchase Loans
C) Refinancings
D) Home Improvement Loans
F) Non-occupant Loans on < 5 Family Dwellings (A B C & D)
Number
Average Value
Number
Average Value
Number
Average Value
Number
Average Value
Number
Average Value
LOANS ORIGINATED
30
$114,353
243
$147,175
338
$144,435
41
$19,792
15
$115,810
APPLICATIONS APPROVED, NOT ACCEPTED
1
$79,870
16
$145,243
25
$126,791
6
$19,702
0
$0
APPLICATIONS DENIED
1
$181,220
20
$121,520
55
$108,813
6
$11,667
1
$154,970
APPLICATIONS WITHDRAWN
1
$87,260
10
$174,694
37
$113,260
3
$30,347
1
$134,500
FILES CLOSED FOR INCOMPLETENESS
1
$80,410
6
$98,038
11
$145,195
1
$19,010
1
$122,810
Aggregated Statistics For Year 2000 (Based on 4 partial tracts)
A) FHA, FSA/RHS & VA Home Purchase Loans
B) Conventional Home Purchase Loans
C) Refinancings
D) Home Improvement Loans
E) Loans on Dwellings For 5+ Families
F) Non-occupant Loans on < 5 Family Dwellings (A B C & D)
Number
Average Value
Number
Average Value
Number
Average Value
Number
Average Value
Number
Average Value
Number
Average Value
LOANS ORIGINATED
18
$110,336
180
$139,037
88
$117,439
31
$20,751
1
$164,440
7
$93,624
APPLICATIONS APPROVED, NOT ACCEPTED
1
$171,160
19
$118,288
20
$68,311
8
$18,631
0
$0
1
$100,010
APPLICATIONS DENIED
0
$0
20
$105,896
25
$62,888
7
$26,001
0
$0
0
$0
APPLICATIONS WITHDRAWN
0
$0
11
$128,951
13
$82,858
0
$0
0
$0
0
$0
FILES CLOSED FOR INCOMPLETENESS
0
$0
4
$144,972
8
$125,565
0
$0
0
$0
0
$0
Aggregated Statistics For Year 1999 (Based on 2 partial tracts)
A) FHA, FSA/RHS & VA Home Purchase Loans
B) Conventional Home Purchase Loans
C) Refinancings
D) Home Improvement Loans
F) Non-occupant Loans on < 5 Family Dwellings (A B C & D)
Detailed PMIC statistics for the following Tracts:0102.03
, 0115.00
2003 - 2018 National Fire Incident Reporting System (NFIRS) incidents
According to the data from the years 2003 - 2018 the average number of fires per year is 11. The highest number of fire incidents - 23 took place in 2003, and the least - 0 in 2017. The data has a dropping trend.
When looking into fire subcategories, the most reports belonged to: Structure Fires (40.7%), and Outside Fires (40.7%).
Fire incident types reported to NFIRS in Zip Code 50226


+$1,949
-$74
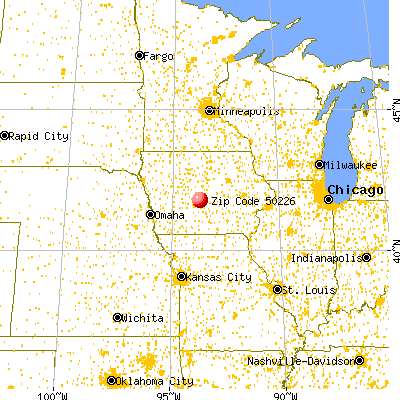
 Nearest zip codes: 50243, 50244, 50023, 50007, 50109, 50131.


 According to the data from the years 2003 - 2018 the average number of fires per year is 11. The highest number of fire incidents - 23 took place in 2003, and the least - 0 in 2017. The data has a dropping trend.
 When looking into fire subcategories, the most reports belonged to: Structure Fires (40.7%), and Outside Fires (40.7%).