Estimated zip code population in 2022: 1,172 Zip code population in 2010: 1,182 Zip code population in 2000: 1,260
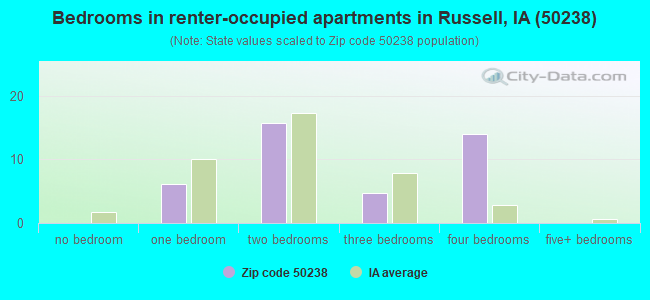
Houses and condos: 575 Renter-occupied apartments: 39
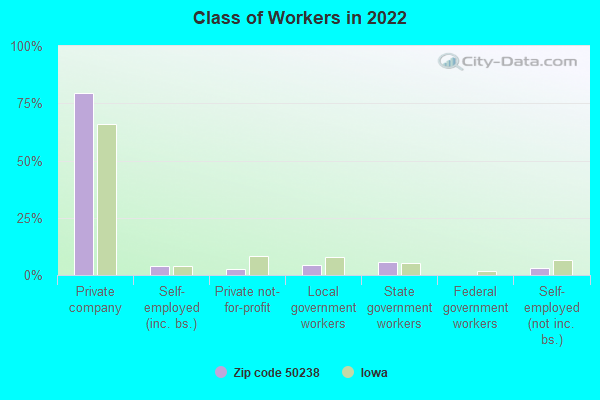
% of renters here:
8%
State:
28%
March 2022 cost of living index in zip code 50238: 81.4 (low, U.S. average is 100)
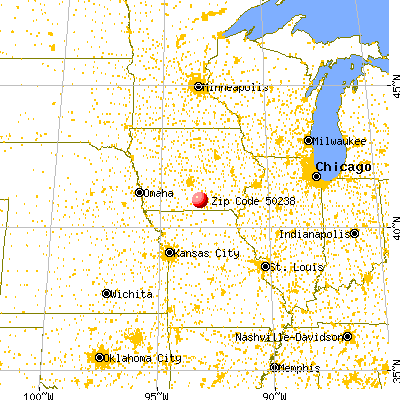
Land area: 116.4 sq. mi. Water area: 2.9 sq. mi.
Population density: 10 people per square mile
(very low).
OSM Map
General Map
Google Map
MSN Map
OSM Map
General Map
Google Map
MSN Map
OSM Map
General Map
Google Map
MSN Map
OSM Map
General Map
Google Map
MSN Map
Please wait while loading the map...
Real estate property taxes paid for housing units in 2022:
This zip code:
1.0% ($881)
Iowa:
1.4% ($2,724)
Median real estate property taxes paid for housing units with mortgages in 2022: $945 (0.9%) Median real estate property taxes paid for housing units with no mortgage in 2022: $652 (1.0%)
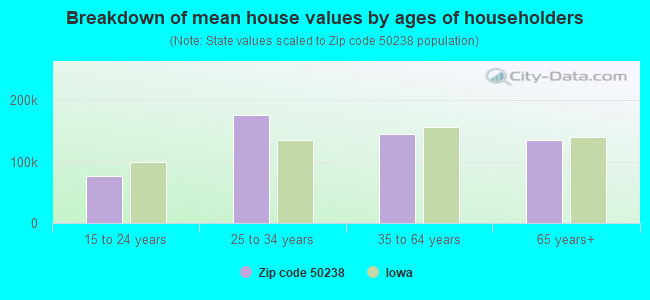
Estimated median house/condo value in 2022: $87,334
50238:
$87,334
Iowa:
$194,600
According to our research of Iowa and other state lists, there was 1 registered sex offender living in 50238 zip code as of June 07, 2024. The ratio of all residents to sex offenders in zip code 50238 is 1,321 to 1. The ratio of registered sex offenders to all residents in this zip code is much lower than the state average.
Median resident age:
This zip code:
48.7 years
Iowa median age:
38.9 years
Average household size:
This zip code:
2.4 people
Iowa:
2.3 people
Averages for the 2020 tax year for zip code 50238, filed in 2021:
Average Adjusted Gross Income (AGI) in 2020: $56,136 (Individual Income Tax Returns)
Here:
$56,136
State:
$71,087
Salary/wage: $45,087 (reported on 80.9% of returns)
Here:
$45,087
State:
$57,361
(% of AGI for various income ranges: 1294.0% for AGIs below $25k, 3446.0% for AGIs $25k-50k, 5675.7% for AGIs $50k-75k, 11483.3% for AGIs $75k-100k, 16583.3% for AGIs $100k-200k)
Taxable interest for individuals: $805 (reported on 40.4% of returns)
This zip code:
$805
Iowa:
$1,633
(% of AGI for various income ranges: 26.0% for AGIs below $25k, 17.0% for AGIs $25k-50k, 14.3% for AGIs $50k-75k, 66.7% for AGIs $75k-100k, 266.7% for AGIs $100k-200k)
Ordinary dividends: $2,014 (reported on 14.9% of returns)
Here:
$2,014
State:
$5,432
(% of AGI for various income ranges: 70.0% for AGIs $25k-50k, 236.7% for AGIs $75k-100k)
Net capital gain/loss in AGI: +$8,338 (reported on 17.0% of returns)
Here:
+$8,338
State:
+$15,243
(% of AGI for various income ranges: 126.0% for AGIs below $25k, 341.4% for AGIs $50k-75k, 1006.7% for AGIs $100k-200k)
Profit/loss from business: +$4,729 (reported on 14.9% of returns)
Here:
+$4,729
State:
+$11,763
(% of AGI for various income ranges: 324.0% for AGIs $25k-50k, 10.0% for AGIs $50k-75k)
Taxable individual retirement arrangement distribution: $11,050 (reported on 8.5% of returns)
50238:
$11,050
Iowa:
$17,324
(% of AGI for various income ranges: 166.0% for AGIs below $25k, 394.3% for AGIs $50k-75k)
Earned income credit: $2,800 (reported on 14.9% of returns)
Here:
$2,800
State:
$2,195
(% of AGI for various income ranges: 109.0% for AGIs below $25k, 87.0% for AGIs $25k-50k)
Percentage of individuals using paid preparers for their 2020 taxes: 95.7%
Here:
96%
State:
95%
(% for various income ranges: 92.9% for AGIs below $25k, 100.0% for AGIs $25k-50k, 100.0% for AGIs $50k-75k, 83.3% for AGIs $75k-100k, 100.0% for AGIs $100k-200k)
Averages for the 2012 tax year for zip code 50238, filed in 2013:
Average Adjusted Gross Income (AGI) in 2012: $42,158 (Individual Income Tax Returns)
Here:
$42,158
State:
$58,860
Salary/wage: $37,210 (reported on 83.3% of returns)
Here:
$37,210
State:
$46,659
(% of AGI for various income ranges: 76.9% for AGIs below $25k, 74.7% for AGIs $25k-50k, 75.6% for AGIs $50k-75k, 77.2% for AGIs $75k-100k, 61.4% for AGIs $100k-200k)
Taxable interest for individuals: $1,694 (reported on 35.4% of returns)
This zip code:
$1,694
Iowa:
$1,537
(% of AGI for various income ranges: 1.5% for AGIs below $25k, 0.8% for AGIs $25k-50k, 2.6% for AGIs $50k-75k, 1.8% for AGIs $75k-100k)
Ordinary dividends: $1,400 (reported on 14.6% of returns)
Here:
$1,400
State:
$4,542
(% of AGI for various income ranges: 1.1% for AGIs below $25k, 1.2% for AGIs $50k-75k, 0.2% for AGIs $75k-100k)
Net capital gain/loss in AGI: +$4,071 (reported on 14.6% of returns)
Here:
+$4,071
State:
+$11,802
Profit/loss from business: +$7,456 (reported on 18.8% of returns)
Here:
+$7,456
State:
+$10,509
(% of AGI for various income ranges: 7.4% for AGIs below $25k, 5.4% for AGIs $25k-50k, 4.5% for AGIs $50k-75k)
Taxable individual retirement arrangement distribution: $4,500 (reported on 8.3% of returns)
50238:
$4,500
Iowa:
$11,773
Total itemized deductions: $16,225 (25% of AGI, reported on 16.7% of returns)
Here:
$16,225
State:
$21,278
Here:
24.7% of AGI
State:
18.9% of AGI
(% of AGI for various income ranges: 18.1% for AGIs below $25k, 7.1% for AGIs $50k-75k, 10.8% for AGIs $75k-100k)
Charity contributions: $3,100 (reported on 10.4% of returns)
Here:
$3,100
State:
$4,044
Taxes paid: $5,500 (reported on 16.7% of returns)
50238:
$5,500
State:
$8,846
(% of AGI for various income ranges: 3.3% for AGIs below $25k, 2.7% for AGIs $50k-75k, 4.9% for AGIs $75k-100k)
Earned income credit: $2,570 (reported on 20.8% of returns)
Here:
$2,570
State:
$2,098
(% of AGI for various income ranges: 7.8% for AGIs below $25k, 1.2% for AGIs $25k-50k)
Percentage of individuals using paid preparers for their 2012 taxes: 79.2%
Here:
79%
State:
65%
(% for various income ranges: 70.0% for AGIs below $25k, 84.6% for AGIs $25k-50k, 87.5% for AGIs $50k-75k, 80.0% for AGIs $75k-100k, 100.0% for AGIs $100k-200k)
Averages for the 2004 tax year for zip code 50238, filed in 2005:
Average Adjusted Gross Income (AGI) in 2004: $33,520 (Individual Income Tax Returns)
Here:
$33,520
State:
$43,875
Salary/wage: $30,742 (reported on 82.1% of returns)
Here:
$30,742
State:
$38,265
(% of AGI for various income ranges: 108.5% for AGIs below $10k, 69.7% for AGIs $10k-25k, 80.9% for AGIs $25k-50k, 85.5% for AGIs $50k-75k, 93.0% for AGIs $75k-100k)
Taxable interest for individuals: $1,467 (reported on 43.5% of returns)
This zip code:
$1,467
Iowa:
$1,768
(% of AGI for various income ranges: 4.9% for AGIs below $10k, 3.7% for AGIs $10k-25k, 1.3% for AGIs $25k-50k, 2.2% for AGIs $50k-75k, 1.6% for AGIs $75k-100k)
Taxable dividends: $1,282 (reported on 22.6% of returns)
Here:
$1,282
State:
$2,510
(% of AGI for various income ranges: 8.2% for AGIs below $10k, 2.2% for AGIs $10k-25k, 0.3% for AGIs $25k-50k, 0.2% for AGIs $50k-75k, 1.4% for AGIs $75k-100k)
Net capital gain/loss: +$8,602 (reported on 23.2% of returns)
Here:
+$8,602
State:
+$6,139
(% of AGI for various income ranges: -2.7% for AGIs below $10k, 6.0% for AGIs $10k-25k, 2.3% for AGIs $25k-50k, 1.4% for AGIs $50k-75k, 25.2% for AGIs $75k-100k)
Profit/loss from business: +$6,092 (reported on 17.9% of returns)
Here:
+$6,092
State:
+$8,574
(% of AGI for various income ranges: 17.0% for AGIs below $10k, 2.7% for AGIs $10k-25k, 5.2% for AGIs $25k-50k, 3.4% for AGIs $50k-75k)
Total itemized deductions: $13,530 (22% of AGI, reported on 17.0% of returns)
Here:
$13,530
State:
$16,976
Here:
22.1% of AGI
State:
20.8% of AGI
(% of AGI for various income ranges: 6.0% for AGIs $10k-25k, 3.9% for AGIs $25k-50k, 8.0% for AGIs $50k-75k, 16.2% for AGIs $75k-100k)
Charity contributions deductions: $1,721 (3% of AGI, reported on 12.5% of returns)
Here:
$1,721
State:
$3,089
Here:
3.0% of AGI
State:
3.6% of AGI
(% of AGI for various income ranges: 6.4% for AGIs below $10k, 0.2% for AGIs $25k-50k, 0.8% for AGIs $50k-75k, 1.5% for AGIs $75k-100k)
Total tax: $3,478 (reported on 73.1% of returns)
50238:
$3,478
State:
$6,177
(% of AGI for various income ranges: 7.3% for AGIs below $10k, 3.4% for AGIs $10k-25k, 6.6% for AGIs $25k-50k, 7.5% for AGIs $50k-75k, 9.8% for AGIs $75k-100k, 13.8% for AGIs over 100k)
Earned income credit: $1,787 (reported on 15.4% of returns)
Here:
$1,787
State:
$1,540
Percentage of individuals using paid preparers for their 2004 taxes: 83.4%
Here:
83%
State:
70%
(% for various income ranges: 68.1% for AGIs below $10k, 86.2% for AGIs $10k-25k, 88.5% for AGIs $25k-50k, 83.8% for AGIs $50k-75k, 118.8% for AGIs $75k-100k)
Household received Food Stamps/SNAP in the past 12 months: 24 Household did not receive Food Stamps/SNAP in the past 12 months: 471
Women who had a birth in the past 12 months: 2 (2 now married, 0 unmarried) Women who did not have a birth in the past 12 months: 172 (115 now married, 56 unmarried)
Housing units in zip code 50238 with a mortgage: 165 (11 second mortgage, 9 both second mortgage and home equity loan) Median monthly owner costs for units with a mortgage: $1,021 Median monthly owner costs for units without a mortgage: $463
Residents with income below the poverty level in 2022:
This zip code:
9.9%
Whole state:
11.0%
Residents with income below 50% of the poverty level in 2022:
This zip code:
8.3%
Whole state:
5.5%
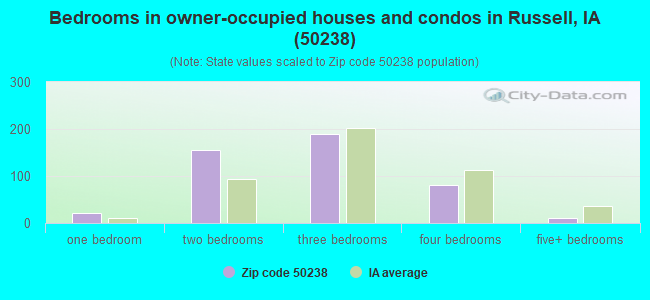
Median number of rooms in houses and condos:
Here:
6.3
State:
6.8
Median number of rooms in apartments:
Here:
6.6
State:
4.2
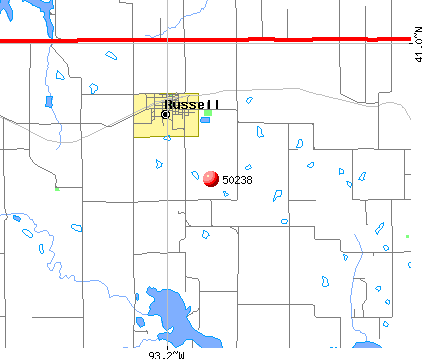
Notable locations in this zip code not listed on our city pages
Churches in zip code 50238 include: Bethlehem Church (A), Center Community Church (B), Bethel Church (C), First Baptist Church (D), Faith United Methodist Church (E). Display/hide their locations on the map
Cemeteries: Bethlehem Cemetery (1), Brown Cemetery (2), Russell Cemetery (3), Greenville Cemetery (4), Stoneking Cemetery (5), Allen Cemetery (6), La Grange Cemetery (7). Display/hide their locations on the map
Parks in zip code 50238 include: Williamson Pond State Public Hunting and Recreation Area (1), Colyn State Wildlife Area (2), Rathbun State Wildlife Area (3). Display/hide their locations on the map
Size of family households: 173 2-persons, 49 3-persons, 21 4-persons, 28 5-persons, 39 6-persons
Size of nonfamily households: 146 1-person, 35 2-persons, 2 3-persons
224 married couples with children.
31 single-parent households (12 men, 19 women).
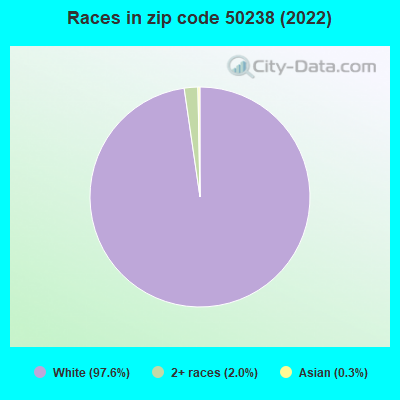
97.4% of residents of 50238 zip code speak English at home.
2.6% of residents speak other Indo-European language at home (93% very well, 7% well).
0.3% of residents speak Asian or Pacific Island language at home (100% very well).
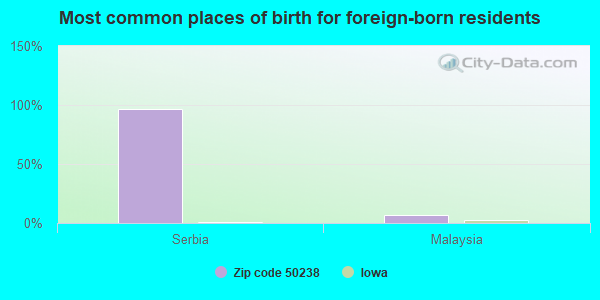
Foreign born population: 30 (2.6%) (89.6% of them are naturalized citizens)
This zip code:
2.6%
Whole state:
6.0%
96%Serbia
7%Malaysia
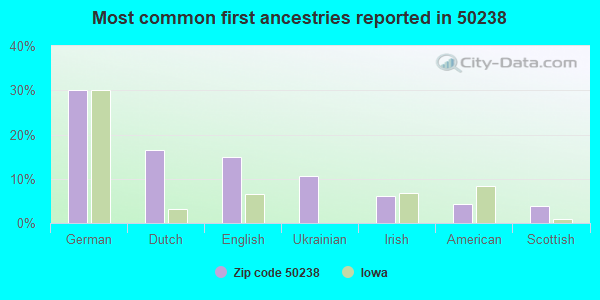
30%German
16%Dutch
15%English
11%Ukrainian
6%Irish
4%American
4%Scottish
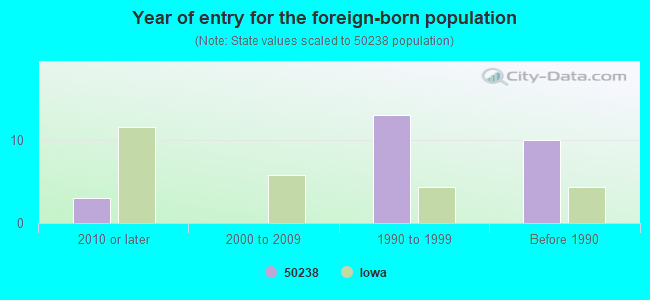
Year of entry for the foreign-born population
32010 or later
02000 to 2009
131990 to 1999
10Before 1990
Facilities with environmental interests located in this zip code:
RUSSELL ELEMENTARY SCHOOL (410 E SMITH in RUSSELL, IA)
(National Center for Education Statistics) - STATE ID-595715 409 Organizations: RUSSELL COMM SCHOOL DISTRICT (SCHOOL DISTRICT)
RUSSELL HIGH SCHOOL (410 E SMITH in RUSSELL, IA)
(National Center for Education Statistics) - STATE ID-595715 109 Organizations: RUSSELL COMM SCHOOL DISTRICT (SCHOOL DISTRICT)
RUSSELL CITY OF STP (CITY CLERK in RUSSELL, IA)
National Pollutant Discharge Elimination System NON-MAJOR (Tracking pollutant discharge elimination systems) - permit Business SIC classification: SEWERAGE SYSTEMS Organizations: CITY OF RUSSELL (CONTACT/OWNER)
ATWELL SVC-FORMER SITE OF (HWY 34 E in RUSSELL, IA)
(Resource Conservation and Recovery Act (tracking hazardous waste))
C & C CYCLE (1.5 MI E OF HWY 34 & 97 in RUSSELL, IA)
(Resource Conservation and Recovery Act (tracking hazardous waste)) Business NAICS classification: MOTORCYCLE DEALERS.
RUSSELL OIL CO (114 PRAIRIE ST in RUSSELL, IA)
(Resource Conservation and Recovery Act (tracking hazardous waste))
RUSSELL CSD (410 E SMITH in RUSSELL, IA)
COMPLIANCE ACTIVITY (Tracking inspections of insecticide, fungicide, and rodenticide, and toxic substances)
RUSSELL MALL (113 W SHAW in RUSSELL, IA)
COMPLIANCE ACTIVITY (Tracking inspections of insecticide, fungicide, and rodenticide, and toxic substances) Alternative names: RIGGS, BARBARA DBA RUSSELL MALL
POLLARD SALVAGE (RR 1 BOX 517 in RUSSELL, IA)
COMPLIANCE ACTIVITY (Tracking inspections of insecticide, fungicide, and rodenticide, and toxic substances)
Housing units lacking complete plumbing facilities: 4.1% Housing units lacking complete kitchen facilities: 3.3%
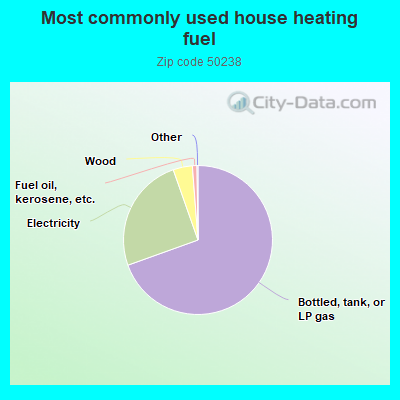
69.8%Bottled, tank, or LP gas
25.2%Electricity
4.2%Wood
1.0%Fuel oil, kerosene, etc.
Population in 1990: 1,018. Population change in the 1990s: +242 (+23.8%).
Place of birth for U.S.-born residents:
This state: 954
Northeast: 11
Midwest: 97
South: 60
West: 19
61% of the 50238 zip code residents lived in the same house 5 years ago. Out of people who lived in different houses, 62% lived in this county. Out of people who lived in different counties, 50% lived in Iowa.
96% of the 50238 zip code residents lived in the same house 1 year ago. Out of people who lived in different houses, 48% moved from this county. Out of people who lived in different houses, 42% moved from different county within same state. Out of people who lived in different houses, 13% moved from different state.
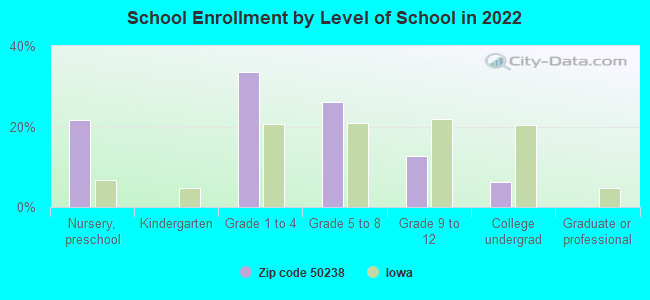
Private vs. public school enrollment:
Students in private schools in grades 1 to 8 (elementary and middle school): 54
Here:
33.0%
Iowa:
10.6%
Students in private schools in grades 9 to 12 (high school):
Here:
0.0%
Iowa:
7.9%
Students in private undergraduate colleges:
Here:
0.0%
Iowa:
23.9%
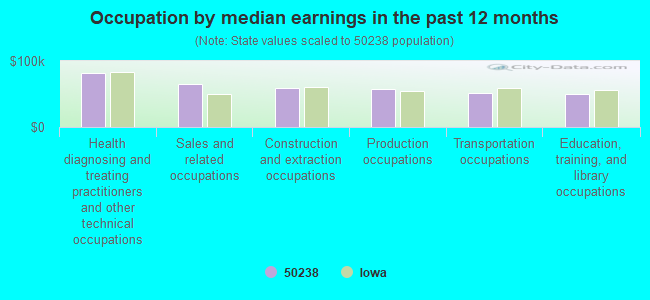
Occupation by median earnings in the past 12 months ($)
81,676Health diagnosing and treating practitioners and other technical occupations
65,201Sales and related occupations
59,198Construction and extraction occupations
56,874Production occupations
50,938Transportation occupations
49,971Education, training, and library occupations
Top industries in this zip code by the number of employees in 2005:
Other Services (except Public Administration): Religious Organizations (1-4: 3)
Other Services (except Public Administration): Commercial and Industrial Machinery and Equipment (except Automotive and Electronic) Repair and Maintenance (1-4: 1)
Finance and Insurance: Commercial Banking (1-4: 1)
Professional, Scientific, and Technical Services: Administrative Management and General Management Consulting Services (1-4: 1)
Construction: Flooring Contractors (1-4: 1)
Fatal accident statistics in 2012:
Fatal accident count: 1
Vehicles involved in fatal accidents: 1
Fatal accidents caused by drunken drivers: 0
Fatalities: 1
Persons involved in fatal accidents: 1
Pedestrians involved in fatal accidents: 0
2002 - 2018 National Fire Incident Reporting System (NFIRS) incidents
According to the data from the years 2002 - 2018 the average number of fires per year is 14. The highest number of fire incidents - 26 took place in 2003, and the least - 1 in 2006. The data has a dropping trend.
When looking into fire subcategories, the most reports belonged to: Outside Fires (56.7%), and Structure Fires (22.4%).
Fire incident types reported to NFIRS in Zip Code 50238


 Nearest zip codes: 52569, 50049, 50272, 50165, 52583, 52581.


 According to the data from the years 2002 - 2018 the average number of fires per year is 14. The highest number of fire incidents - 26 took place in 2003, and the least - 1 in 2006. The data has a dropping trend.
 When looking into fire subcategories, the most reports belonged to: Outside Fires (56.7%), and Structure Fires (22.4%).