Estimated zip code population in 2022: 1,653 Zip code population in 2010: 1,574 Zip code population in 2000: 1,649
Houses and condos: 743 Renter-occupied apartments: 111
% of renters here:
17%
State:
28%
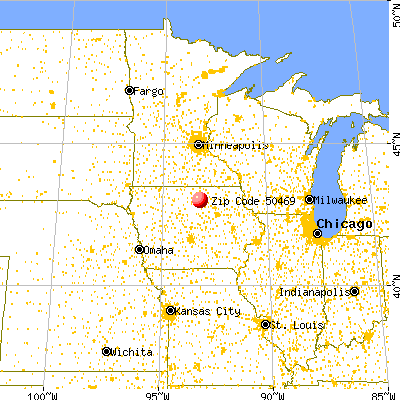
March 2022 cost of living index in zip code 50469: 81.5 (low, U.S. average is 100)
Land area: 88.0 sq. mi. Water area: 0.0 sq. mi.
Population density: 19 people per square mile
(very low).
OSM Map
General Map
Google Map
MSN Map
OSM Map
General Map
Google Map
MSN Map
OSM Map
General Map
Google Map
MSN Map
OSM Map
General Map
Google Map
MSN Map
Please wait while loading the map...
Real estate property taxes paid for housing units in 2022:
This zip code:
1.1% ($2,051)
Iowa:
1.4% ($2,724)
Median real estate property taxes paid for housing units with mortgages in 2022: $2,110 (1.1%) Median real estate property taxes paid for housing units with no mortgage in 2022: $2,024 (1.1%)
Business Search- 14 Million verified businesses
Males: 903
(54.6%)
Females: 750
(45.4%)
For population 25 years and over in 50469:
High school or higher: 95.7%
Bachelor's degree or higher: 21.1%
Graduate or professional degree: 3.8%
Unemployed: 0.7%
Mean travel time to work (commute): 20.8 minutes
For population 15 years and over in 50469:
Never married: 26.8%
Now married: 55.7%
Separated: 0.3%
Widowed: 6.4%
Divorced: 10.8%
Zip code 50469 compared to state average:
Unemployed percentage significantly below state average.
Black race population percentage significantly below state average.
Hispanic race population percentage significantly below state average.
Foreign-born population percentage significantly below state average.
Renting percentage below state average.
Length of stay since moving in significantly above state average.
Percentage of population with a bachelor's degree or higher below state average.
Estimated median house/condo value in 2022: $181,634
50469:
$181,634
Iowa:
$194,600
Median resident age:
This zip code:
42.4 years
Iowa median age:
38.9 years
Average household size:
This zip code:
2.4 people
Iowa:
2.3 people
Averages for the 2020 tax year for zip code 50469, filed in 2021:
Average Adjusted Gross Income (AGI) in 2020: $71,421 (Individual Income Tax Returns)
Here:
$71,421
State:
$71,087
Salary/wage: $55,582 (reported on 83.3% of returns)
Here:
$55,582
State:
$57,361
(% of AGI for various income ranges: 1320.0% for AGIs below $25k, 3691.4% for AGIs $25k-50k, 6752.5% for AGIs $50k-75k, 9761.7% for AGIs $75k-100k, 26003.3% for AGIs $100k-200k)
Taxable interest for individuals: $1,112 (reported on 44.4% of returns)
This zip code:
$1,112
Iowa:
$1,633
(% of AGI for various income ranges: 17.0% for AGIs below $25k, 34.3% for AGIs $25k-50k, 48.8% for AGIs $50k-75k, 43.3% for AGIs $75k-100k, 376.7% for AGIs $100k-200k)
Ordinary dividends: $2,057 (reported on 19.4% of returns)
Here:
$2,057
State:
$5,432
(% of AGI for various income ranges: 50.0% for AGIs $25k-50k, 21.2% for AGIs $50k-75k, 110.0% for AGIs $75k-100k, 225.0% for AGIs $100k-200k)
Net capital gain/loss in AGI: +$4,827 (reported on 20.8% of returns)
Here:
+$4,827
State:
+$15,243
(% of AGI for various income ranges: 70.0% for AGIs $50k-75k, 165.0% for AGIs $75k-100k, 955.0% for AGIs $100k-200k)
Profit/loss from business: +$6,960 (reported on 13.9% of returns)
Here:
+$6,960
State:
+$11,763
(% of AGI for various income ranges: 144.3% for AGIs $25k-50k, 325.0% for AGIs $50k-75k, 390.0% for AGIs $100k-200k)
Taxable individual retirement arrangement distribution: $10,667 (reported on 12.5% of returns)
50469:
$10,667
Iowa:
$17,324
(% of AGI for various income ranges: 207.9% for AGIs $25k-50k, 292.5% for AGIs $50k-75k, 725.0% for AGIs $100k-200k)
Total itemized deductions: $22,400 (reported on 4.2% of returns)
Here:
$22,400
State:
$33,775
(% of AGI for various income ranges: 840.0% for AGIs $50k-75k)
Taxes paid: $6,067 (reported on 4.2% of returns)
50469:
$6,067
State:
$7,704
(% of AGI for various income ranges: 227.5% for AGIs $50k-75k)
Earned income credit: $1,943 (reported on 9.7% of returns)
Here:
$1,943
State:
$2,195
(% of AGI for various income ranges: 61.0% for AGIs below $25k, 53.6% for AGIs $25k-50k)
Percentage of individuals using paid preparers for their 2020 taxes: 94.4%
Here:
94%
State:
95%
(% for various income ranges: 93.3% for AGIs below $25k, 94.7% for AGIs $25k-50k, 100.0% for AGIs $50k-75k, 90.0% for AGIs $75k-100k, 107.1% for AGIs $100k-200k, 0.0% for AGIs over 200k)
Averages for the 2012 tax year for zip code 50469, filed in 2013:
Average Adjusted Gross Income (AGI) in 2012: $56,352 (Individual Income Tax Returns)
Here:
$56,352
State:
$58,860
Salary/wage: $41,090 (reported on 87.3% of returns)
Here:
$41,090
State:
$46,659
(% of AGI for various income ranges: 71.0% for AGIs below $25k, 72.8% for AGIs $25k-50k, 72.7% for AGIs $50k-75k, 61.9% for AGIs $75k-100k, 53.8% for AGIs $100k-200k)
Taxable interest for individuals: $918 (reported on 46.5% of returns)
This zip code:
$918
Iowa:
$1,537
(% of AGI for various income ranges: 1.3% for AGIs below $25k, 0.7% for AGIs $25k-50k, 1.5% for AGIs $50k-75k, 0.5% for AGIs $75k-100k, 0.3% for AGIs $100k-200k)
Ordinary dividends: $3,147 (reported on 21.1% of returns)
Here:
$3,147
State:
$4,542
(% of AGI for various income ranges: 1.2% for AGIs below $25k, 0.5% for AGIs $25k-50k, 0.4% for AGIs $50k-75k, 0.5% for AGIs $75k-100k, 2.4% for AGIs $100k-200k)
Net capital gain/loss in AGI: +$1,627 (reported on 15.5% of returns)
Here:
+$1,627
State:
+$11,802
(% of AGI for various income ranges: 0.2% for AGIs $50k-75k, 1.1% for AGIs $100k-200k)
Profit/loss from business: +$5,354 (reported on 18.3% of returns)
Here:
+$5,354
State:
+$10,509
(% of AGI for various income ranges: 5.6% for AGIs below $25k, 2.8% for AGIs $25k-50k, 1.0% for AGIs $50k-75k, 3.4% for AGIs $75k-100k)
Taxable individual retirement arrangement distribution: $9,291 (reported on 15.5% of returns)
50469:
$9,291
Iowa:
$11,773
(% of AGI for various income ranges: 11.3% for AGIs below $25k, 2.6% for AGIs $50k-75k, 6.2% for AGIs $75k-100k)
Total itemized deductions: $17,440 (20% of AGI, reported on 28.2% of returns)
Here:
$17,440
State:
$21,278
Here:
20.0% of AGI
State:
18.9% of AGI
(% of AGI for various income ranges: 10.5% for AGIs below $25k, 8.5% for AGIs $25k-50k, 7.9% for AGIs $50k-75k, 6.8% for AGIs $75k-100k, 10.1% for AGIs $100k-200k)
Charity contributions: $2,873 (reported on 21.1% of returns)
Here:
$2,873
State:
$4,044
(% of AGI for various income ranges: 1.7% for AGIs below $25k, 1.2% for AGIs $50k-75k, 0.9% for AGIs $75k-100k, 1.5% for AGIs $100k-200k)
Taxes paid: $5,721 (reported on 26.8% of returns)
50469:
$5,721
State:
$8,846
(% of AGI for various income ranges: 1.5% for AGIs below $25k, 1.4% for AGIs $25k-50k, 2.0% for AGIs $50k-75k, 2.5% for AGIs $75k-100k, 4.1% for AGIs $100k-200k)
Earned income credit: $2,038 (reported on 11.3% of returns)
Here:
$2,038
State:
$2,098
(% of AGI for various income ranges: 3.6% for AGIs below $25k, 1.1% for AGIs $25k-50k)
Percentage of individuals using paid preparers for their 2012 taxes: 73.2%
Here:
73%
State:
65%
(% for various income ranges: 63.6% for AGIs below $25k, 76.5% for AGIs $25k-50k, 71.4% for AGIs $50k-75k, 88.9% for AGIs $75k-100k, 77.8% for AGIs $100k-200k)
Averages for the 2004 tax year for zip code 50469, filed in 2005:
Average Adjusted Gross Income (AGI) in 2004: $37,440 (Individual Income Tax Returns)
Here:
$37,440
State:
$43,875
Salary/wage: $33,025 (reported on 85.6% of returns)
Here:
$33,025
State:
$38,265
(% of AGI for various income ranges: 93.7% for AGIs below $10k, 71.9% for AGIs $10k-25k, 78.6% for AGIs $25k-50k, 77.4% for AGIs $50k-75k, 76.0% for AGIs $75k-100k, 63.0% for AGIs over 100k)
Taxable interest for individuals: $1,186 (reported on 56.6% of returns)
This zip code:
$1,186
Iowa:
$1,768
(% of AGI for various income ranges: 4.5% for AGIs below $10k, 3.1% for AGIs $10k-25k, 1.6% for AGIs $25k-50k, 1.7% for AGIs $50k-75k, 1.0% for AGIs $75k-100k, 1.8% for AGIs over 100k)
Taxable dividends: $1,324 (reported on 29.1% of returns)
Here:
$1,324
State:
$2,510
(% of AGI for various income ranges: 1.2% for AGIs below $10k, 1.9% for AGIs $10k-25k, 0.8% for AGIs $25k-50k, 0.8% for AGIs $50k-75k, 0.3% for AGIs $75k-100k, 2.3% for AGIs over 100k)
Net capital gain/loss: +$1,295 (reported on 21.2% of returns)
Here:
+$1,295
State:
+$6,139
(% of AGI for various income ranges: -2.1% for AGIs below $10k, -0.5% for AGIs $10k-25k, 1.4% for AGIs $25k-50k, 0.9% for AGIs $50k-75k, 1.1% for AGIs $75k-100k)
Profit/loss from business: +$2,757 (reported on 15.8% of returns)
Here:
+$2,757
State:
+$8,574
(% of AGI for various income ranges: 10.3% for AGIs below $10k, 2.0% for AGIs $10k-25k, 1.4% for AGIs $25k-50k, 0.9% for AGIs $50k-75k, 0.2% for AGIs $75k-100k)
Profit/loss from farming: +$6,114 (reported on 15.0% of returns)
Here:
+$6,114
State:
-$74
(% of AGI for various income ranges: -7.6% for AGIs below $10k, 2.8% for AGIs $25k-50k, 5.1% for AGIs $50k-75k, 1.4% for AGIs $75k-100k)
IRA payment deduction: $2,467 (reported on 2.1% of returns)
50469:
$2,467
Iowa:
$2,970
Total itemized deductions: $15,652 (24% of AGI, reported on 20.1% of returns)
Here:
$15,652
State:
$16,976
Here:
24.2% of AGI
State:
20.8% of AGI
(% of AGI for various income ranges: 8.2% for AGIs $10k-25k, 8.8% for AGIs $25k-50k, 7.3% for AGIs $50k-75k, 9.3% for AGIs $75k-100k, 11.1% for AGIs over 100k)
Charity contributions deductions: $2,496 (4% of AGI, reported on 17.5% of returns)
Here:
$2,496
State:
$3,089
Here:
3.8% of AGI
State:
3.6% of AGI
(% of AGI for various income ranges: 3.0% for AGIs below $10k, 1.1% for AGIs $25k-50k, 0.8% for AGIs $50k-75k, 1.7% for AGIs $75k-100k, 2.2% for AGIs over 100k)
Total tax: $4,121 (reported on 76.2% of returns)
50469:
$4,121
State:
$6,177
(% of AGI for various income ranges: 3.4% for AGIs below $10k, 3.7% for AGIs $10k-25k, 5.9% for AGIs $25k-50k, 8.8% for AGIs $50k-75k, 10.2% for AGIs $75k-100k, 15.1% for AGIs over 100k)
Earned income credit: $1,488 (reported on 12.0% of returns)
Here:
$1,488
State:
$1,540
Percentage of individuals using paid preparers for their 2004 taxes: 72.9%
Here:
73%
State:
70%
(% for various income ranges: 57.0% for AGIs below $10k, 75.3% for AGIs $10k-25k, 80.1% for AGIs $25k-50k, 76.1% for AGIs $50k-75k, 71.1% for AGIs $75k-100k, 83.3% for AGIs over 100k)
Household received Food Stamps/SNAP in the past 12 months: 18 Household did not receive Food Stamps/SNAP in the past 12 months: 650
Women who had a birth in the past 12 months: 13 (13 now married, 0 unmarried) Women who did not have a birth in the past 12 months: 257 (91 now married, 166 unmarried)
Housing units in zip code 50469 with a mortgage: 241 (7 second mortgage, 5 both second mortgage and home equity loan) Median monthly owner costs for units with a mortgage: $1,260 Median monthly owner costs for units without a mortgage: $520
Residents with income below the poverty level in 2022:
This zip code:
10.6%
Whole state:
11.0%
Residents with income below 50% of the poverty level in 2022:
This zip code:
4.6%
Whole state:
5.5%
Median number of rooms in houses and condos:
Here:
7.9
State:
6.8
Median number of rooms in apartments:
Here:
3.7
State:
4.2
Notable locations in this zip code not listed on our city pages
Notable locations in zip code 50469: Linn Grove Country Club (A), Cartersville Elevator Incorporated Elevator (B), Burchinal (C), Rockwell Fire Department (D), Rockwell Police Department (E), Rockwell Public Library (F), Rockwell City Hall (G), Rockwell - Swaledale Emergency Medical Services (H). Display/hide their locations on the map
Churches in zip code 50469 include: Saint Peter Lutheran Church (A), Sacred Heart Parish (B), First Baptist Church (C), United Methodist Church (D). Display/hide their locations on the map
In group quarters: 30 (-1 institutionalized population)
Size of family households: 230 2-persons, 44 3-persons, 78 4-persons, 61 5-persons, 19 6-persons
Size of nonfamily households: 180 1-person, 50 2-persons
266 married couples with children.
133 single-parent households (71 men, 62 women).
99.4% of residents of 50469 zip code speak English at home.
0.4% of residents speak other Indo-European language at home (100% very well).
0.3% of residents speak Asian or Pacific Island language at home (100% very well).
Foreign born population: 2 (0.1%) (100.0% of them are naturalized citizens)
This zip code:
0.1%
Whole state:
6.0%
50%Honduras
45%German
16%American
12%Norwegian
7%Danish
6%Greek
5%Irish
4%English
Year of entry for the foreign-born population
02010 or later
42000 to 2009
01990 to 1999
2Before 1990
Facilities with environmental interests located in this zip code:
ROCKWELL-SWALEDALE ELEMENTARY SCHOOL (210 S 2ND ST in ROCKWELL, IA)
(National Center for Education Statistics) - STATE ID-175616 409 Organizations: ROCKWELL-SWALEDALE COMM SCHOOL DISTRICT (SCHOOL DISTRICT)
ROCKWELL-SWALEDALE MIDDLE SCH/HIGH SCH (210 S 2ND ST in ROCKWELL, IA)
(National Center for Education Statistics) - STATE ID-175616 109 Organizations: ROCKWELL-SWALEDALE COMM SCHOOL DISTRICT (SCHOOL DISTRICT)
UBBEN QUARRY (17432 110TH STREET in ROCKWELL, IA)
National Pollutant Discharge Elimination System NON-MAJOR (Tracking pollutant discharge elimination systems) - permit Business SIC classification: CRUSHED AND BROKEN LIMESTONE Organizations: MARTIN MARIETTA AGGREGATES (CONTACT/OWNER)
Alternative names: MARTIN MARIETTA AGGREGATES
ROCKWELL COMMUNITY NURSING HOME (707 ELM ST in ROCKWELL, IA)
(Resource Conservation and Recovery Act (tracking hazardous waste))
CAHALAN, JOHN J (RR 1 7444 THRUSH AVE in ROCKWELL, IA)
COMPLIANCE ACTIVITY (Tracking inspections of insecticide, fungicide, and rodenticide, and toxic substances) Alternative names: CAHALAN, JOHN J DBA CAHALAN CUSTOM SPRG
ROCKWELL SWALEDALE COMMUNITY SCHOOL DISTRICT (210 SOUTH 2ND STREET in ROCKWELL, IA)
COMPLIANCE ACTIVITY (Tracking inspections of insecticide, fungicide, and rodenticide, and toxic substances) Alternative names: ROCKWELL SWALEDALE CSD
CENEX LAND O LAKES AGRONOMY CO (RR in CARTERSVILLE, IA)
COMPLIANCE ACTIVITY (Tracking inspections of insecticide, fungicide, and rodenticide, and toxic substances)
Housing units lacking complete plumbing facilities: 6.9% Housing units lacking complete kitchen facilities: 4.2%
41.6%Utility gas
37.0%Bottled, tank, or LP gas
20.7%Electricity
Population in 1990: 2,009.
Place of birth for U.S.-born residents:
This state: 1,393
Northeast: 7
Midwest: 186
South: 14
West: 40
71% of the 50469 zip code residents lived in the same house 5 years ago. Out of people who lived in different houses, 69% lived in this county. Out of people who lived in different counties, 50% lived in Iowa.
97% of the 50469 zip code residents lived in the same house 1 year ago. Out of people who lived in different houses, 68% moved from this county. Out of people who lived in different houses, 44% moved from different county within same state.
Private vs. public school enrollment:
Students in private schools in grades 1 to 8 (elementary and middle school): 57
Here:
27.5%
Iowa:
10.6%
Students in private schools in grades 9 to 12 (high school): 38
Here:
37.7%
Iowa:
7.9%
Students in private undergraduate colleges: 12
Here:
15.7%
Iowa:
23.9%
Occupation by median earnings in the past 12 months ($)
83,805Business and financial operations occupations
77,743Management occupations
67,143Sales and related occupations
62,347Construction and extraction occupations
47,883Community and social service occupations
46,232Healthcare support occupations
Top industries in this zip code by the number of employees in 2005:
Wholesale Trade: Grain and Field Bean Merchant Wholesalers (50-99 employees: 1 establishment, 10-19 employees: 1 establishment)
Health Care and Social Assistance: Nursing Care Facilities (50-99: 1)
Construction: New Single-Family Housing Construction (except Operative Builders) (5-9: 1, 1-4: 2)
Other Services (except Public Administration): Labor Unions and Similar Labor Organizations (5-9: 1)


+$6,114
-$74
(% of AGI for various income ranges: -7.6% for AGIs below $10k, 2.8% for AGIs $25k-50k, 5.1% for AGIs $50k-75k, 1.4% for AGIs $75k-100k) Nearest zip codes: 50475, 50477, 50401, 50433, 50479, 50467.


