Estimated zip code population in 2022: 2,515 Zip code population in 2010: 2,394 Zip code population in 2000: 2,304
Houses and condos: 1,152 Renter-occupied apartments: 246
% of renters here:
23%
State:
28%
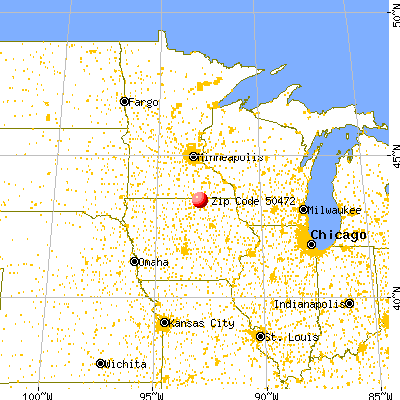
March 2022 cost of living index in zip code 50472: 82.8 (low, U.S. average is 100)
Land area: 121.9 sq. mi. Water area: 0.3 sq. mi.
Population density: 21 people per square mile
(very low).
OSM Map
General Map
Google Map
MSN Map
OSM Map
General Map
Google Map
MSN Map
OSM Map
General Map
Google Map
MSN Map
OSM Map
General Map
Google Map
MSN Map
Please wait while loading the map...
Real estate property taxes paid for housing units in 2022:
This zip code:
1.0% ($2,018)
Iowa:
1.4% ($2,724)
Median real estate property taxes paid for housing units with mortgages in 2022: $1,629 (0.9%) Median real estate property taxes paid for housing units with no mortgage in 2022: $2,358 (1.0%)
Business Search- 14 Million verified businesses
Males: 1,280
(50.9%)
Females: 1,234
(49.1%)
For population 25 years and over in 50472:
High school or higher: 93.3%
Bachelor's degree or higher: 23.8%
Graduate or professional degree: 5.9%
Unemployed: 1.3%
Mean travel time to work (commute): 18.7 minutes
For population 15 years and over in 50472:
Never married: 18.0%
Now married: 63.7%
Separated: 0.0%
Widowed: 8.6%
Divorced: 9.6%
Zip code 50472 compared to state average:
Unemployed percentage below state average.
Black race population percentage significantly below state average.
Hispanic race population percentage significantly below state average.
Median age above state average.
Foreign-born population percentage significantly below state average.
Length of stay since moving in significantly above state average.
Estimated median house/condo value in 2022: $210,352
50472:
$210,352
Iowa:
$194,600
According to our research of Iowa and other state lists, there was 1 registered sex offender living in 50472 zip code as of June 08, 2024. The ratio of all residents to sex offenders in zip code 50472 is 2,247 to 1. The ratio of registered sex offenders to all residents in this zip code is much lower than the state average.
Median resident age:
This zip code:
45.5 years
Iowa median age:
38.9 years
Average household size:
This zip code:
2.3 people
Iowa:
2.3 people
Averages for the 2020 tax year for zip code 50472, filed in 2021:
Average Adjusted Gross Income (AGI) in 2020: $74,185 (Individual Income Tax Returns)
Here:
$74,185
State:
$71,087
Salary/wage: $59,179 (reported on 78.2% of returns)
Here:
$59,179
State:
$57,361
(% of AGI for various income ranges: 1290.0% for AGIs below $25k, 4067.1% for AGIs $25k-50k, 7134.0% for AGIs $50k-75k, 10510.0% for AGIs $75k-100k, 20169.0% for AGIs $100k-200k)
Taxable interest for individuals: $1,354 (reported on 51.8% of returns)
This zip code:
$1,354
Iowa:
$1,633
(% of AGI for various income ranges: 40.6% for AGIs below $25k, 62.4% for AGIs $25k-50k, 95.0% for AGIs $50k-75k, 73.8% for AGIs $75k-100k, 237.0% for AGIs $100k-200k)
Ordinary dividends: $5,037 (reported on 27.3% of returns)
Here:
$5,037
State:
$5,432
(% of AGI for various income ranges: 45.0% for AGIs below $25k, 67.1% for AGIs $25k-50k, 161.0% for AGIs $50k-75k, 200.0% for AGIs $75k-100k, 373.0% for AGIs $100k-200k)
Net capital gain/loss in AGI: +$15,423 (reported on 23.6% of returns)
Here:
+$15,423
State:
+$15,243
(% of AGI for various income ranges: 24.4% for AGIs below $25k, 24.7% for AGIs $25k-50k, 182.0% for AGIs $50k-75k, 362.5% for AGIs $75k-100k, 1000.0% for AGIs $100k-200k)
Profit/loss from business: +$12,352 (reported on 19.1% of returns)
Here:
+$12,352
State:
+$11,763
(% of AGI for various income ranges: 98.1% for AGIs below $25k, 269.4% for AGIs $25k-50k, 353.0% for AGIs $50k-75k, 477.5% for AGIs $75k-100k, 1244.0% for AGIs $100k-200k)
Taxable individual retirement arrangement distribution: $9,467 (reported on 13.6% of returns)
50472:
$9,467
Iowa:
$17,324
(% of AGI for various income ranges: 90.6% for AGIs below $25k, 125.3% for AGIs $25k-50k, 209.0% for AGIs $50k-75k, 366.2% for AGIs $75k-100k, 560.0% for AGIs $100k-200k)
Total itemized deductions: $37,450 (reported on 5.5% of returns)
Here:
$37,450
State:
$33,775
(% of AGI for various income ranges: 616.5% for AGIs $25k-50k, 1199.0% for AGIs $100k-200k)
Charity contributions: $10,360 (reported on 4.5% of returns)
Here:
$10,360
State:
$13,075
(% of AGI for various income ranges: 26.9% for AGIs below $25k, 475.0% for AGIs $100k-200k)
Taxes paid: $6,883 (reported on 5.5% of returns)
50472:
$6,883
State:
$7,704
(% of AGI for various income ranges: 83.5% for AGIs $25k-50k, 271.0% for AGIs $100k-200k)
Earned income credit: $2,211 (reported on 8.2% of returns)
Here:
$2,211
State:
$2,195
(% of AGI for various income ranges: 59.4% for AGIs below $25k, 61.2% for AGIs $25k-50k)
Percentage of individuals using paid preparers for their 2020 taxes: 95.5%
Here:
95%
State:
95%
(% for various income ranges: 96.2% for AGIs below $25k, 96.2% for AGIs $25k-50k, 94.1% for AGIs $50k-75k, 92.9% for AGIs $75k-100k, 95.5% for AGIs $100k-200k, 100.0% for AGIs over 200k)
Averages for the 2012 tax year for zip code 50472, filed in 2013:
Average Adjusted Gross Income (AGI) in 2012: $59,682 (Individual Income Tax Returns)
Here:
$59,682
State:
$58,860
Salary/wage: $46,438 (reported on 78.8% of returns)
Here:
$46,438
State:
$46,659
(% of AGI for various income ranges: 66.1% for AGIs below $25k, 70.1% for AGIs $25k-50k, 67.5% for AGIs $50k-75k, 66.4% for AGIs $75k-100k, 65.6% for AGIs $100k-200k, 33.3% for AGIs over 200k)
Taxable interest for individuals: $1,465 (reported on 51.9% of returns)
This zip code:
$1,465
Iowa:
$1,537
(% of AGI for various income ranges: 2.8% for AGIs below $25k, 1.2% for AGIs $25k-50k, 1.0% for AGIs $50k-75k, 0.9% for AGIs $75k-100k, 1.1% for AGIs $100k-200k, 1.7% for AGIs over 200k)
Ordinary dividends: $2,537 (reported on 26.0% of returns)
Here:
$2,537
State:
$4,542
(% of AGI for various income ranges: 1.4% for AGIs below $25k, 0.6% for AGIs $25k-50k, 0.6% for AGIs $50k-75k, 1.0% for AGIs $75k-100k, 1.8% for AGIs $100k-200k, 0.7% for AGIs over 200k)
Net capital gain/loss in AGI: +$10,505 (reported on 20.2% of returns)
Here:
+$10,505
State:
+$11,802
(% of AGI for various income ranges: 1.2% for AGIs $25k-50k, 2.4% for AGIs $50k-75k, 1.8% for AGIs $75k-100k, 1.2% for AGIs $100k-200k, 14.1% for AGIs over 200k)
Profit/loss from business: +$8,552 (reported on 20.2% of returns)
Here:
+$8,552
State:
+$10,509
(% of AGI for various income ranges: 4.5% for AGIs below $25k, 2.7% for AGIs $25k-50k, 4.6% for AGIs $50k-75k, 4.1% for AGIs $75k-100k, 2.6% for AGIs $100k-200k)
Taxable individual retirement arrangement distribution: $7,336 (reported on 13.5% of returns)
50472:
$7,336
Iowa:
$11,773
(% of AGI for various income ranges: 3.4% for AGIs below $25k, 5.8% for AGIs $25k-50k, 2.0% for AGIs $75k-100k, 1.0% for AGIs $100k-200k)
Total itemized deductions: $18,150 (18% of AGI, reported on 28.8% of returns)
Here:
$18,150
State:
$21,278
Here:
18.2% of AGI
State:
18.9% of AGI
(% of AGI for various income ranges: 14.1% for AGIs below $25k, 8.1% for AGIs $25k-50k, 6.8% for AGIs $50k-75k, 6.4% for AGIs $75k-100k, 10.9% for AGIs $100k-200k, 8.3% for AGIs over 200k)
Charity contributions: $3,440 (reported on 24.0% of returns)
Here:
$3,440
State:
$4,044
(% of AGI for various income ranges: 0.7% for AGIs below $25k, 1.4% for AGIs $25k-50k, 0.9% for AGIs $50k-75k, 0.6% for AGIs $75k-100k, 1.5% for AGIs $100k-200k, 2.8% for AGIs over 200k)
Taxes paid: $7,323 (reported on 28.8% of returns)
50472:
$7,323
State:
$8,846
(% of AGI for various income ranges: 1.4% for AGIs below $25k, 1.9% for AGIs $25k-50k, 2.3% for AGIs $50k-75k, 2.8% for AGIs $75k-100k, 5.5% for AGIs $100k-200k, 4.3% for AGIs over 200k)
Earned income credit: $2,060 (reported on 9.6% of returns)
Here:
$2,060
State:
$2,098
(% of AGI for various income ranges: 3.8% for AGIs below $25k, 0.7% for AGIs $25k-50k)
Percentage of individuals using paid preparers for their 2012 taxes: 77.9%
Here:
78%
State:
65%
(% for various income ranges: 67.6% for AGIs below $25k, 78.3% for AGIs $25k-50k, 82.4% for AGIs $50k-75k, 84.6% for AGIs $75k-100k, 85.7% for AGIs $100k-200k, 100.0% for AGIs over 200k)
Averages for the 2004 tax year for zip code 50472, filed in 2005:
Average Adjusted Gross Income (AGI) in 2004: $41,962 (Individual Income Tax Returns)
Here:
$41,962
State:
$43,875
Salary/wage: $35,260 (reported on 82.2% of returns)
Here:
$35,260
State:
$38,265
(% of AGI for various income ranges: 93.9% for AGIs below $10k, 60.4% for AGIs $10k-25k, 75.6% for AGIs $25k-50k, 76.8% for AGIs $50k-75k, 74.5% for AGIs $75k-100k, 50.7% for AGIs over 100k)
Taxable interest for individuals: $1,745 (reported on 63.3% of returns)
This zip code:
$1,745
Iowa:
$1,768
(% of AGI for various income ranges: 12.3% for AGIs below $10k, 7.2% for AGIs $10k-25k, 2.9% for AGIs $25k-50k, 1.3% for AGIs $50k-75k, 1.4% for AGIs $75k-100k, 2.1% for AGIs over 100k)
Taxable dividends: $1,296 (reported on 30.7% of returns)
Here:
$1,296
State:
$2,510
(% of AGI for various income ranges: 5.0% for AGIs below $10k, 1.0% for AGIs $10k-25k, 0.8% for AGIs $25k-50k, 1.0% for AGIs $50k-75k, 0.6% for AGIs $75k-100k, 1.0% for AGIs over 100k)
Net capital gain/loss: +$8,861 (reported on 24.4% of returns)
Here:
+$8,861
State:
+$6,139
(% of AGI for various income ranges: -4.5% for AGIs below $10k, 1.0% for AGIs $10k-25k, 2.1% for AGIs $25k-50k, 1.6% for AGIs $50k-75k, 2.8% for AGIs $75k-100k, 17.4% for AGIs over 100k)
Profit/loss from business: +$9,544 (reported on 19.0% of returns)
Here:
+$9,544
State:
+$8,574
(% of AGI for various income ranges: 7.0% for AGIs below $10k, 4.8% for AGIs $10k-25k, 3.1% for AGIs $25k-50k, 2.8% for AGIs $50k-75k, 2.2% for AGIs $75k-100k, 8.8% for AGIs over 100k)
Profit/loss from farming: +$4,150 (reported on 17.6% of returns)
Here:
+$4,150
State:
-$74
(% of AGI for various income ranges: -3.9% for AGIs below $10k, -0.9% for AGIs $10k-25k, -0.6% for AGIs $25k-50k, 4.2% for AGIs $50k-75k, 6.2% for AGIs $75k-100k)
IRA payment deduction: $3,397 (reported on 6.1% of returns)
50472:
$3,397
Iowa:
$2,970
Total itemized deductions: $15,547 (24% of AGI, reported on 26.1% of returns)
Here:
$15,547
State:
$16,976
Here:
23.7% of AGI
State:
20.8% of AGI
(% of AGI for various income ranges: 43.0% for AGIs below $10k, 14.8% for AGIs $10k-25k, 8.4% for AGIs $25k-50k, 6.2% for AGIs $50k-75k, 8.0% for AGIs $75k-100k, 12.5% for AGIs over 100k)
Charity contributions deductions: $3,140 (5% of AGI, reported on 22.6% of returns)
Here:
$3,140
State:
$3,089
Here:
4.6% of AGI
State:
3.6% of AGI
(% of AGI for various income ranges: 2.0% for AGIs $10k-25k, 0.9% for AGIs $25k-50k, 0.8% for AGIs $50k-75k, 1.2% for AGIs $75k-100k, 4.1% for AGIs over 100k)
Total tax: $4,968 (reported on 79.2% of returns)
50472:
$4,968
State:
$6,177
(% of AGI for various income ranges: 3.4% for AGIs below $10k, 4.5% for AGIs $10k-25k, 6.4% for AGIs $25k-50k, 8.5% for AGIs $50k-75k, 9.8% for AGIs $75k-100k, 16.3% for AGIs over 100k)
Earned income credit: $1,573 (reported on 9.4% of returns)
Here:
$1,573
State:
$1,540
Percentage of individuals using paid preparers for their 2004 taxes: 79.6%
Here:
80%
State:
70%
(% for various income ranges: 70.8% for AGIs below $10k, 75.2% for AGIs $10k-25k, 83.0% for AGIs $25k-50k, 84.8% for AGIs $50k-75k, 81.4% for AGIs $75k-100k, 84.2% for AGIs over 100k)
Household received Food Stamps/SNAP in the past 12 months: 31 Household did not receive Food Stamps/SNAP in the past 12 months: 1,066
Women who had a birth in the past 12 months: 40 (27 now married, 13 unmarried) Women who did not have a birth in the past 12 months: 397 (252 now married, 144 unmarried)
Housing units in zip code 50472 with a mortgage: 399 (11 second mortgage, 3 home equity loan, 7 both second mortgage and home equity loan) Houses without a mortgage: 3
Median monthly owner costs for units with a mortgage: $1,179 Median monthly owner costs for units without a mortgage: $634
Residents with income below the poverty level in 2022:
This zip code:
6.0%
Whole state:
11.0%
Residents with income below 50% of the poverty level in 2022:
This zip code:
3.7%
Whole state:
5.5%
Median number of rooms in houses and condos:
Here:
7.7
State:
6.8
Median number of rooms in apartments:
Here:
6.5
State:
4.2
Notable locations in this zip code not listed on our city pages
Notable locations in zip code 50472: Otranto (A), Newburg (B), Deer Creek Rest Area (C), Otranto (D), Northwood Co-op Elevator (E), Carpenter (F), Toeterville (G), Acorn Park Golf and Recreation (H), Saint Ansgar (I), Mona (J), Nissen Public Library (K), Saint Ansgar City Police Department (L), Saint Ansgar City Hall (M), Saint Ansgar Fire Department (N), Saint Ansgar Rescue Service (O). Display/hide their locations on the map
Churches in zip code 50472 include: Deer Creek Church (A), First Lutheran Church (B), Immanuel Lutheran Church (C), United Methodist Church (D), Saint Ansgar Catholic Church (E), Saint Ansgar Baptist Church (F), Saint Peter Lutheran Church (G). Display/hide their locations on the map
Cemeteries: Ogden Cemetery (1), Blakestad Cemetery (2), Pleasant Hill Cemetery (3), Priem Cemetery (4), Deer Creek Cemetery (5), NE Lutheran Congregational Carpenter Cemetery (6), McKinley Cemetery (7). Display/hide their locations on the map
Parks in zip code 50472 include: Hamlin Garland Wildlife Area (1), Clausen City Park (2), Cedar Block Wildlife Area (3), Nelson Paradise Wildlife Area (4), County 'S' Refuge (5), Halverson Park (6), Otranto Park (7). Display/hide their locations on the map
In group quarters: 37 (-1 institutionalized population)
Size of family households: 407 2-persons, 137 3-persons, 104 4-persons, 75 5-persons, 9 6-persons, 6 7-or-more-persons
Size of nonfamily households: 324 1-person, 22 2-persons, 2 7-or-more-persons
465 married couples with children.
73 single-parent households (29 men, 44 women).
97.7% of residents of 50472 zip code speak English at home.
1.0% of residents speak Spanish at home (83% very well, 17% well).
0.9% of residents speak other Indo-European language at home (100% very well).
0.6% of residents speak Asian or Pacific Island language at home (69% very well, 23% not well, 8% not at all).
Foreign born population: 10 (0.4%) (90.3% of them are naturalized citizens)
This zip code:
0.4%
Whole state:
6.0%
70%Bhutan
10%Nicaragua
45%German
16%American
12%Norwegian
4%English
3%Czech
2%Swiss
1%Scandinavian
Year of entry for the foreign-born population
232010 or later
02000 to 2009
31990 to 1999
17Before 1990
Facilities with environmental interests located in this zip code:
ST ANSGAR HIGH SCHOOL (206 E 8TH ST in SAINT ANSGAR, IA)
(National Center for Education Statistics) - STATE ID-665751 109 (Resource Conservation and Recovery Act (tracking hazardous waste)) Conditionally Exempt Small Quantity Generators, less than 100 kg/month of hazardous waste (Resource Conservation and Recovery Act (tracking hazardous waste)) Organizations: ST ANSGAR COMMUNITY SCHOOL DISTRICT (CONTACT/OPERATOR)
, ST ANSGAR COMMUNITY SCHOOLS (CONTACT/OWNER)
, ST ANSGAR COMM SCHOOL DISTRICT (SCHOOL DISTRICT)
ST ANSGAR ELEMENTARY SCHOOL (202 S. WASHINGTON STREET in ST ANSGAR, IA)
(National Center for Education Statistics) - STATE ID-665751 427 Organizations: ST ANSGAR COMM SCHOOL DISTRICT (SCHOOL DISTRICT)
ST. ANSGAR MIDDLE SCHOOL (206 EAST 8TH STREET in ST. ANSGAR, IA)
(National Center for Education Statistics) - STATE ID-665751 209 Organizations: ST ANSGAR COMM SCHOOL DISTRICT (SCHOOL DISTRICT)
ASPEL QUARRY (3188 460TH in SAINT ANSGAR, IA)
National Pollutant Discharge Elimination System NON-MAJOR (Tracking pollutant discharge elimination systems) - permit Business SIC classification: CRUSHED AND BROKEN LIMESTONE Organizations: L. R. FALK CONSTRUCTION CO. (CONTACT/OWNER)
Alternative names: L R FALK CONSTRUCTION CO
DRUG ENFORCEMENT AGENCY (DEA) (715 W 4TH ST in ST ANSGAR, IA)
(Resource Conservation and Recovery Act (tracking hazardous waste))
ST. ANSGAR CITY OF STP (1450 420TH STREET in ST. ANSGAR, IA)
National Pollutant Discharge Elimination System NON-MAJOR (Tracking pollutant discharge elimination systems) - permit Business SIC classification: SEWERAGE SYSTEMS Organizations: CITY OF ST. ANSGAR (CONTACT/OWNER)
CROELL REDI MIX INCORPORATED (308 SOUTH PLEASANT STREET in SAINT ANSGAR, IA)
AIR MINOR (AIRS/AFS) Business SIC classification: READY-MIXED CONCRETE
BOB'S LP & CHEMICAL INC (RR 1 in SAINT ANSGAR, IA)
COMPLIANCE ACTIVITY (Tracking inspections of insecticide, fungicide, and rodenticide, and toxic substances) Alternative names: BOB'S L P & CHEMICAL INC
ABSOLUTE ENERGY LLC (1370 STATE LINE RD in ST ANSGAR (MONA), IA)
AIR SYNTHETIC MINOR (AIRS/AFS) Business SIC classification: INDUSTRIAL ORGANIC CHEMICALS
HEARTLAND POWER COOPERATIVE (605 E 4TH STREET in SAINT ANSGAR, IA)
COMPLIANCE ACTIVITY (Tracking inspections of insecticide, fungicide, and rodenticide, and toxic substances)
Housing units lacking complete plumbing facilities: 1.6% Housing units lacking complete kitchen facilities: 0.2%
42.1%Bottled, tank, or LP gas
40.7%Utility gas
14.1%Electricity
1.5%Wood
1.5%Other fuel
Population in 1990: 2,401.
Place of birth for U.S.-born residents:
This state: 1,729
Northeast: 71
Midwest: 561
South: 53
West: 44
69% of the 50472 zip code residents lived in the same house 5 years ago. Out of people who lived in different houses, 47% lived in this county. Out of people who lived in different counties, 50% lived in Iowa.
95% of the 50472 zip code residents lived in the same house 1 year ago. Out of people who lived in different houses, 58% moved from this county. Out of people who lived in different houses, 12% moved from different county within same state. Out of people who lived in different houses, 20% moved from different state. Out of people who lived in different houses, 13% moved from abroad.
Private vs. public school enrollment:
Students in private schools in grades 1 to 8 (elementary and middle school): 17
Here:
9.1%
Iowa:
10.6%
Students in private schools in grades 9 to 12 (high school):
Here:
0.0%
Iowa:
7.9%
Students in private undergraduate colleges:
Here:
2.3%
Iowa:
23.9%
Occupation by median earnings in the past 12 months ($)
98,779Computer and mathematical occupations
97,691Business and financial operations occupations
92,433Installation, maintenance, and repair occupations
73,525Sales and related occupations
69,475Management occupations
68,141Community and social service occupations
Top industries in this zip code by the number of employees in 2005:
Health Care and Social Assistance: Nursing Care Facilities (50-99 employees: 1 establishment)
Accommodation and Food Services: Full-Service Restaurants (20-49: 1, 10-19: 2)
Wholesale Trade: Grain and Field Bean Merchant Wholesalers (20-49: 1, 10-19: 1)
Other Services (except Public Administration): Religious Organizations (20-49: 1, 5-9: 1, 1-4: 2)
Mining: Crushed and Broken Limestone Mining and Quarrying (20-49: 1)
Finance and Insurance: Commercial Banking (20-49: 1)
Other Services (except Public Administration): Other Automotive Mechanical and Electrical Repair and Maintenance (20-49: 1)
Wholesale Trade: Farm and Garden Machinery and Equipment Merchant Wholesalers (10-19: 1)
People in group quarters in 2010:
48 people in nursing facilities/skilled-nursing facilities
People in group quarters in 2000:
68 people in nursing homes
11 people in other noninstitutional group quarters
Fatal accident statistics in 2011:
Fatal accident count: 1
Vehicles involved in fatal accidents: 2
Fatal accidents caused by drunken drivers: 0
Fatalities: 1
Persons involved in fatal accidents: 2
Pedestrians involved in fatal accidents: 0
Fatal accident statistics in 2010:
Fatal accident count: 1
Vehicles involved in fatal accidents: 1
Fatal accidents caused by drunken drivers: 0
Fatalities: 2
Persons involved in fatal accidents: 2
Pedestrians involved in fatal accidents: 0
2002 - 2018 National Fire Incident Reporting System (NFIRS) incidents
According to the data from the years 2002 - 2018 the average number of fire incidents per year is 10. The highest number of fire incidents - 19 took place in 2011, and the least - 0 in 2010. The data has a dropping trend.
When looking into fire subcategories, the most incidents belonged to: Structure Fires (44.3%), and Outside Fires (41.3%).
Fire incident types reported to NFIRS in Zip Code 50472


+$4,150
-$74
(% of AGI for various income ranges: -3.9% for AGIs below $10k, -0.9% for AGIs $10k-25k, -0.6% for AGIs $25k-50k, 4.2% for AGIs $50k-75k, 6.2% for AGIs $75k-100k)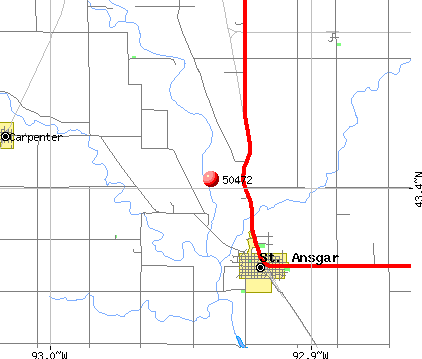 Nearest zip codes: 50426, 55953, 50461, 50440, 50476, 50454.


 According to the data from the years 2002 - 2018 the average number of fire incidents per year is 10. The highest number of fire incidents - 19 took place in 2011, and the least - 0 in 2010. The data has a dropping trend.
 When looking into fire subcategories, the most incidents belonged to: Structure Fires (44.3%), and Outside Fires (41.3%).