Estimated zip code population in 2022: 1,588 Zip code population in 2010: 1,398 Zip code population in 2000: 1,498
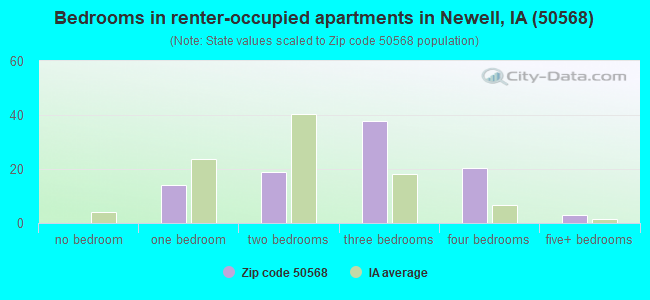
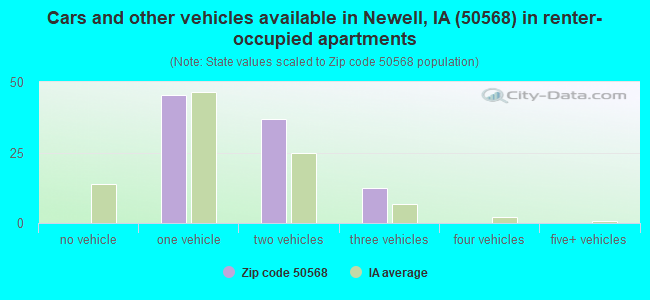
Houses and condos: 582 Renter-occupied apartments: 95
% of renters here:
17%
State:
28%
March 2022 cost of living index in zip code 50568: 81.5 (low, U.S. average is 100)
Land area: 84.9 sq. mi. Water area: 0.1 sq. mi.
Population density: 19 people per square mile
(very low).
OSM Map
General Map
Google Map
MSN Map
OSM Map
General Map
Google Map
MSN Map
OSM Map
General Map
Google Map
MSN Map
OSM Map
General Map
Google Map
MSN Map
Please wait while loading the map...
Real estate property taxes paid for housing units in 2022:
This zip code:
1.2% ($1,585)
Iowa:
1.4% ($2,724)
Median real estate property taxes paid for housing units with mortgages in 2022: $1,615 (1.1%) Median real estate property taxes paid for housing units with no mortgage in 2022: $1,550 (1.3%)
Business Search- 14 Million verified businesses
Males: 876
(55.2%)
Females: 712
(44.8%)
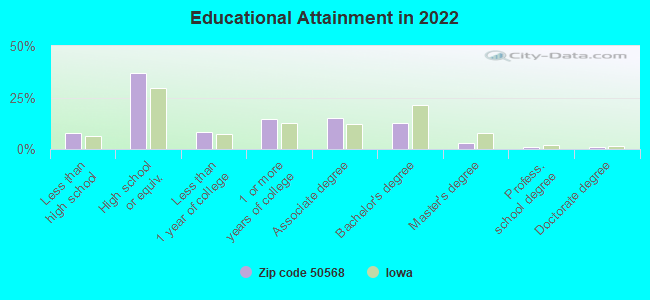
For population 25 years and over in 50568:
High school or higher: 90.3%
Bachelor's degree or higher: 17.1%
Graduate or professional degree: 4.9%
Unemployed: 4.4%
Mean travel time to work (commute): 21.3 minutes
For population 15 years and over in 50568:
Never married: 25.6%
Now married: 56.8%
Separated: 3.0%
Widowed: 4.4%
Divorced: 10.3%
Zip code 50568 compared to state average:
Black race population percentage significantly below state average.
Foreign-born population percentage below state average.
Renting percentage below state average.
Length of stay since moving in significantly above state average.
Number of college students below state average.
Percentage of population with a bachelor's degree or higher below state average.
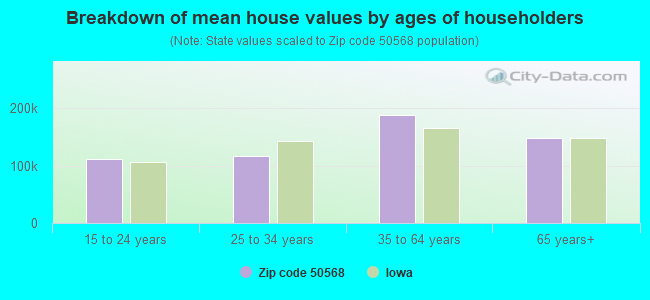
Estimated median house/condo value in 2022: $131,484
50568:
$131,484
Iowa:
$194,600
According to our research of Iowa and other state lists, there were 2 registered sex offenders living in 50568 zip code as of May 28, 2024. The ratio of all residents to sex offenders in zip code 50568 is 840 to 1. The ratio of registered sex offenders to all residents in this zip code is lower than the state average.
Median resident age:
This zip code:
35.6 years
Iowa median age:
38.9 years
Average household size:
This zip code:
2.8 people
Iowa:
2.3 people
Averages for the 2020 tax year for zip code 50568, filed in 2021:
Average Adjusted Gross Income (AGI) in 2020: $60,222 (Individual Income Tax Returns)
Here:
$60,222
State:
$71,087
Salary/wage: $47,652 (reported on 83.6% of returns)
Here:
$47,652
State:
$57,361
(% of AGI for various income ranges: 1305.0% for AGIs below $25k, 4059.2% for AGIs $25k-50k, 6386.7% for AGIs $50k-75k, 11514.0% for AGIs $75k-100k, 17486.0% for AGIs $100k-200k)
Taxable interest for individuals: $1,026 (reported on 34.3% of returns)
This zip code:
$1,026
Iowa:
$1,633
(% of AGI for various income ranges: 13.3% for AGIs below $25k, 15.8% for AGIs $25k-50k, 62.2% for AGIs $50k-75k, 46.0% for AGIs $75k-100k, 244.0% for AGIs $100k-200k)
Ordinary dividends: $1,600 (reported on 13.4% of returns)
Here:
$1,600
State:
$5,432
(% of AGI for various income ranges: 15.0% for AGIs below $25k, 36.7% for AGIs $50k-75k, 66.0% for AGIs $75k-100k, 120.0% for AGIs $100k-200k)
Net capital gain/loss in AGI: +$4,100 (reported on 16.4% of returns)
Here:
+$4,100
State:
+$15,243
(% of AGI for various income ranges: 10.0% for AGIs below $25k, 57.8% for AGIs $50k-75k, 774.0% for AGIs $100k-200k)
Profit/loss from business: +$13,969 (reported on 19.4% of returns)
Here:
+$13,969
State:
+$11,763
(% of AGI for various income ranges: 114.2% for AGIs below $25k, 305.8% for AGIs $25k-50k, 331.1% for AGIs $50k-75k, 598.0% for AGIs $75k-100k, 1430.0% for AGIs $100k-200k)
Taxable individual retirement arrangement distribution: $8,743 (reported on 10.4% of returns)
50568:
$8,743
Iowa:
$17,324
(% of AGI for various income ranges: 198.3% for AGIs $25k-50k, 748.0% for AGIs $75k-100k)
Earned income credit: $2,689 (reported on 13.4% of returns)
Here:
$2,689
State:
$2,195
(% of AGI for various income ranges: 113.3% for AGIs below $25k, 88.3% for AGIs $25k-50k)
Percentage of individuals using paid preparers for their 2020 taxes: 92.5%
Here:
93%
State:
95%
(% for various income ranges: 88.9% for AGIs below $25k, 93.8% for AGIs $25k-50k, 92.3% for AGIs $50k-75k, 100.0% for AGIs $75k-100k, 90.9% for AGIs $100k-200k)
Averages for the 2012 tax year for zip code 50568, filed in 2013:
Average Adjusted Gross Income (AGI) in 2012: $51,490 (Individual Income Tax Returns)
Here:
$51,490
State:
$58,860
Salary/wage: $39,239 (reported on 82.3% of returns)
Here:
$39,239
State:
$46,659
(% of AGI for various income ranges: 71.6% for AGIs below $25k, 72.6% for AGIs $25k-50k, 73.8% for AGIs $50k-75k, 72.9% for AGIs $75k-100k, 44.8% for AGIs $100k-200k)
Taxable interest for individuals: $1,193 (reported on 43.5% of returns)
This zip code:
$1,193
Iowa:
$1,537
(% of AGI for various income ranges: 1.5% for AGIs below $25k, 0.9% for AGIs $25k-50k, 1.1% for AGIs $50k-75k, 0.2% for AGIs $75k-100k, 1.3% for AGIs $100k-200k)
Ordinary dividends: $1,715 (reported on 21.0% of returns)
Here:
$1,715
State:
$4,542
(% of AGI for various income ranges: 1.2% for AGIs below $25k, 0.8% for AGIs $25k-50k, 0.8% for AGIs $50k-75k, 0.8% for AGIs $100k-200k)
Net capital gain/loss in AGI: +$1,040 (reported on 16.1% of returns)
Here:
+$1,040
State:
+$11,802
(% of AGI for various income ranges: 0.7% for AGIs $25k-50k, 4.3% for AGIs $50k-75k, 0.5% for AGIs $100k-200k)
Profit/loss from business: +$9,667 (reported on 19.4% of returns)
Here:
+$9,667
State:
+$10,509
(% of AGI for various income ranges: 7.1% for AGIs below $25k, 6.6% for AGIs $25k-50k, 3.7% for AGIs $50k-75k, 6.2% for AGIs $75k-100k)
Taxable individual retirement arrangement distribution: $8,000 (reported on 9.7% of returns)
50568:
$8,000
Iowa:
$11,773
Total itemized deductions: $19,407 (21% of AGI, reported on 24.2% of returns)
Here:
$19,407
State:
$21,278
Here:
21.2% of AGI
State:
18.9% of AGI
(% of AGI for various income ranges: 20.9% for AGIs below $25k, 7.8% for AGIs $25k-50k, 12.1% for AGIs $50k-75k, 9.8% for AGIs $100k-200k)
Charity contributions: $4,117 (reported on 19.4% of returns)
Here:
$4,117
State:
$4,044
(% of AGI for various income ranges: 3.7% for AGIs below $25k, 1.5% for AGIs $50k-75k, 2.6% for AGIs $100k-200k)
Taxes paid: $5,860 (reported on 24.2% of returns)
50568:
$5,860
State:
$8,846
(% of AGI for various income ranges: 2.4% for AGIs below $25k, 1.6% for AGIs $25k-50k, 2.8% for AGIs $50k-75k, 4.7% for AGIs $100k-200k)
Earned income credit: $2,412 (reported on 12.9% of returns)
Here:
$2,412
State:
$2,098
(% of AGI for various income ranges: 4.7% for AGIs below $25k, 1.0% for AGIs $25k-50k)
Percentage of individuals using paid preparers for their 2012 taxes: 69.4%
Here:
69%
State:
65%
(% for various income ranges: 63.6% for AGIs below $25k, 64.7% for AGIs $25k-50k, 80.0% for AGIs $50k-75k, 66.7% for AGIs $75k-100k, 85.7% for AGIs $100k-200k)
Averages for the 2004 tax year for zip code 50568, filed in 2005:
Average Adjusted Gross Income (AGI) in 2004: $35,968 (Individual Income Tax Returns)
Here:
$35,968
State:
$43,875
Salary/wage: $31,551 (reported on 78.7% of returns)
Here:
$31,551
State:
$38,265
(% of AGI for various income ranges: 121.2% for AGIs below $10k, 62.0% for AGIs $10k-25k, 74.5% for AGIs $25k-50k, 75.4% for AGIs $50k-75k, 61.5% for AGIs $75k-100k, 44.9% for AGIs over 100k)
Taxable interest for individuals: $1,338 (reported on 53.6% of returns)
This zip code:
$1,338
Iowa:
$1,768
(% of AGI for various income ranges: 7.5% for AGIs below $10k, 3.6% for AGIs $10k-25k, 1.4% for AGIs $25k-50k, 1.0% for AGIs $50k-75k, 2.9% for AGIs $75k-100k, 2.6% for AGIs over 100k)
Taxable dividends: $958 (reported on 27.9% of returns)
Here:
$958
State:
$2,510
(% of AGI for various income ranges: 2.0% for AGIs below $10k, 1.7% for AGIs $10k-25k, 0.6% for AGIs $25k-50k, 0.3% for AGIs $50k-75k, 1.2% for AGIs $75k-100k, 0.5% for AGIs over 100k)
Net capital gain/loss: +$1,557 (reported on 22.2% of returns)
Here:
+$1,557
State:
+$6,139
(% of AGI for various income ranges: 4.2% for AGIs below $10k, 0.9% for AGIs $10k-25k, 0.7% for AGIs $25k-50k, 0.1% for AGIs $50k-75k, 3.3% for AGIs $75k-100k)
Profit/loss from business: +$3,274 (reported on 16.1% of returns)
Here:
+$3,274
State:
+$8,574
(% of AGI for various income ranges: 11.2% for AGIs below $10k, 3.4% for AGIs $10k-25k, 1.8% for AGIs $25k-50k, 0.6% for AGIs $50k-75k, 1.2% for AGIs $75k-100k)
Profit/loss from farming: +$8,056 (reported on 15.2% of returns)
Here:
+$8,056
State:
-$74
(% of AGI for various income ranges: -19.5% for AGIs below $10k, 5.6% for AGIs $10k-25k, -1.2% for AGIs $25k-50k, 5.3% for AGIs $50k-75k, 11.8% for AGIs $75k-100k)
IRA payment deduction: $3,105 (reported on 3.2% of returns)
50568:
$3,105
Iowa:
$2,970
Self-employed pension: $4,600 (reported on 1.7% of returns)
Here:
$4,600
Iowa:
$11,928
Total itemized deductions: $14,509 (25% of AGI, reported on 19.0% of returns)
Here:
$14,509
State:
$16,976
Here:
24.6% of AGI
State:
20.8% of AGI
(% of AGI for various income ranges: 10.0% for AGIs $10k-25k, 5.5% for AGIs $25k-50k, 7.0% for AGIs $50k-75k, 7.0% for AGIs $75k-100k, 15.0% for AGIs over 100k)
Charity contributions deductions: $2,929 (5% of AGI, reported on 16.8% of returns)
Here:
$2,929
State:
$3,089
Here:
5.1% of AGI
State:
3.6% of AGI
(% of AGI for various income ranges: 1.7% for AGIs $10k-25k, 0.9% for AGIs $25k-50k, 1.1% for AGIs $50k-75k, 1.5% for AGIs $75k-100k, 3.0% for AGIs over 100k)
Total tax: $4,157 (reported on 77.7% of returns)
50568:
$4,157
State:
$6,177
(% of AGI for various income ranges: 4.0% for AGIs below $10k, 4.4% for AGIs $10k-25k, 6.2% for AGIs $25k-50k, 8.6% for AGIs $50k-75k, 12.8% for AGIs $75k-100k, 17.1% for AGIs over 100k)
Earned income credit: $1,797 (reported on 11.7% of returns)
Here:
$1,797
State:
$1,540
Percentage of individuals using paid preparers for their 2004 taxes: 73.3%
Here:
73%
State:
70%
(% for various income ranges: 73.0% for AGIs below $10k, 77.9% for AGIs $10k-25k, 74.0% for AGIs $25k-50k, 67.3% for AGIs $50k-75k, 64.1% for AGIs $75k-100k, 93.8% for AGIs over 100k)
Likely homosexual households (counted as self-reported same-sex unmarried-partner households)
Lesbian couples: 0.4% of all households
Gay men: 0.0% of all households
Household received Food Stamps/SNAP in the past 12 months: 31 Household did not receive Food Stamps/SNAP in the past 12 months: 518
Women who had a birth in the past 12 months: 44 (27 now married, 16 unmarried) Women who did not have a birth in the past 12 months: 226 (92 now married, 134 unmarried)
Housing units in zip code 50568 with a mortgage: 255 (11 second mortgage, 8 both second mortgage and home equity loan) Houses without a mortgage: 35
Median monthly owner costs for units with a mortgage: $1,062 Median monthly owner costs for units without a mortgage: $479
Residents with income below the poverty level in 2022:
This zip code:
5.8%
Whole state:
11.0%
Residents with income below 50% of the poverty level in 2022:
This zip code:
5.0%
Whole state:
5.5%
Median number of rooms in houses and condos:
Here:
6.9
State:
6.8
Median number of rooms in apartments:
Here:
5.1
State:
4.2
Notable locations in this zip code not listed on our city pages
Notable locations in zip code 50568: Newell Golf Course (A), Newell (B), Newell Cooperative Elevator (C), Iowa State University Allee Experimental Farm (D), Vogel Access (E), Newell Fire Department and Ambulance Service (F), Coon Townhall (G), Newell City Hall (H), Newell Public Library (I). Display/hide their locations on the map
Churches in zip code 50568 include: Nain Lutheran Church (A), Saint Peters Lutheran Church (B), Bethel Baptist Church (C), United Methodist Church (D), First Congregational Church (E), Saint Johns Church of Christ Church (F), Saint Johns Lutheran Church (G). Display/hide their locations on the map
Cemeteries: Varina Cemetery (1), Cooke Cemetery (2), First M E Church Cemetery (3), Newell Catholic Cemetery (4), Newell Cemetery (5), Saint Johns Church of Christ Cemetery (6), Saint Johns Lutheran Cemetery (7). Display/hide their locations on the map
In group quarters: 30 (-1 institutionalized population)
Size of family households: 168 2-persons, 61 3-persons, 52 4-persons, 56 5-persons, 34 6-persons, 24 7-or-more-persons
Size of nonfamily households: 126 1-person, 25 2-persons
393 married couples with children.
93 single-parent households (64 men, 29 women).
93.6% of residents of 50568 zip code speak English at home.
4.9% of residents speak Spanish at home (61% very well, 39% well).
0.3% of residents speak other Indo-European language at home (50% very well, 50% well).
0.4% of residents speak Asian or Pacific Island language at home (100% very well).
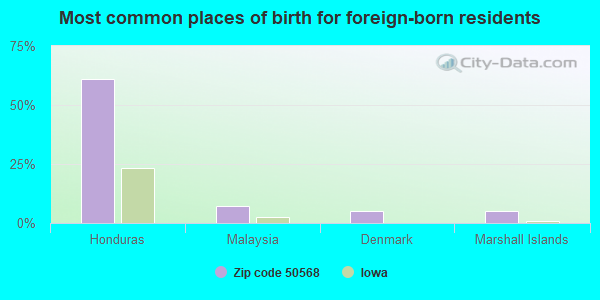
Foreign born population: 44 (2.8%) (76.3% of them are naturalized citizens)
This zip code:
2.8%
Whole state:
6.0%
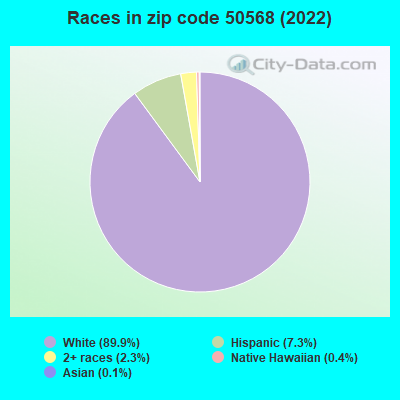
61%Honduras
7%Malaysia
5%Denmark
5%Marshall Islands
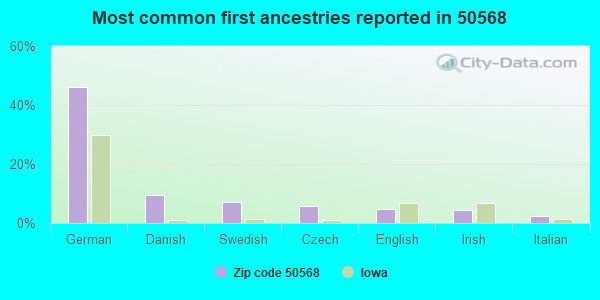
46%German
9%Danish
7%Swedish
6%Czech
5%English
5%Irish
2%Italian
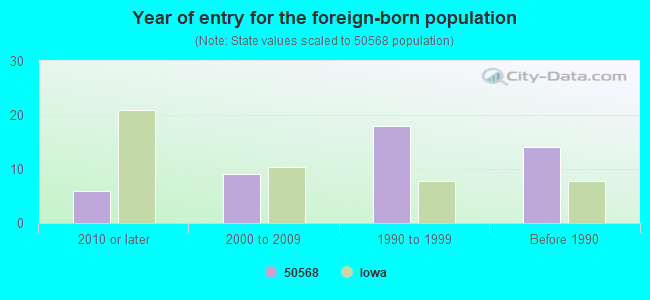
Year of entry for the foreign-born population
62010 or later
92000 to 2009
181990 to 1999
14Before 1990
Facilities with environmental interests located in this zip code:
NEWELL-FONDA HIGH SCHOOL (205 CLARK ST in NEWELL, IA)
(National Center for Education Statistics) - STATE ID-114644 172 Organizations: NEWELL-FONDA COMM SCHOOL DISTRICT (SCHOOL DISTRICT)
NEWELL-FONDA LOWER ELEM. ELEMENTARY (205 CLARK ST in NEWELL, IA)
(National Center for Education Statistics) - STATE ID-114644 409 Organizations: NEWELL-FONDA COMM SCHOOL DISTRICT (SCHOOL DISTRICT)
NORTHERN NATURAL GAS - NEWELL TBS (6301 200TH AVE in NEWELL, IA)
(Resource Conservation and Recovery Act (tracking hazardous waste))
DFS INC (360 W. 3RD ST. in NEWELL, IA)
AIR MINOR (AIRS/AFS) TRI REPORTER (Tracking of toxic chemicals releasing facilities) Business SIC classification: PREPARED FEEDS AND FEED INGREDIENTS FOR ANIMALS AND FOWLS, EXCEPT DOGS AND CATS Alternative names: DON'S FARM SUPPLY INC, DON'S FARM SUPPLY INC.
NEWELL, CITY OF STP (CITY CLERK, CITY HALL in NEWELL, IA)
National Pollutant Discharge Elimination System NON-MAJOR (Tracking pollutant discharge elimination systems) - permit Business SIC classification: SEWERAGE SYSTEMS
NEWELL COOP ELEV (1ST & MADISON in NEWELL, IA)
AIR MINOR (AIRS/AFS) Business SIC classification: GRAIN AND FIELD BEANS
NEWELL-PROVIDENCE C S D (205 CLARK ST in NEWELL, IA)
COMPLIANCE ACTIVITY (Tracking inspections of insecticide, fungicide, and rodenticide, and toxic substances) Alternative names: NEWELL-FONDA CSD, NEWELL-PROVIDENCE COMM SCHOOL DIST
DFS INC (167 W FIRST ST in NEWELL, IA)
TRI REPORTER (Tracking of toxic chemicals releasing facilities) Business SIC classification: PREPARED FEEDS AND FEED INGREDIENTS FOR ANIMALS AND FOWLS, EXCEPT DOGS AND CATS
FARMERS COOPERATIVE COMPANY - NEWELL (6275 200TH AVENUE in NEWELL, IA)
COMPLIANCE ACTIVITY (Tracking inspections of insecticide, fungicide, and rodenticide, and toxic substances) Alternative names: NEWELL COOP ELEV, NEWELL COOPERATIVE ELEVATOR
Housing units lacking complete plumbing facilities: 2.3%
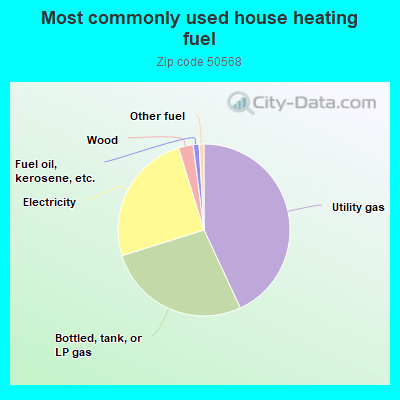
43.2%Utility gas
27.2%Bottled, tank, or LP gas
25.1%Electricity
2.8%Wood
1.1%Fuel oil, kerosene, etc.
0.9%Other fuel
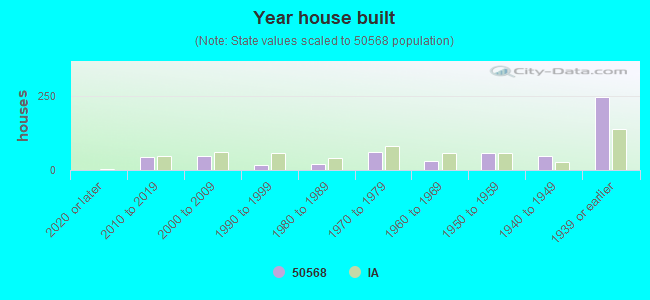
Population in 1990: 1,668.
Place of birth for U.S.-born residents:
This state: 1,302
Northeast: 5
Midwest: 147
South: 31
West: 50
70% of the 50568 zip code residents lived in the same house 5 years ago. Out of people who lived in different houses, 50% lived in this county. Out of people who lived in different counties, 50% lived in Iowa.
91% of the 50568 zip code residents lived in the same house 1 year ago. Out of people who lived in different houses, 44% moved from this county. Out of people who lived in different houses, 38% moved from different county within same state. Out of people who lived in different houses, 16% moved from different state.
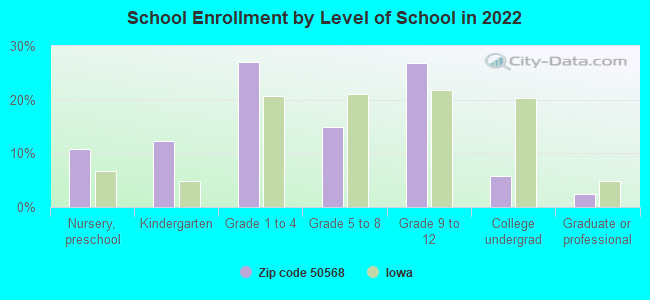
Private vs. public school enrollment:
Students in private schools in grades 1 to 8 (elementary and middle school): 3
Here:
2.0%
Iowa:
10.6%
Students in private schools in grades 9 to 12 (high school):
Here:
0.0%
Iowa:
7.9%
Students in private undergraduate colleges: 7
Here:
28.0%
Iowa:
23.9%
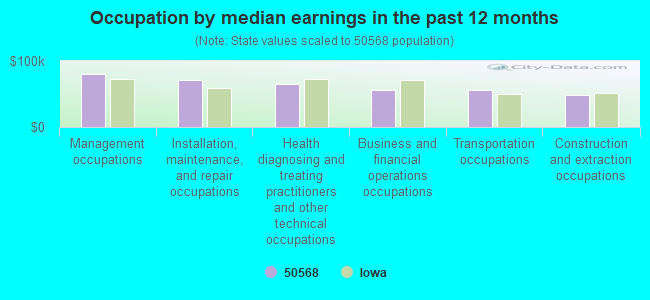
Occupation by median earnings in the past 12 months ($)
80,731Management occupations
70,904Installation, maintenance, and repair occupations
65,253Health diagnosing and treating practitioners and other technical occupations
56,477Business and financial operations occupations
56,451Transportation occupations
49,122Construction and extraction occupations
Top industries in this zip code by the number of employees in 2005:
Health Care and Social Assistance: Nursing Care Facilities (50-99 employees: 1 establishment)
Wholesale Trade: Grain and Field Bean Merchant Wholesalers (20-49: 1)
Other Services (except Public Administration): Religious Organizations (5-9: 2, 1-4: 3)
Finance and Insurance: Commercial Banking (10-19: 1)
Health Care and Social Assistance: Child Day Care Services (5-9: 1, 1-4: 1)
Finance and Insurance: Commodity Contracts Brokerage (5-9: 1)
Construction: New Single-Family Housing Construction (except Operative Builders) (1-4: 2)
People in group quarters in 2010:
42 people in nursing facilities/skilled-nursing facilities
People in group quarters in 2000:
49 people in nursing homes
Fatal accident statistics in 2013:
Fatal accident count: 1
Vehicles involved in fatal accidents: 2
Fatal accidents caused by drunken drivers: 0
Fatalities: 1
Persons involved in fatal accidents: 3
Pedestrians involved in fatal accidents: 0
Fatal accident statistics in 2012:
Fatal accident count: 1
Vehicles involved in fatal accidents: 2
Fatal accidents caused by drunken drivers: 0
Fatalities: 1
Persons involved in fatal accidents: 2
Pedestrians involved in fatal accidents: 0
Most common first names in zip code 50568 among deceased individuals
Name
Count
Lived (average)
Mary
15
85.5 years
Anna
12
89.1 years
Harold
12
75.2 years
George
11
76.4 years
John
9
83.9 years
William
9
80.2 years
Donald
9
74.1 years
Helen
8
83.1 years
Clarence
8
80.3 years
Esther
8
85.6 years
Most common last names in zip code 50568 among deceased individuals
Last name
Count
Lived (average)
Jensen
18
80.9 years
Christensen
13
81.9 years
Petersen
11
81.3 years
Peterson
11
79.5 years
Johnsen
10
84.0 years
Nelson
9
89.1 years
Witzke
8
80.4 years
Porath
8
85.0 years
Nielsen
8
76.5 years
Johnson
8
87.6 years
Discuss Newell, Iowa (IA) on our hugely popular Iowa forum.


+$8,056
-$74
(% of AGI for various income ranges: -19.5% for AGIs below $10k, 5.6% for AGIs $10k-25k, -1.2% for AGIs $25k-50k, 5.3% for AGIs $50k-75k, 11.8% for AGIs $75k-100k) Nearest zip codes: 50593, 50510, 50540, 50567, 50588, 50583.
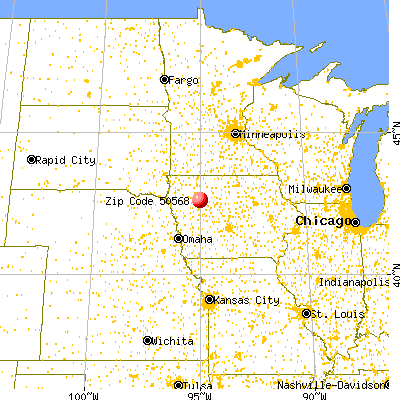