Estimated zip code population in 2022: 1,565 Zip code population in 2010: 1,804 Zip code population in 2000: 1,757
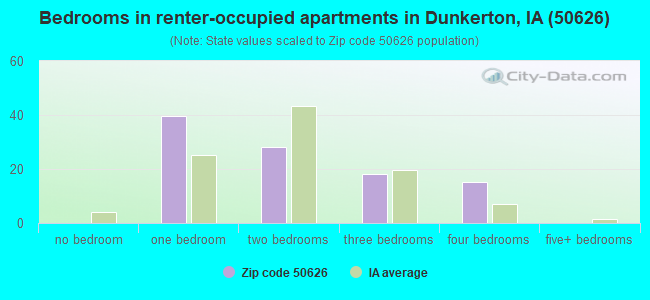
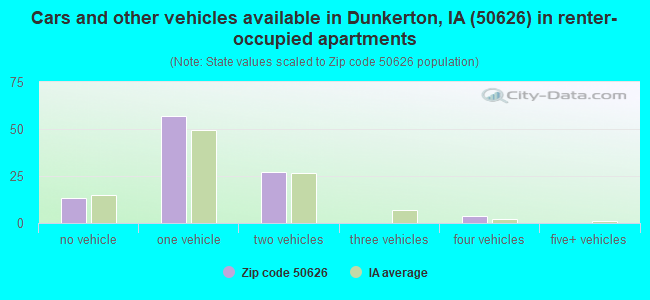
Houses and condos: 657 Renter-occupied apartments: 100
% of renters here:
16%
State:
28%
March 2022 cost of living index in zip code 50626: 82.6 (low, U.S. average is 100)
Land area: 50.3 sq. mi. Water area: 0.2 sq. mi.
Population density: 31 people per square mile
(very low).
OSM Map
General Map
Google Map
MSN Map
OSM Map
General Map
Google Map
MSN Map
OSM Map
General Map
Google Map
MSN Map
OSM Map
General Map
Google Map
MSN Map
Please wait while loading the map...
Real estate property taxes paid for housing units in 2022:
This zip code:
1.2% ($2,502)
Iowa:
1.4% ($2,724)
Median real estate property taxes paid for housing units with mortgages in 2022: $2,581 (1.3%) Median real estate property taxes paid for housing units with no mortgage in 2022: $2,444 (1.1%)
Business Search- 14 Million verified businesses
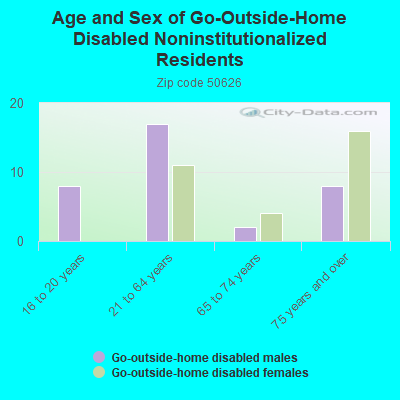
Males: 698
(44.7%)
Females: 866
(55.3%)
For population 25 years and over in 50626:
High school or higher: 96.1%
Bachelor's degree or higher: 21.0%
Graduate or professional degree: 5.0%
Unemployed: 4.3%
Mean travel time to work (commute): 25.0 minutes
For population 15 years and over in 50626:
Never married: 28.4%
Now married: 57.7%
Separated: 1.1%
Widowed: 6.6%
Divorced: 6.1%
Zip code 50626 compared to state average:
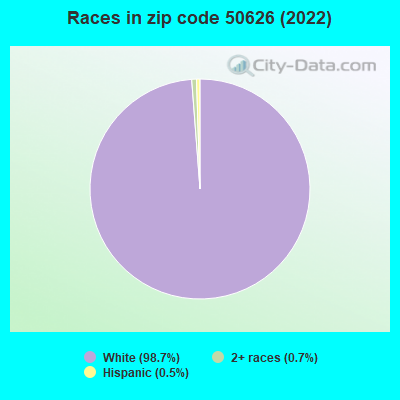
Black race population percentage significantly below state average.
Hispanic race population percentage significantly below state average.
Median age above state average.
Foreign-born population percentage significantly below state average.
Renting percentage below state average.
Length of stay since moving in significantly above state average.
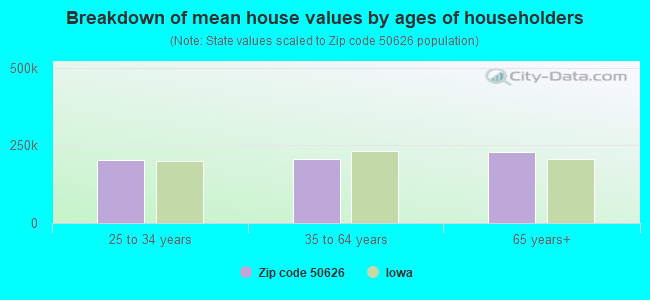
Estimated median house/condo value in 2022: $206,387
50626:
$206,387
Iowa:
$194,600
According to our research of Iowa and other state lists, there was 1 registered sex offender living in 50626 zip code as of June 07, 2024. The ratio of all residents to sex offenders in zip code 50626 is 1,899 to 1. The ratio of registered sex offenders to all residents in this zip code is much lower than the state average.
Median resident age:
This zip code:
43.4 years
Iowa median age:
38.9 years
Average household size:
This zip code:
2.5 people
Iowa:
2.3 people
Averages for the 2020 tax year for zip code 50626, filed in 2021:
Average Adjusted Gross Income (AGI) in 2020: $62,313 (Individual Income Tax Returns)
Here:
$62,313
State:
$71,087
Salary/wage: $53,452 (reported on 84.8% of returns)
Here:
$53,452
State:
$57,361
(% of AGI for various income ranges: 1125.3% for AGIs below $25k, 3474.7% for AGIs $25k-50k, 6675.6% for AGIs $50k-75k, 9726.7% for AGIs $75k-100k, 18965.6% for AGIs $100k-200k)
Taxable interest for individuals: $1,245 (reported on 36.7% of returns)
This zip code:
$1,245
Iowa:
$1,633
(% of AGI for various income ranges: 16.0% for AGIs below $25k, 46.0% for AGIs $25k-50k, 56.7% for AGIs $50k-75k, 65.0% for AGIs $75k-100k, 197.8% for AGIs $100k-200k)
Ordinary dividends: $2,153 (reported on 19.0% of returns)
Here:
$2,153
State:
$5,432
(% of AGI for various income ranges: 22.7% for AGIs $25k-50k, 140.0% for AGIs $50k-75k, 36.7% for AGIs $75k-100k, 156.7% for AGIs $100k-200k)
Net capital gain/loss in AGI: +$4,683 (reported on 15.2% of returns)
Here:
+$4,683
State:
+$15,243
(% of AGI for various income ranges: 30.7% for AGIs $25k-50k, 66.7% for AGIs $50k-75k, 506.7% for AGIs $100k-200k)
Profit/loss from business: +$12,220 (reported on 12.7% of returns)
Here:
+$12,220
State:
+$11,763
(% of AGI for various income ranges: 61.3% for AGIs below $25k, 442.7% for AGIs $25k-50k, 453.3% for AGIs $75k-100k, 215.6% for AGIs $100k-200k)
Taxable individual retirement arrangement distribution: $13,071 (reported on 8.9% of returns)
50626:
$13,071
Iowa:
$17,324
(% of AGI for various income ranges: 216.7% for AGIs below $25k, 323.3% for AGIs $50k-75k, 332.2% for AGIs $100k-200k)
Earned income credit: $1,890 (reported on 12.7% of returns)
Here:
$1,890
State:
$2,195
(% of AGI for various income ranges: 72.0% for AGIs below $25k, 54.0% for AGIs $25k-50k)
Percentage of individuals using paid preparers for their 2020 taxes: 91.1%
Here:
91%
State:
95%
(% for various income ranges: 90.0% for AGIs below $25k, 90.0% for AGIs $25k-50k, 92.3% for AGIs $50k-75k, 88.9% for AGIs $75k-100k, 94.1% for AGIs $100k-200k)
Averages for the 2012 tax year for zip code 50626, filed in 2013:
Average Adjusted Gross Income (AGI) in 2012: $57,753 (Individual Income Tax Returns)
Here:
$57,753
State:
$58,860
Salary/wage: $47,426 (reported on 85.7% of returns)
Here:
$47,426
State:
$46,659
(% of AGI for various income ranges: 73.7% for AGIs below $25k, 75.5% for AGIs $25k-50k, 77.3% for AGIs $50k-75k, 78.2% for AGIs $75k-100k, 59.8% for AGIs $100k-200k)
Taxable interest for individuals: $883 (reported on 46.8% of returns)
This zip code:
$883
Iowa:
$1,537
(% of AGI for various income ranges: 1.0% for AGIs below $25k, 1.1% for AGIs $25k-50k, 0.8% for AGIs $50k-75k, 0.4% for AGIs $75k-100k, 0.6% for AGIs $100k-200k)
Ordinary dividends: $1,250 (reported on 23.4% of returns)
Here:
$1,250
State:
$4,542
(% of AGI for various income ranges: 0.9% for AGIs below $25k, 0.3% for AGIs $25k-50k, 0.2% for AGIs $50k-75k, 0.2% for AGIs $75k-100k, 0.8% for AGIs $100k-200k)
Net capital gain/loss in AGI: +$15,355 (reported on 14.3% of returns)
Here:
+$15,355
State:
+$11,802
(% of AGI for various income ranges: 0.6% for AGIs $25k-50k, 1.0% for AGIs $50k-75k, 9.4% for AGIs $100k-200k)
Profit/loss from business: +$9,722 (reported on 11.7% of returns)
Here:
+$9,722
State:
+$10,509
(% of AGI for various income ranges: 5.1% for AGIs $25k-50k, 2.0% for AGIs $50k-75k, 3.9% for AGIs $75k-100k)
Taxable individual retirement arrangement distribution: $9,925 (reported on 10.4% of returns)
50626:
$9,925
Iowa:
$11,773
Total itemized deductions: $15,444 (17% of AGI, reported on 32.5% of returns)
Here:
$15,444
State:
$21,278
Here:
17.3% of AGI
State:
18.9% of AGI
(% of AGI for various income ranges: 8.5% for AGIs $25k-50k, 8.5% for AGIs $50k-75k, 11.0% for AGIs $75k-100k, 9.3% for AGIs $100k-200k)
Charity contributions: $2,578 (reported on 23.4% of returns)
Here:
$2,578
State:
$4,044
(% of AGI for various income ranges: 0.9% for AGIs $25k-50k, 0.8% for AGIs $50k-75k, 1.4% for AGIs $75k-100k, 1.2% for AGIs $100k-200k)
Taxes paid: $6,892 (reported on 32.5% of returns)
50626:
$6,892
State:
$8,846
(% of AGI for various income ranges: 2.6% for AGIs $25k-50k, 2.9% for AGIs $50k-75k, 4.6% for AGIs $75k-100k, 5.3% for AGIs $100k-200k)
Earned income credit: $2,600 (reported on 10.4% of returns)
Here:
$2,600
State:
$2,098
(% of AGI for various income ranges: 4.6% for AGIs below $25k, 0.9% for AGIs $25k-50k)
Percentage of individuals using paid preparers for their 2012 taxes: 75.3%
Here:
75%
State:
65%
(% for various income ranges: 65.2% for AGIs below $25k, 70.0% for AGIs $25k-50k, 78.6% for AGIs $50k-75k, 90.0% for AGIs $75k-100k, 90.0% for AGIs $100k-200k)
Averages for the 2004 tax year for zip code 50626, filed in 2005:
Average Adjusted Gross Income (AGI) in 2004: $39,559 (Individual Income Tax Returns)
Here:
$39,559
State:
$43,875
Salary/wage: $35,778 (reported on 88.5% of returns)
Here:
$35,778
State:
$38,265
(% of AGI for various income ranges: 83.8% for AGIs below $10k, 78.5% for AGIs $10k-25k, 79.3% for AGIs $25k-50k, 83.7% for AGIs $50k-75k, 83.9% for AGIs $75k-100k, 66.3% for AGIs over 100k)
Taxable interest for individuals: $817 (reported on 54.8% of returns)
This zip code:
$817
Iowa:
$1,768
(% of AGI for various income ranges: 2.8% for AGIs below $10k, 2.9% for AGIs $10k-25k, 1.7% for AGIs $25k-50k, 0.9% for AGIs $50k-75k, 0.4% for AGIs $75k-100k, 0.3% for AGIs over 100k)
Taxable dividends: $476 (reported on 28.0% of returns)
Here:
$476
State:
$2,510
(% of AGI for various income ranges: 0.7% for AGIs below $10k, 0.6% for AGIs $10k-25k, 0.3% for AGIs $25k-50k, 0.3% for AGIs $50k-75k, 0.2% for AGIs $75k-100k, 0.4% for AGIs over 100k)
Net capital gain/loss: +$4,487 (reported on 15.6% of returns)
Here:
+$4,487
State:
+$6,139
(% of AGI for various income ranges: 0.2% for AGIs $10k-25k, 0.5% for AGIs $25k-50k, 0.9% for AGIs $50k-75k, 2.0% for AGIs $75k-100k, 7.8% for AGIs over 100k)
Profit/loss from business: +$3,402 (reported on 13.8% of returns)
Here:
+$3,402
State:
+$8,574
(% of AGI for various income ranges: -0.1% for AGIs $10k-25k, 2.1% for AGIs $25k-50k, 1.9% for AGIs $50k-75k, 0.3% for AGIs $75k-100k)
Profit/loss from farming: +$4,000 (reported on 9.4% of returns)
Here:
+$4,000
State:
-$74
IRA payment deduction: $2,545 (reported on 1.5% of returns)
50626:
$2,545
Iowa:
$2,970
Total itemized deductions: $13,787 (21% of AGI, reported on 24.8% of returns)
Here:
$13,787
State:
$16,976
Here:
21.3% of AGI
State:
20.8% of AGI
(% of AGI for various income ranges: 6.1% for AGIs $10k-25k, 7.0% for AGIs $25k-50k, 8.8% for AGIs $50k-75k, 13.1% for AGIs $75k-100k, 8.4% for AGIs over 100k)
Charity contributions deductions: $1,753 (3% of AGI, reported on 22.0% of returns)
Here:
$1,753
State:
$3,089
Here:
2.7% of AGI
State:
3.6% of AGI
(% of AGI for various income ranges: 0.9% for AGIs $10k-25k, 0.8% for AGIs $25k-50k, 1.1% for AGIs $50k-75k, 1.2% for AGIs $75k-100k, 1.0% for AGIs over 100k)
Total tax: $4,319 (reported on 76.3% of returns)
50626:
$4,319
State:
$6,177
(% of AGI for various income ranges: 2.8% for AGIs below $10k, 3.9% for AGIs $10k-25k, 6.3% for AGIs $25k-50k, 8.0% for AGIs $50k-75k, 9.5% for AGIs $75k-100k, 15.7% for AGIs over 100k)
Earned income credit: $1,584 (reported on 13.7% of returns)
Here:
$1,584
State:
$1,540
Percentage of individuals using paid preparers for their 2004 taxes: 72.2%
Here:
72%
State:
70%
(% for various income ranges: 56.2% for AGIs below $10k, 70.0% for AGIs $10k-25k, 74.9% for AGIs $25k-50k, 77.8% for AGIs $50k-75k, 88.5% for AGIs $75k-100k, 76.9% for AGIs over 100k)
Household received Food Stamps/SNAP in the past 12 months: 31 Household did not receive Food Stamps/SNAP in the past 12 months: 598
Women who had a birth in the past 12 months: 21 (22 now married, 0 unmarried) Women who did not have a birth in the past 12 months: 355 (132 now married, 223 unmarried)
Housing units in zip code 50626 with a mortgage: 269 (70 second mortgage, 59 both second mortgage and home equity loan) Houses without a mortgage: 15
Median monthly owner costs for units with a mortgage: $1,358 Median monthly owner costs for units without a mortgage: $582
Residents with income below the poverty level in 2022:
This zip code:
5.7%
Whole state:
11.0%
Residents with income below 50% of the poverty level in 2022:
This zip code:
2.7%
Whole state:
5.5%
Median number of rooms in houses and condos:
Here:
7.0
State:
6.8
Median number of rooms in apartments:
Here:
3.9
State:
4.2
Notable locations in this zip code not listed on our city pages
Notable locations in zip code 50626: Dunkerton Co-op Elevator (A), Dunkerton (B), Dunkerton Ambulance Service (C), Dunkerton City Hall (D), Dunkerton Public Library (E). Display/hide their locations on the map
Churches in zip code 50626 include: Saint Johns Lutheran Church (A), Dunkerton Gospel Hall (B), Dunkerton United Methodist Church (C), First Baptist Church (D), Saint Francis Church (E). Display/hide their locations on the map
Cemeteries: Old Barclay Cemetery (1), Saint Francis Cemetery (2), Fairview-Lester Cemetery (3), Gresham Cemetery (4), Lester Township Cemetery (5). Display/hide their locations on the map
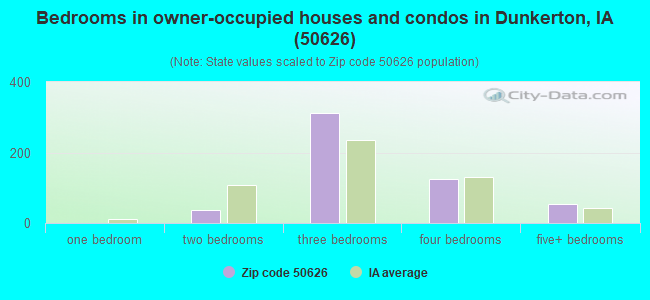
Size of family households: 280 2-persons, 53 3-persons, 94 4-persons, 16 5-persons, 5 6-persons, 11 7-or-more-persons
Size of nonfamily households: 128 1-person, 38 2-persons
281 married couples with children.
42 single-parent households (10 men, 32 women).
98.5% of residents of 50626 zip code speak English at home.
0.4% of residents speak Spanish at home (100% very well).
0.7% of residents speak other Indo-European language at home (100% very well).
Foreign born population: 10 (0.7%) (60.8% of them are naturalized citizens)
This zip code:
0.7%
Whole state:
6.0%
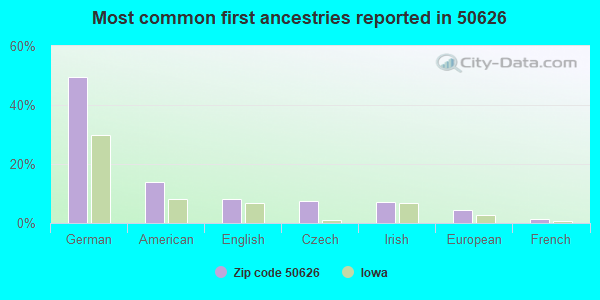
49%German
14%American
8%English
7%Czech
7%Irish
5%European
1%French
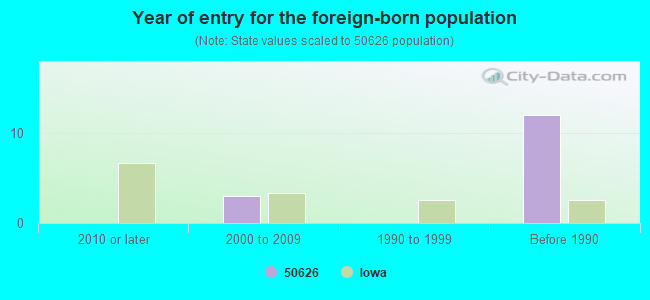
Year of entry for the foreign-born population
02010 or later
32000 to 2009
01990 to 1999
12Before 1990
Facilities with environmental interests located in this zip code:
DUNKERTON ELEMENTARY (509 S CANFIELD ST in DUNKERTON, IA)
(National Center for Education Statistics) - STATE ID-071908 409 Organizations: DUNKERTON COMM SCHOOL DISTRICT (SCHOOL DISTRICT)
DUNKERTON HIGH SCHOOL (509 S CANFIELD ST in DUNKERTON, IA)
(National Center for Education Statistics) - STATE ID-071908 172 Organizations: DUNKERTON COMM SCHOOL DISTRICT (SCHOOL DISTRICT)
R&W ENTERPRISES (8919 HACKBERRY DR in DUNKERTON, IA)
(Integrated Compliance Information System) - ICIS-07-1995-0098, FORMAL ENFORCEMENT ACTION
DUNKERTON CITY OF STP (OFF HWY 281, NOTRH OF TOWN in DUNKERTON, IA)
National Pollutant Discharge Elimination System NON-MAJOR (Tracking pollutant discharge elimination systems) - permit Business SIC classification: SEWERAGE SYSTEMS Organizations: CITY OF DUNKERTON (CONTACT/OWNER)
DUNKERTON COOPERATIVE ELEVATOR (509 WEST DUNKERTON STREET in DUNKERTON, IA)
AIR MINOR (AIRS/AFS) COMPLIANCE ACTIVITY (Tracking inspections of insecticide, fungicide, and rodenticide, and toxic substances) Business SIC classification: GRAIN AND FIELD BEANS Alternative names: DUNKERTON CO-OP ELEVATOR COMPANY, DUNKERTON COOP ELEV
DUNKERTON CSD (509 S CANFIELD in DUNKERTON, IA)
COMPLIANCE ACTIVITY (Tracking inspections of insecticide, fungicide, and rodenticide, and toxic substances)
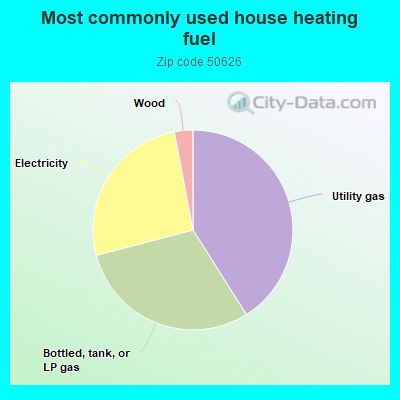
41.2%Utility gas
30.0%Bottled, tank, or LP gas
26.2%Electricity
3.0%Wood
Population in 1990: 1,676. Population change in the 1990s: +81 (+4.8%).
Place of birth for U.S.-born residents:
This state: 1,442
Midwest: 68
South: 14
West: 23
66% of the 50626 zip code residents lived in the same house 5 years ago. Out of people who lived in different houses, 64% lived in this county. Out of people who lived in different counties, 50% lived in Iowa.
95% of the 50626 zip code residents lived in the same house 1 year ago. Out of people who lived in different houses, 85% moved from this county. Out of people who lived in different houses, 15% moved from different county within same state. Out of people who lived in different houses, 2% moved from abroad.
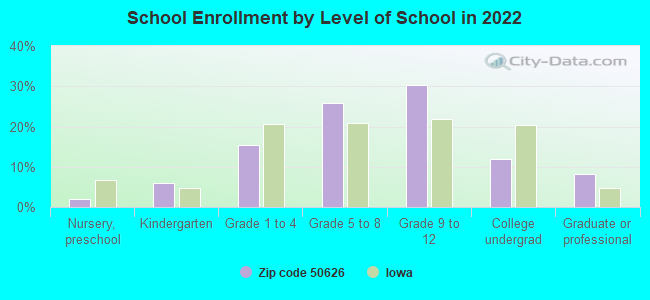
Private vs. public school enrollment:
Students in private schools in grades 1 to 8 (elementary and middle school): 24
Here:
15.3%
Iowa:
10.6%
Students in private schools in grades 9 to 12 (high school): 4
Here:
4.3%
Iowa:
7.9%
Students in private undergraduate colleges: 2
Here:
5.9%
Iowa:
23.9%
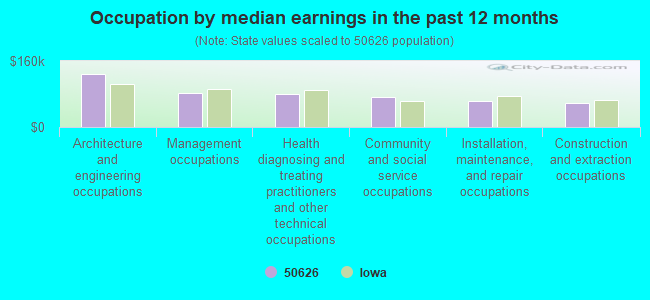
Occupation by median earnings in the past 12 months ($)
128,622Architecture and engineering occupations
82,751Management occupations
80,596Health diagnosing and treating practitioners and other technical occupations
73,842Community and social service occupations
63,814Installation, maintenance, and repair occupations
57,561Construction and extraction occupations
Top industries in this zip code by the number of employees in 2005:
Construction: Commercial and Institutional Building Construction (20-49 employees: 1 establishment, 1-4 employees: 1 establishment)
Wholesale Trade: Grain and Field Bean Merchant Wholesalers (10-19: 1)
Accommodation and Food Services: Limited-Service Restaurants (5-9: 1)
Other Services (except Public Administration): Religious Organizations (1-4: 3)
Administrative and Support and Waste Management and Remediation Services: Landscaping Services (1-4: 1)
Wholesale Trade: Farm and Garden Machinery and Equipment Merchant Wholesalers (1-4: 1)
Construction: New Single-Family Housing Construction (except Operative Builders) (1-4: 1)
Administrative and Support and Waste Management and Remediation Services: Solid Waste Collection (1-4: 1)
Fatal accident statistics in 2012:
Fatal accident count: 1
Vehicles involved in fatal accidents: 2
Fatal accidents caused by drunken drivers: 0
Fatalities: 1
Persons involved in fatal accidents: 4
Pedestrians involved in fatal accidents: 0
Fatal accident statistics in 2011:
Fatal accident count: 1
Vehicles involved in fatal accidents: 1
Fatal accidents caused by drunken drivers: 0
Fatalities: 1
Persons involved in fatal accidents: 2
Pedestrians involved in fatal accidents: 0
Home Mortgage Disclosure Act Aggregated Statistics For Year 2009 (Based on 4 partial tracts)
A) FHA, FSA/RHS & VA Home Purchase Loans
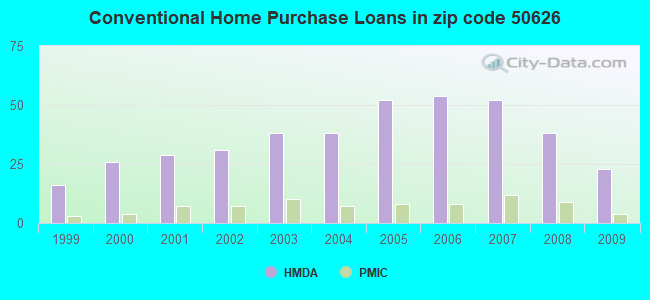
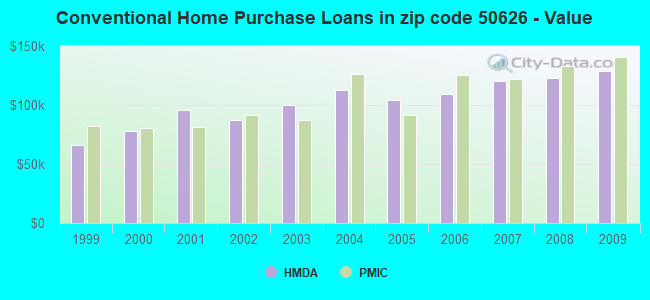
B) Conventional Home Purchase Loans
C) Refinancings
D) Home Improvement Loans
F) Non-occupant Loans on < 5 Family Dwellings (A B C & D)
G) Loans On Manufactured Home Dwelling (A B C & D)
Number
Average Value
Number
Average Value
Number
Average Value
Number
Average Value
Number
Average Value
Number
Average Value
LOANS ORIGINATED
14
$127,349
23
$128,576
106
$137,454
3
$16,937
4
$70,960
1
$33,490
APPLICATIONS APPROVED, NOT ACCEPTED
0
$0
5
$49,326
10
$146,088
0
$0
0
$0
1
$14,880
APPLICATIONS DENIED
0
$0
4
$84,512
17
$126,085
1
$163,250
0
$0
2
$63,570
APPLICATIONS WITHDRAWN
2
$105,150
3
$142,987
14
$138,632
0
$0
0
$0
0
$0
FILES CLOSED FOR INCOMPLETENESS
1
$64,500
0
$0
1
$185,350
0
$0
0
$0
0
$0
Aggregated Statistics For Year 2008 (Based on 4 partial tracts)
A) FHA, FSA/RHS & VA Home Purchase Loans
B) Conventional Home Purchase Loans
C) Refinancings
D) Home Improvement Loans
E) Loans on Dwellings For 5+ Families
F) Non-occupant Loans on < 5 Family Dwellings (A B C & D)
G) Loans On Manufactured Home Dwelling (A B C & D)
Number
Average Value
Number
Average Value
Number
Average Value
Number
Average Value
Number
Average Value
Number
Average Value
Number
Average Value
LOANS ORIGINATED
7
$151,544
38
$122,729
49
$128,547
7
$35,064
1
$198,460
4
$70,700
1
$19,230
APPLICATIONS APPROVED, NOT ACCEPTED
0
$0
5
$102,826
7
$107,577
0
$0
0
$0
0
$0
1
$29,770
APPLICATIONS DENIED
1
$151,030
1
$38,180
19
$205,905
4
$18,932
0
$0
1
$9,920
1
$9,920
APPLICATIONS WITHDRAWN
1
$105,530
5
$105,516
6
$125,647
1
$49,620
0
$0
1
$36,130
1
$9,300
FILES CLOSED FOR INCOMPLETENESS
0
$0
1
$147,610
1
$12,430
0
$0
0
$0
0
$0
0
$0
Aggregated Statistics For Year 2007 (Based on 4 partial tracts)
A) FHA, FSA/RHS & VA Home Purchase Loans
B) Conventional Home Purchase Loans
C) Refinancings
D) Home Improvement Loans
F) Non-occupant Loans on < 5 Family Dwellings (A B C & D)
G) Loans On Manufactured Home Dwelling (A B C & D)
Number
Average Value
Number
Average Value
Number
Average Value
Number
Average Value
Number
Average Value
Number
Average Value
LOANS ORIGINATED
5
$93,184
52
$120,654
40
$125,075
7
$41,843
1
$225,230
1
$90,800
APPLICATIONS APPROVED, NOT ACCEPTED
1
$108,520
7
$97,713
6
$115,410
2
$47,445
0
$0
0
$0
APPLICATIONS DENIED
1
$44,650
7
$90,087
12
$132,593
7
$69,387
2
$50,050
3
$60,327
APPLICATIONS WITHDRAWN
0
$0
2
$139,870
9
$110,936
2
$69,800
0
$0
0
$0
FILES CLOSED FOR INCOMPLETENESS
1
$103,570
1
$112,250
5
$125,306
0
$0
0
$0
0
$0
Aggregated Statistics For Year 2006 (Based on 4 partial tracts)
A) FHA, FSA/RHS & VA Home Purchase Loans
B) Conventional Home Purchase Loans
C) Refinancings
D) Home Improvement Loans
F) Non-occupant Loans on < 5 Family Dwellings (A B C & D)
G) Loans On Manufactured Home Dwelling (A B C & D)
Number
Average Value
Number
Average Value
Number
Average Value
Number
Average Value
Number
Average Value
Number
Average Value
LOANS ORIGINATED
2
$109,630
54
$109,626
57
$98,508
11
$31,595
7
$76,570
2
$32,930
APPLICATIONS APPROVED, NOT ACCEPTED
0
$0
4
$136,980
8
$97,874
1
$35,250
0
$0
0
$0
APPLICATIONS DENIED
1
$86,190
6
$93,493
29
$101,025
4
$61,325
3
$78,603
2
$87,140
APPLICATIONS WITHDRAWN
0
$0
4
$90,258
14
$97,744
1
$18,610
0
$0
1
$47,140
FILES CLOSED FOR INCOMPLETENESS
0
$0
2
$106,050
7
$87,461
0
$0
0
$0
0
$0
Aggregated Statistics For Year 2005 (Based on 4 partial tracts)
A) FHA, FSA/RHS & VA Home Purchase Loans
B) Conventional Home Purchase Loans
C) Refinancings
D) Home Improvement Loans
F) Non-occupant Loans on < 5 Family Dwellings (A B C & D)
G) Loans On Manufactured Home Dwelling (A B C & D)
Number
Average Value
Number
Average Value
Number
Average Value
Number
Average Value
Number
Average Value
Number
Average Value
LOANS ORIGINATED
2
$116,910
52
$104,285
54
$96,656
14
$47,804
3
$88,777
3
$49,143
APPLICATIONS APPROVED, NOT ACCEPTED
0
$0
3
$106,457
5
$95,846
1
$43,140
0
$0
1
$57,680
APPLICATIONS DENIED
0
$0
6
$63,202
24
$101,842
3
$35,907
1
$108,410
4
$43,998
APPLICATIONS WITHDRAWN
1
$56,440
9
$67,991
16
$97,134
2
$54,750
2
$42,485
0
$0
FILES CLOSED FOR INCOMPLETENESS
0
$0
1
$83,220
7
$92,326
0
$0
0
$0
0
$0
Aggregated Statistics For Year 2004 (Based on 4 partial tracts)
A) FHA, FSA/RHS & VA Home Purchase Loans
B) Conventional Home Purchase Loans
C) Refinancings
D) Home Improvement Loans
F) Non-occupant Loans on < 5 Family Dwellings (A B C & D)
G) Loans On Manufactured Home Dwelling (A B C & D)
Number
Average Value
Number
Average Value
Number
Average Value
Number
Average Value
Number
Average Value
Number
Average Value
LOANS ORIGINATED
1
$161,360
38
$112,689
59
$102,564
7
$30,806
4
$56,060
2
$28,150
APPLICATIONS APPROVED, NOT ACCEPTED
0
$0
2
$96,600
10
$86,781
0
$0
0
$0
0
$0
APPLICATIONS DENIED
0
$0
8
$96,865
24
$72,059
8
$17,444
2
$52,715
4
$43,070
APPLICATIONS WITHDRAWN
1
$95,510
7
$81,800
11
$93,422
1
$98,210
1
$88,070
1
$80,630
FILES CLOSED FOR INCOMPLETENESS
0
$0
3
$117,747
6
$95,462
0
$0
0
$0
0
$0
Aggregated Statistics For Year 2003 (Based on 4 partial tracts)
A) FHA, FSA/RHS & VA Home Purchase Loans
B) Conventional Home Purchase Loans
C) Refinancings
D) Home Improvement Loans
E) Loans on Dwellings For 5+ Families
F) Non-occupant Loans on < 5 Family Dwellings (A B C & D)
Number
Average Value
Number
Average Value
Number
Average Value
Number
Average Value
Number
Average Value
Number
Average Value
LOANS ORIGINATED
3
$80,597
38
$100,396
131
$90,821
4
$21,458
1
$614,000
4
$51,862
APPLICATIONS APPROVED, NOT ACCEPTED
0
$0
3
$66,813
8
$100,116
0
$0
0
$0
0
$0
APPLICATIONS DENIED
0
$0
6
$65,838
23
$80,968
3
$25,143
0
$0
2
$60,050
APPLICATIONS WITHDRAWN
0
$0
6
$89,848
28
$96,535
3
$18,090
0
$0
1
$37,450
FILES CLOSED FOR INCOMPLETENESS
0
$0
1
$146,990
2
$96,285
0
$0
0
$0
0
$0
Aggregated Statistics For Year 2002 (Based on 4 partial tracts)
A) FHA, FSA/RHS & VA Home Purchase Loans
B) Conventional Home Purchase Loans
C) Refinancings
D) Home Improvement Loans
F) Non-occupant Loans on < 5 Family Dwellings (A B C & D)
Number
Average Value
Number
Average Value
Number
Average Value
Number
Average Value
Number
Average Value
LOANS ORIGINATED
4
$99,422
31
$87,609
75
$93,560
8
$35,789
1
$76,300
APPLICATIONS APPROVED, NOT ACCEPTED
0
$0
4
$50,120
8
$80,699
0
$0
0
$0
APPLICATIONS DENIED
2
$62,230
4
$69,900
16
$70,504
2
$10,545
0
$0
APPLICATIONS WITHDRAWN
1
$86,010
5
$78,766
17
$82,934
1
$5,090
0
$0
FILES CLOSED FOR INCOMPLETENESS
0
$0
0
$0
3
$100,210
0
$0
0
$0
Aggregated Statistics For Year 2001 (Based on 4 partial tracts)
A) FHA, FSA/RHS & VA Home Purchase Loans
B) Conventional Home Purchase Loans
C) Refinancings
D) Home Improvement Loans
F) Non-occupant Loans on < 5 Family Dwellings (A B C & D)
Number
Average Value
Number
Average Value
Number
Average Value
Number
Average Value
Number
Average Value
LOANS ORIGINATED
1
$52,560
29
$95,765
79
$74,292
6
$13,253
1
$150,580
APPLICATIONS APPROVED, NOT ACCEPTED
0
$0
1
$18,910
6
$55,690
2
$16,980
1
$2,480
APPLICATIONS DENIED
0
$0
11
$52,964
17
$75,935
2
$9,570
1
$27,810
APPLICATIONS WITHDRAWN
1
$32,390
5
$80,884
12
$91,876
1
$24,260
0
$0
FILES CLOSED FOR INCOMPLETENESS
0
$0
2
$110,880
1
$156,460
0
$0
0
$0
Aggregated Statistics For Year 2000 (Based on 4 partial tracts)
A) FHA, FSA/RHS & VA Home Purchase Loans
B) Conventional Home Purchase Loans
C) Refinancings
D) Home Improvement Loans
F) Non-occupant Loans on < 5 Family Dwellings (A B C & D)
Number
Average Value
Number
Average Value
Number
Average Value
Number
Average Value
Number
Average Value
LOANS ORIGINATED
1
$59,740
26
$78,215
28
$59,519
10
$17,864
1
$42,330
APPLICATIONS APPROVED, NOT ACCEPTED
0
$0
3
$48,120
4
$50,640
1
$34,600
0
$0
APPLICATIONS DENIED
2
$57,800
12
$49,970
16
$50,832
2
$14,825
0
$0
APPLICATIONS WITHDRAWN
0
$0
3
$115,813
6
$71,167
0
$0
1
$31,010
FILES CLOSED FOR INCOMPLETENESS
1
$54,580
0
$0
2
$155,660
0
$0
0
$0
Aggregated Statistics For Year 1999 (Based on 2 partial tracts)
A) FHA, FSA/RHS & VA Home Purchase Loans
B) Conventional Home Purchase Loans
C) Refinancings
D) Home Improvement Loans
F) Non-occupant Loans on < 5 Family Dwellings (A B C & D)


+$4,000
-$74
 Nearest zip codes: 50703, 50668, 50629, 50667, 50664, 50707.