Estimated zip code population in 2022: 1,573 Zip code population in 2010: 1,728 Zip code population in 2000: 1,937
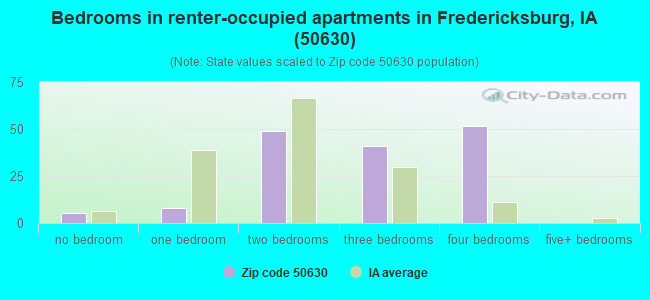
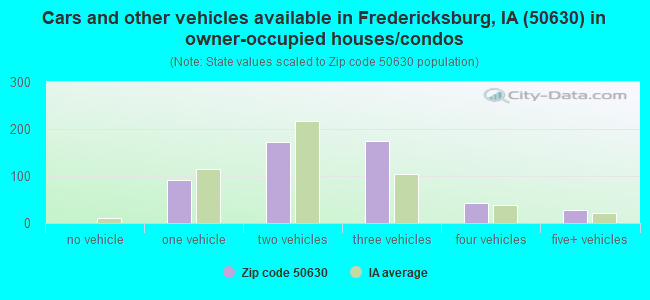
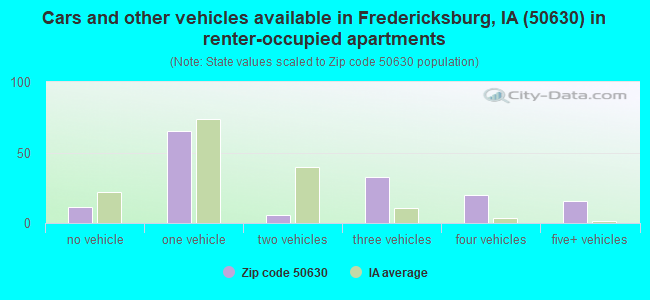
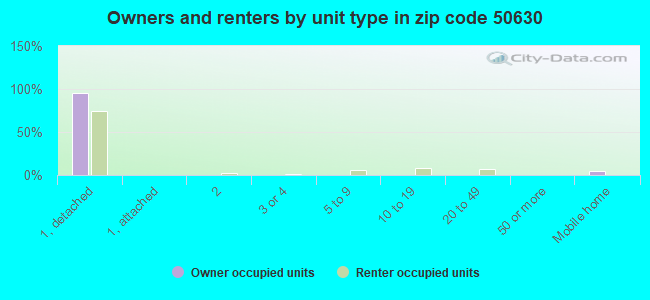
Houses and condos: 703 Renter-occupied apartments: 154
% of renters here:
23%
State:
28%
March 2022 cost of living index in zip code 50630: 83.0 (low, U.S. average is 100)
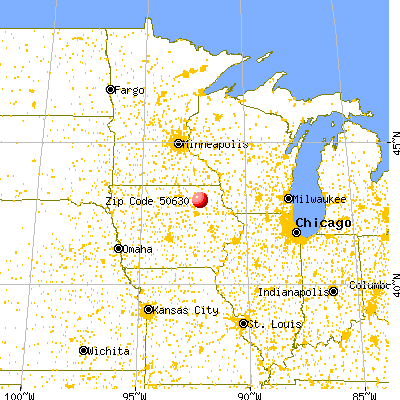
Land area: 82.8 sq. mi. Water area: 0.1 sq. mi.
Population density: 19 people per square mile
(very low).
OSM Map
General Map
Google Map
MSN Map
OSM Map
General Map
Google Map
MSN Map
OSM Map
General Map
Google Map
MSN Map
OSM Map
General Map
Google Map
MSN Map
Please wait while loading the map...
Real estate property taxes paid for housing units in 2022:
This zip code:
0.8% ($1,655)
Iowa:
1.4% ($2,724)
Median real estate property taxes paid for housing units with mortgages in 2022: $1,748 (0.8%) Median real estate property taxes paid for housing units with no mortgage in 2022: $1,477 (0.9%)
Business Search- 14 Million verified businesses
Males: 808
(51.4%)
Females: 765
(48.6%)
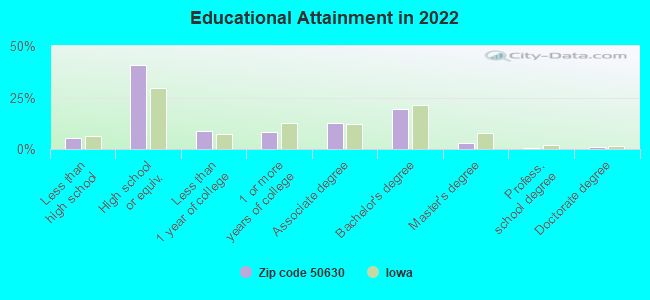
For population 25 years and over in 50630:
High school or higher: 92.7%
Bachelor's degree or higher: 23.8%
Graduate or professional degree: 4.8%
Unemployed: 0.6%
Mean travel time to work (commute): 21.5 minutes
For population 15 years and over in 50630:
Never married: 27.0%
Now married: 55.9%
Separated: 0.2%
Widowed: 10.0%
Divorced: 6.9%
Zip code 50630 compared to state average:
Unemployed percentage significantly below state average.
Black race population percentage significantly below state average.
Hispanic race population percentage below state average.
Foreign-born population percentage significantly below state average.
Length of stay since moving in significantly above state average.
Number of college students significantly below state average.
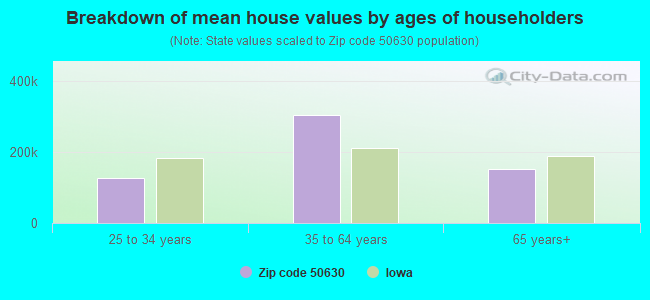
Estimated median house/condo value in 2022: $207,030
50630:
$207,030
Iowa:
$194,600
According to our research of Iowa and other state lists, there were 3 registered sex offenders living in 50630 zip code as of May 28, 2024. The ratio of all residents to sex offenders in zip code 50630 is 699 to 1. The ratio of registered sex offenders to all residents in this zip code is lower than the state average.
Median resident age:
This zip code:
41.8 years
Iowa median age:
38.9 years
Average household size:
This zip code:
2.3 people
Iowa:
2.3 people
Averages for the 2020 tax year for zip code 50630, filed in 2021:
Average Adjusted Gross Income (AGI) in 2020: $61,600 (Individual Income Tax Returns)
Here:
$61,600
State:
$71,087
Salary/wage: $49,920 (reported on 80.0% of returns)
Here:
$49,920
State:
$57,361
(% of AGI for various income ranges: 1439.2% for AGIs below $25k, 3587.9% for AGIs $25k-50k, 7164.4% for AGIs $50k-75k, 9367.1% for AGIs $75k-100k, 20394.0% for AGIs $100k-200k)
Taxable interest for individuals: $1,913 (reported on 41.3% of returns)
This zip code:
$1,913
Iowa:
$1,633
(% of AGI for various income ranges: 25.0% for AGIs below $25k, 47.9% for AGIs $25k-50k, 65.6% for AGIs $50k-75k, 52.9% for AGIs $75k-100k, 800.0% for AGIs $100k-200k)
Ordinary dividends: $2,005 (reported on 25.3% of returns)
Here:
$2,005
State:
$5,432
(% of AGI for various income ranges: 23.3% for AGIs below $25k, 26.4% for AGIs $25k-50k, 65.6% for AGIs $50k-75k, 68.6% for AGIs $75k-100k, 418.0% for AGIs $100k-200k)
Net capital gain/loss in AGI: +$8,547 (reported on 22.7% of returns)
Here:
+$8,547
State:
+$15,243
(% of AGI for various income ranges: 22.5% for AGIs below $25k, 66.4% for AGIs $25k-50k, 82.2% for AGIs $50k-75k, 91.4% for AGIs $75k-100k, 2390.0% for AGIs $100k-200k)
Profit/loss from business: +$7,609 (reported on 14.7% of returns)
Here:
+$7,609
State:
+$11,763
(% of AGI for various income ranges: 157.5% for AGIs below $25k, 245.0% for AGIs $25k-50k, 245.6% for AGIs $50k-75k, 168.0% for AGIs $100k-200k)
Taxable individual retirement arrangement distribution: $11,011 (reported on 12.0% of returns)
50630:
$11,011
Iowa:
$17,324
(% of AGI for various income ranges: 93.3% for AGIs below $25k, 254.3% for AGIs $25k-50k, 747.1% for AGIs $75k-100k)
Total itemized deductions: $33,650 (reported on 2.7% of returns)
Here:
$33,650
State:
$33,775
(% of AGI for various income ranges: 560.8% for AGIs below $25k)
Taxes paid: $6,450 (reported on 2.7% of returns)
50630:
$6,450
State:
$7,704
(% of AGI for various income ranges: 107.5% for AGIs below $25k)
Earned income credit: $2,050 (reported on 10.7% of returns)
Here:
$2,050
State:
$2,195
(% of AGI for various income ranges: 63.3% for AGIs below $25k, 62.9% for AGIs $25k-50k)
Percentage of individuals using paid preparers for their 2020 taxes: 96.0%
Here:
96%
State:
95%
(% for various income ranges: 90.5% for AGIs below $25k, 100.0% for AGIs $25k-50k, 92.9% for AGIs $50k-75k, 100.0% for AGIs $75k-100k, 100.0% for AGIs $100k-200k)
Averages for the 2012 tax year for zip code 50630, filed in 2013:
Average Adjusted Gross Income (AGI) in 2012: $53,563 (Individual Income Tax Returns)
Here:
$53,563
State:
$58,860
Salary/wage: $42,914 (reported on 80.8% of returns)
Here:
$42,914
State:
$46,659
(% of AGI for various income ranges: 72.4% for AGIs below $25k, 77.1% for AGIs $25k-50k, 80.2% for AGIs $50k-75k, 66.4% for AGIs $75k-100k, 45.3% for AGIs $100k-200k)
Taxable interest for individuals: $1,919 (reported on 47.4% of returns)
This zip code:
$1,919
Iowa:
$1,537
(% of AGI for various income ranges: 4.0% for AGIs below $25k, 2.4% for AGIs $25k-50k, 1.1% for AGIs $50k-75k, 1.1% for AGIs $75k-100k, 1.6% for AGIs $100k-200k)
Ordinary dividends: $1,300 (reported on 26.9% of returns)
Here:
$1,300
State:
$4,542
(% of AGI for various income ranges: 1.1% for AGIs below $25k, 0.8% for AGIs $25k-50k, 0.6% for AGIs $50k-75k, 0.5% for AGIs $75k-100k, 0.6% for AGIs $100k-200k)
Net capital gain/loss in AGI: +$7,287 (reported on 19.2% of returns)
Here:
+$7,287
State:
+$11,802
(% of AGI for various income ranges: 0.4% for AGIs $50k-75k, 0.5% for AGIs $75k-100k, 7.4% for AGIs $100k-200k)
Profit/loss from business: +$6,200 (reported on 15.4% of returns)
Here:
+$6,200
State:
+$10,509
(% of AGI for various income ranges: 6.5% for AGIs below $25k, 1.4% for AGIs $25k-50k, 5.9% for AGIs $75k-100k)
Taxable individual retirement arrangement distribution: $6,890 (reported on 12.8% of returns)
50630:
$6,890
Iowa:
$11,773
(% of AGI for various income ranges: 2.7% for AGIs $25k-50k, 0.9% for AGIs $50k-75k, 5.2% for AGIs $75k-100k)
Total itemized deductions: $18,541 (19% of AGI, reported on 21.8% of returns)
Here:
$18,541
State:
$21,278
Here:
19.4% of AGI
State:
18.9% of AGI
(% of AGI for various income ranges: 7.5% for AGIs $25k-50k, 7.7% for AGIs $50k-75k, 7.0% for AGIs $75k-100k, 9.3% for AGIs $100k-200k)
Charity contributions: $2,433 (reported on 19.2% of returns)
Here:
$2,433
State:
$4,044
(% of AGI for various income ranges: 1.5% for AGIs below $25k, 0.9% for AGIs $50k-75k, 1.0% for AGIs $75k-100k, 1.1% for AGIs $100k-200k)
Taxes paid: $7,412 (reported on 21.8% of returns)
50630:
$7,412
State:
$8,846
(% of AGI for various income ranges: 1.7% for AGIs $25k-50k, 2.2% for AGIs $50k-75k, 3.5% for AGIs $75k-100k, 4.6% for AGIs $100k-200k)
Earned income credit: $1,800 (reported on 12.8% of returns)
Here:
$1,800
State:
$2,098
(% of AGI for various income ranges: 4.0% for AGIs below $25k, 0.9% for AGIs $25k-50k)
Percentage of individuals using paid preparers for their 2012 taxes: 73.1%
Here:
73%
State:
65%
(% for various income ranges: 66.7% for AGIs below $25k, 66.7% for AGIs $25k-50k, 81.2% for AGIs $50k-75k, 77.8% for AGIs $75k-100k, 87.5% for AGIs $100k-200k)
Averages for the 2004 tax year for zip code 50630, filed in 2005:
Average Adjusted Gross Income (AGI) in 2004: $32,576 (Individual Income Tax Returns)
Here:
$32,576
State:
$43,875
Salary/wage: $29,466 (reported on 79.6% of returns)
Here:
$29,466
State:
$38,265
(% of AGI for various income ranges: 111.9% for AGIs below $10k, 63.5% for AGIs $10k-25k, 78.9% for AGIs $25k-50k, 74.4% for AGIs $50k-75k, 77.0% for AGIs $75k-100k, 41.6% for AGIs over 100k)
Taxable interest for individuals: $1,834 (reported on 55.1% of returns)
This zip code:
$1,834
Iowa:
$1,768
(% of AGI for various income ranges: 17.6% for AGIs below $10k, 7.3% for AGIs $10k-25k, 2.9% for AGIs $25k-50k, 1.2% for AGIs $50k-75k, 2.1% for AGIs $75k-100k, 1.5% for AGIs over 100k)
Taxable dividends: $996 (reported on 31.8% of returns)
Here:
$996
State:
$2,510
(% of AGI for various income ranges: 2.7% for AGIs below $10k, 2.2% for AGIs $10k-25k, 0.7% for AGIs $25k-50k, 0.9% for AGIs $50k-75k, 0.2% for AGIs $75k-100k, 1.0% for AGIs over 100k)
Net capital gain/loss: +$3,644 (reported on 22.0% of returns)
Here:
+$3,644
State:
+$6,139
(% of AGI for various income ranges: -0.4% for AGIs below $10k, 3.0% for AGIs $10k-25k, 0.3% for AGIs $25k-50k, 1.8% for AGIs $50k-75k, 10.6% for AGIs $75k-100k)
Profit/loss from business: +$6,373 (reported on 17.0% of returns)
Here:
+$6,373
State:
+$8,574
(% of AGI for various income ranges: 10.8% for AGIs below $10k, 4.1% for AGIs $10k-25k, 2.3% for AGIs $25k-50k, 5.7% for AGIs $50k-75k, 1.9% for AGIs $75k-100k)
Profit/loss from farming: +$1,618 (reported on 13.9% of returns)
Here:
+$1,618
State:
-$74
(% of AGI for various income ranges: 1.1% for AGIs below $10k, 0.2% for AGIs $10k-25k, 1.5% for AGIs $25k-50k, -0.8% for AGIs $50k-75k, 2.6% for AGIs $75k-100k)
IRA payment deduction: $2,735 (reported on 4.3% of returns)
50630:
$2,735
Iowa:
$2,970
Total itemized deductions: $13,747 (26% of AGI, reported on 19.5% of returns)
Here:
$13,747
State:
$16,976
Here:
25.8% of AGI
State:
20.8% of AGI
(% of AGI for various income ranges: 11.3% for AGIs $10k-25k, 8.5% for AGIs $25k-50k, 6.0% for AGIs $50k-75k, 10.5% for AGIs $75k-100k, 7.5% for AGIs over 100k)
Charity contributions deductions: $2,056 (4% of AGI, reported on 15.7% of returns)
Here:
$2,056
State:
$3,089
Here:
3.6% of AGI
State:
3.6% of AGI
(% of AGI for various income ranges: 1.0% for AGIs $10k-25k, 0.7% for AGIs $25k-50k, 0.9% for AGIs $50k-75k, 1.8% for AGIs $75k-100k, 1.3% for AGIs over 100k)
Total tax: $3,655 (reported on 74.4% of returns)
50630:
$3,655
State:
$6,177
(% of AGI for various income ranges: 6.4% for AGIs below $10k, 4.5% for AGIs $10k-25k, 6.1% for AGIs $25k-50k, 8.7% for AGIs $50k-75k, 10.2% for AGIs $75k-100k, 17.2% for AGIs over 100k)
Earned income credit: $1,387 (reported on 13.4% of returns)
Here:
$1,387
State:
$1,540
Percentage of individuals using paid preparers for their 2004 taxes: 78.0%
Here:
78%
State:
70%
(% for various income ranges: 71.6% for AGIs below $10k, 79.4% for AGIs $10k-25k, 78.4% for AGIs $25k-50k, 81.1% for AGIs $50k-75k, 81.4% for AGIs $75k-100k, 94.4% for AGIs over 100k)
Household received Food Stamps/SNAP in the past 12 months: 29 Household did not receive Food Stamps/SNAP in the past 12 months: 636
Women who had a birth in the past 12 months: 39 (34 now married, 5 unmarried) Women who did not have a birth in the past 12 months: 230 (89 now married, 141 unmarried)
Housing units in zip code 50630 with a mortgage: 294 (42 second mortgage, 31 both second mortgage and home equity loan) Houses without a mortgage: 15
Median monthly owner costs for units with a mortgage: $1,255 Median monthly owner costs for units without a mortgage: $532
Residents with income below the poverty level in 2022:
This zip code:
8.3%
Whole state:
11.0%
Residents with income below 50% of the poverty level in 2022:
This zip code:
4.4%
Whole state:
5.5%
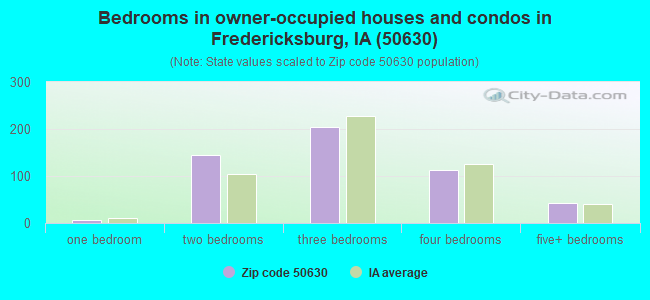
Median number of rooms in houses and condos:
Here:
6.5
State:
6.8
Median number of rooms in apartments:
Here:
5.4
State:
4.2
Notable locations in this zip code not listed on our city pages
Notable locations in zip code 50630: Plum Creek Country Club (A), Hawkeye Buffalo Ranch (B), Fredericksburg Farmers Co-op Elevator (C), Chickasaw Ambulance Fredericksburg (D), Fredericksburg Fire Department (E), Fredericksburg Municipal Hall (F), Upham Memorial Library (G). Display/hide their locations on the map
Churches in zip code 50630 include: Hillcrest Baptist Church (A), Saint Fredericks Catholic Church (B), Peace United Church of Christ (C), Saint Pauls Lutheran Church (D), Church of the Brethren (E). Display/hide their locations on the map
Cemeteries: Boyd Cemetery (1), Rose Hill Cemetery (2), Saint Johns Cemetery (3), West Cemetery (4), Maple Grove Cemetery (5), Mentor Cemetery (6), Union Cemetery (7). Display/hide their locations on the map
Parks in zip code 50630 include: Justen Wildlife Area (1), Odessa Avenue Park (2), Fredericksburg Wildlife Area (3), Split Rock County Park (4). Display/hide their locations on the map
In group quarters: 29 (-1 institutionalized population)
Size of family households: 220 2-persons, 62 3-persons, 67 4-persons, 39 5-persons, 22 6-persons, 21 7-or-more-persons
Size of nonfamily households: 199 1-person, 30 2-persons
298 married couples with children.
34 single-parent households (11 men, 23 women).
98.2% of residents of 50630 zip code speak English at home.
1.5% of residents speak Spanish at home (29% very well, 38% well, 14% not well, 19% not at all).
0.6% of residents speak other language at home (100% very well).
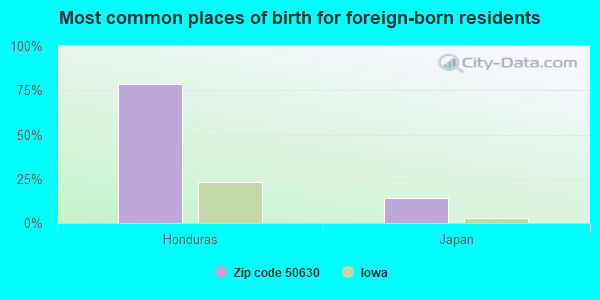
Foreign born population: 14 (0.9%) (14.7% of them are naturalized citizens)
This zip code:
0.9%
Whole state:
6.0%
79%Honduras
14%Japan
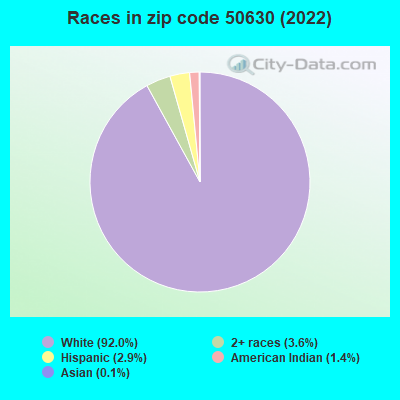
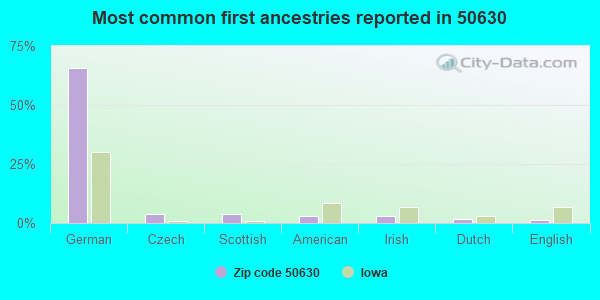
66%German
4%Czech
4%Scottish
3%American
3%Irish
2%Dutch
1%English
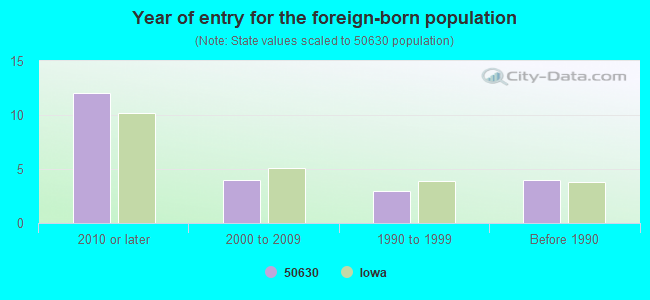
Year of entry for the foreign-born population
122010 or later
42000 to 2009
31990 to 1999
4Before 1990
Facilities with environmental interests located in this zip code:
CON AGRA DAIRY (341 SOUTH JEFFERSON AVENUE in FREDERICKSBURG, IA)
AIR SYNTHETIC MINOR (AIRS/AFS) (Integrated Compliance Information System) - ICIS-07-1978-0002, FORMAL ENFORCEMENT ACTION COMPLIANCE ACTIVITY (Tracking inspections of insecticide, fungicide, and rodenticide, and toxic substances) (Resource Conservation and Recovery Act (tracking hazardous waste)) - ICIS-, ENFORCEMENT/COMPLIANCE ACTIVITY TRI REPORTER (Tracking of toxic chemicals releasing facilities) Business SIC classification: CREAMERY BUTTER; NATURAL, PROCESSED, AND IMITATION CHEESE Organizations: CONAGRA FOOD CO (CONTACT/OPERATOR)
, CONAGRA FOODS CO (CONTACT/OWNER)
Alternative names: BEATRICE CHEESE INC, CONAGRA DAIRY FOODS
AVEKA MANUFACTURING (279 NORTH WOODWARD in FREDERICKSBURG, IA)
AIR SYNTHETIC MINOR (AIRS/AFS) (Integrated Compliance Information System) - ICIS-07-2002-0241, FORMAL ENFORCEMENT ACTION CRITERIA AND HAZARDOUS AIR POLLUTANT INVENTORY (Inventory of air pollution sources) HAZARDOUS WASTE BIENNIAL REPORTER (Resource Conservation and Recovery Act (tracking hazardous waste)) Large Quantity Generators, more that 1000 kg of hazardous waste/month (Resource Conservation and Recovery Act (tracking hazardous waste)) TRI REPORTER (Tracking of toxic chemicals releasing facilities) Business SIC classification: CHEMICALS AND CHEMICAL PREPARATIONS Business NAICS classification: ALL OTHER MISCELLANEOUS CHEMICAL PRODUCT AND PREPARATION MANUFACTURING. Organizations: JOHN ANDERSON (CONTACT/OPERATOR)
, WILLIAM A HENDRICKSON (CONTACT/OWNER)
Alternative names: ASSOCIATED MILK PRODUCERS
TOWN & COUNTRY MOBILE HOME PARK (2736 270TH STREET in FREDERICKSBURG, IA)
(Integrated Compliance Information System) - ICIS-07-1995-0100, FORMAL ENFORCEMENT ACTION COMMUNITY WATER SYSTEM (SDWIS) Alternative names: ROY R. KING TOWN & COUNTRY MHP, TOWN & COUNTRY MOBILE HOME PK
ASSOCIATED MILK PRODUCERS INC. (279 N. WOODWARD AVE. in FREDERICKSBURG, IA)
National Pollutant Discharge Elimination System NON-MAJOR (Tracking pollutant discharge elimination systems) - permit TRI REPORTER (Tracking of toxic chemicals releasing facilities) Business SIC classification: NATURAL, PROCESSED, AND IMITATION CHEESE
PLEGGENKUHLE ENTERPRISES (RURAL ROUTE 2 BOX 33 in FREDERICKSBURG, IA)
COMPLIANCE ACTIVITY (Tracking inspections of insecticide, fungicide, and rodenticide, and toxic substances) Alternative names: PLEGGENKOHLE ENT, PLEGGENKOHLE ENTERPRISES
Housing units lacking complete plumbing facilities: 0.1% Housing units lacking complete kitchen facilities: 3.0%
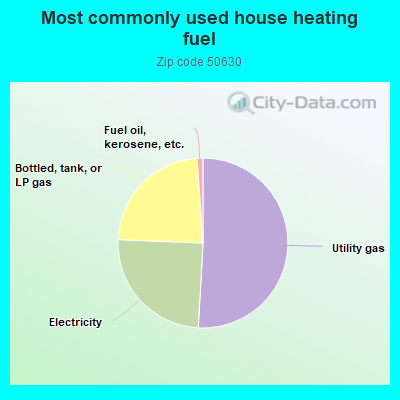
51.0%Utility gas
24.8%Electricity
23.3%Bottled, tank, or LP gas
1.1%Fuel oil, kerosene, etc.
Population in 1990: 1,830. Population change in the 1990s: +107 (+5.8%).
Place of birth for U.S.-born residents:
This state: 1,367
Midwest: 143
South: 19
West: 17
64% of the 50630 zip code residents lived in the same house 5 years ago. Out of people who lived in different houses, 61% lived in this county. Out of people who lived in different counties, 50% lived in Iowa.
97% of the 50630 zip code residents lived in the same house 1 year ago. Out of people who lived in different houses, 3% moved from this county. Out of people who lived in different houses, 91% moved from different county within same state. Out of people who lived in different houses, 19% moved from abroad.
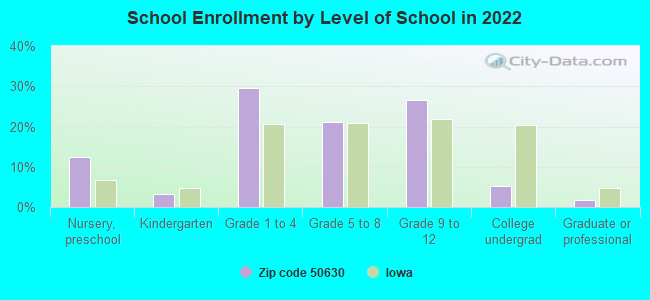
Private vs. public school enrollment:
Students in private schools in grades 1 to 8 (elementary and middle school): 4
Here:
3.0%
Iowa:
10.6%
Students in private schools in grades 9 to 12 (high school):
Here:
0.0%
Iowa:
7.9%
Students in private undergraduate colleges: 5
Here:
38.4%
Iowa:
23.9%
Occupation by median earnings in the past 12 months ($)
70,243Management occupations
67,706Architecture and engineering occupations
62,317Business and financial operations occupations
61,662Health diagnosing and treating practitioners and other technical occupations
59,030Installation, maintenance, and repair occupations
57,150Transportation occupations
Companies with federal contracts located in this zip code:
CAHOY PUMP SERVICES INC (411 E MAIN ST in FREDERICKSBURG, IA; small business) : $91,160 in 3 contractsin 2006
$49,172 with Army for Construction of Structures and Facilities -- Water Supply Facilities. Taking place in KS. Signed on 2006-06-19. Effective on 2006-06-15. Completion date: 2006-05-06.
$41,988, same as above.Signed on 2006-04-06. Completion date: 2006-05-05.
$0, same as above.Signed on 2006-05-19. Effective on 2006-05-18. Completion date: 2006-05-06.
Top industries in this zip code by the number of employees in 2005:
Construction: Water and Sewer Line and Related Structures Construction (20-49 employees: 1 establishment)
Wholesale Trade: Grain and Field Bean Merchant Wholesalers (20-49: 1)
Health Care and Social Assistance: Ambulance Services (20-49: 1)
Other Services (except Public Administration): Religious Organizations (10-19: 1, 1-4: 2)
Construction: Plumbing, Heating, and Air-Conditioning Contractors (10-19: 1, 1-4: 1)
Real Estate and Rental and Leasing: Video Tape and Disc Rental (10-19: 1)
People in group quarters in 2000:
25 people in nursing homes
3 people in other nonhousehold living situations
Fatal accident statistics in 2012:
Fatal accident count: 1
Vehicles involved in fatal accidents: 2
Fatal accidents caused by drunken drivers: 0
Fatalities: 1
Persons involved in fatal accidents: 2
Pedestrians involved in fatal accidents: 0
Fatal accident statistics in 2011:
Fatal accident count: 1
Vehicles involved in fatal accidents: 1
Fatal accidents caused by drunken drivers: 0
Fatalities: 1
Persons involved in fatal accidents: 1
Pedestrians involved in fatal accidents: 1
2004 - 2018 National Fire Incident Reporting System (NFIRS) incidents
According to the data from the years 2004 - 2018 the average number of fires per year is 9. The highest number of reported fire incidents - 23 took place in 2014, and the least - 0 in 2006. The data has a declining trend.
When looking into fire subcategories, the most reports belonged to: Structure Fires (40.2%), and Outside Fires (30.3%).
Fire incident types reported to NFIRS in Zip Code 50630


+$1,618
-$74
(% of AGI for various income ranges: 1.1% for AGIs below $10k, 0.2% for AGIs $10k-25k, 1.5% for AGIs $25k-50k, -0.8% for AGIs $50k-75k, 2.6% for AGIs $75k-100k) Nearest zip codes: 50674, 52154, 50676, 50659, 52171, 50645.
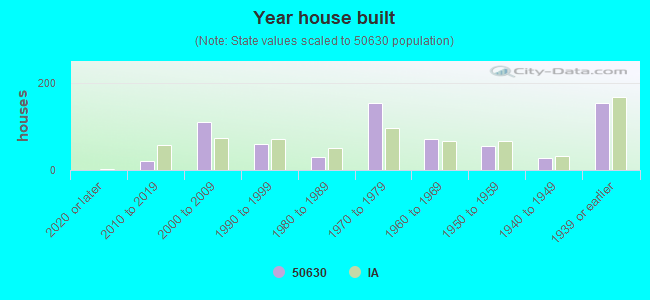


 According to the data from the years 2004 - 2018 the average number of fires per year is 9. The highest number of reported fire incidents - 23 took place in 2014, and the least - 0 in 2006. The data has a declining trend.
 When looking into fire subcategories, the most reports belonged to: Structure Fires (40.2%), and Outside Fires (30.3%).