Estimated zip code population in 2022: 2,686 Zip code population in 2010: 2,841 Zip code population in 2000: 2,950
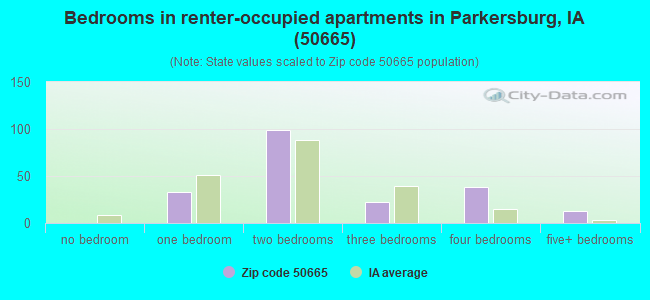
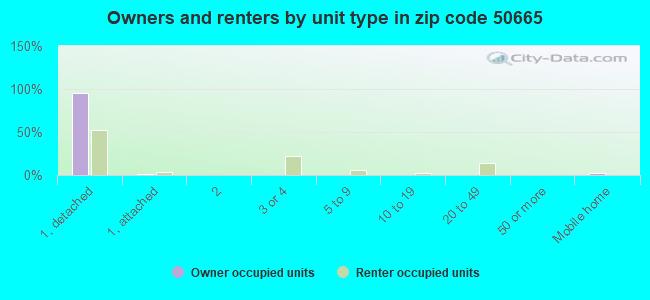
Houses and condos: 1,324 Renter-occupied apartments: 201
% of renters here:
18%
State:
28%
March 2022 cost of living index in zip code 50665: 83.4 (less than average, U.S. average is 100)
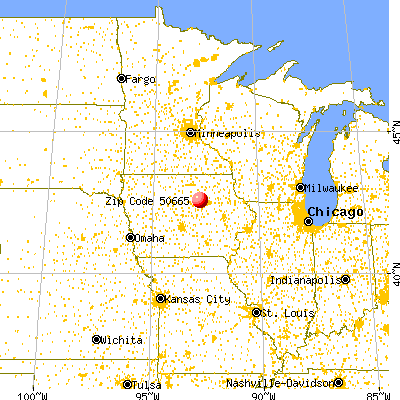
Land area: 97.8 sq. mi. Water area: 0.0 sq. mi.
Population density: 27 people per square mile
(very low).
OSM Map
General Map
Google Map
MSN Map
OSM Map
General Map
Google Map
MSN Map
OSM Map
General Map
Google Map
MSN Map
OSM Map
General Map
Google Map
MSN Map
Please wait while loading the map...
Real estate property taxes paid for housing units in 2022:
This zip code:
1.2% ($2,611)
Iowa:
1.4% ($2,724)
Median real estate property taxes paid for housing units with mortgages in 2022: $2,630 (1.2%) Median real estate property taxes paid for housing units with no mortgage in 2022: $2,476 (1.1%)
Business Search- 14 Million verified businesses
Males: 1,392
(51.8%)
Females: 1,294
(48.2%)
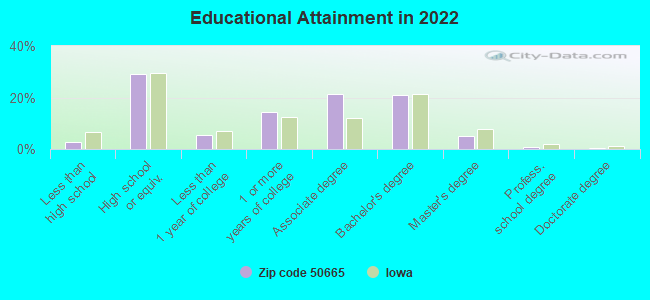
For population 25 years and over in 50665:
High school or higher: 96.7%
Bachelor's degree or higher: 26.7%
Graduate or professional degree: 6.0%
Unemployed: 2.2%
Mean travel time to work (commute): 26.8 minutes
For population 15 years and over in 50665:
Never married: 23.1%
Now married: 59.4%
Separated: 0.0%
Widowed: 6.8%
Divorced: 10.6%
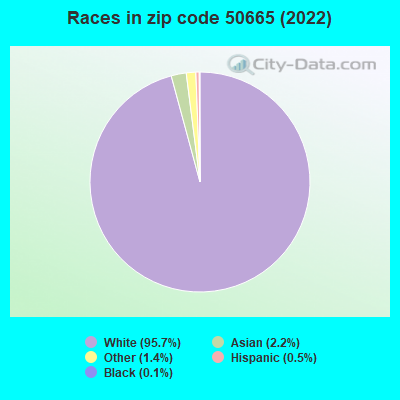
Zip code 50665 compared to state average:
Black race population percentage significantly below state average.
Hispanic race population percentage significantly below state average.
Median age above state average.
Foreign-born population percentage significantly below state average.
Renting percentage below state average.
Length of stay since moving in significantly above state average.
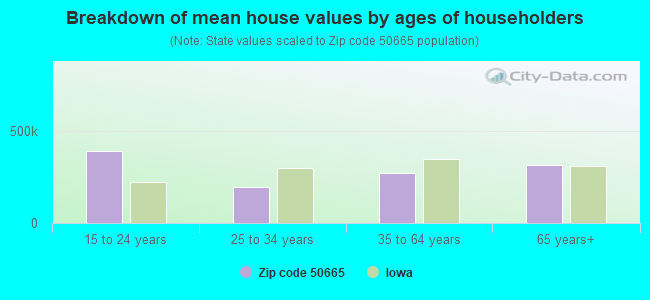
Estimated median house/condo value in 2022: $224,069
50665:
$224,069
Iowa:
$194,600
According to our research of Iowa and other state lists, there were 5 registered sex offenders living in 50665 zip code as of May 28, 2024. The ratio of all residents to sex offenders in zip code 50665 is 609 to 1. The ratio of registered sex offenders to all residents in this zip code is lower than the state average.
Median resident age:
This zip code:
45.8 years
Iowa median age:
38.9 years
Average household size:
This zip code:
2.4 people
Iowa:
2.3 people
Averages for the 2020 tax year for zip code 50665, filed in 2021:
Average Adjusted Gross Income (AGI) in 2020: $75,836 (Individual Income Tax Returns)
Here:
$75,836
State:
$71,087
Salary/wage: $57,493 (reported on 79.9% of returns)
Here:
$57,493
State:
$57,361
(% of AGI for various income ranges: 1293.8% for AGIs below $25k, 3276.7% for AGIs $25k-50k, 7005.4% for AGIs $50k-75k, 8796.0% for AGIs $75k-100k, 16842.0% for AGIs $100k-200k)
Taxable interest for individuals: $1,993 (reported on 53.0% of returns)
This zip code:
$1,993
Iowa:
$1,633
(% of AGI for various income ranges: 69.5% for AGIs below $25k, 60.8% for AGIs $25k-50k, 131.5% for AGIs $50k-75k, 161.0% for AGIs $75k-100k, 158.0% for AGIs $100k-200k)
Ordinary dividends: $3,177 (reported on 23.1% of returns)
Here:
$3,177
State:
$5,432
(% of AGI for various income ranges: 31.0% for AGIs below $25k, 79.6% for AGIs $25k-50k, 84.6% for AGIs $50k-75k, 163.0% for AGIs $75k-100k, 142.7% for AGIs $100k-200k)
Net capital gain/loss in AGI: +$12,269 (reported on 23.9% of returns)
Here:
+$12,269
State:
+$15,243
(% of AGI for various income ranges: 2.9% for AGIs below $25k, 36.7% for AGIs $25k-50k, 132.3% for AGIs $50k-75k, 170.0% for AGIs $75k-100k, 504.0% for AGIs $100k-200k)
Profit/loss from business: +$13,750 (reported on 19.4% of returns)
Here:
+$13,750
State:
+$11,763
(% of AGI for various income ranges: 119.5% for AGIs below $25k, 136.7% for AGIs $25k-50k, 328.5% for AGIs $50k-75k, 285.0% for AGIs $75k-100k, 1522.7% for AGIs $100k-200k)
Taxable individual retirement arrangement distribution: $10,953 (reported on 14.2% of returns)
50665:
$10,953
Iowa:
$17,324
(% of AGI for various income ranges: 112.4% for AGIs below $25k, 132.9% for AGIs $25k-50k, 254.6% for AGIs $50k-75k, 405.0% for AGIs $75k-100k, 526.7% for AGIs $100k-200k)
Total itemized deductions: $32,862 (reported on 6.0% of returns)
Here:
$32,862
State:
$33,775
(% of AGI for various income ranges: 272.4% for AGIs below $25k, 534.6% for AGIs $50k-75k, 908.0% for AGIs $100k-200k)
Charity contributions: $12,850 (reported on 4.5% of returns)
Here:
$12,850
State:
$13,075
(% of AGI for various income ranges: 74.2% for AGIs $25k-50k, 395.3% for AGIs $100k-200k)
Taxes paid: $7,038 (reported on 6.0% of returns)
50665:
$7,038
State:
$7,704
(% of AGI for various income ranges: 32.4% for AGIs below $25k, 100.0% for AGIs $50k-75k, 243.3% for AGIs $100k-200k)
Earned income credit: $2,167 (reported on 9.0% of returns)
Here:
$2,167
State:
$2,195
(% of AGI for various income ranges: 67.1% for AGIs below $25k, 49.6% for AGIs $25k-50k)
Percentage of individuals using paid preparers for their 2020 taxes: 97.8%
Here:
98%
State:
95%
(% for various income ranges: 94.1% for AGIs below $25k, 96.9% for AGIs $25k-50k, 100.0% for AGIs $50k-75k, 100.0% for AGIs $75k-100k, 100.0% for AGIs $100k-200k, 100.0% for AGIs over 200k)
Averages for the 2012 tax year for zip code 50665, filed in 2013:
Average Adjusted Gross Income (AGI) in 2012: $64,602 (Individual Income Tax Returns)
Here:
$64,602
State:
$58,860
Salary/wage: $47,489 (reported on 81.5% of returns)
Here:
$47,489
State:
$46,659
(% of AGI for various income ranges: 74.9% for AGIs below $25k, 71.1% for AGIs $25k-50k, 73.2% for AGIs $50k-75k, 73.9% for AGIs $75k-100k, 60.3% for AGIs $100k-200k, 18.4% for AGIs over 200k)
Taxable interest for individuals: $1,573 (reported on 56.9% of returns)
This zip code:
$1,573
Iowa:
$1,537
(% of AGI for various income ranges: 1.9% for AGIs below $25k, 1.6% for AGIs $25k-50k, 1.0% for AGIs $50k-75k, 0.8% for AGIs $75k-100k, 1.3% for AGIs $100k-200k, 2.1% for AGIs over 200k)
Ordinary dividends: $2,459 (reported on 24.6% of returns)
Here:
$2,459
State:
$4,542
(% of AGI for various income ranges: 1.2% for AGIs below $25k, 0.8% for AGIs $25k-50k, 0.8% for AGIs $50k-75k, 0.8% for AGIs $75k-100k, 1.7% for AGIs $100k-200k)
Net capital gain/loss in AGI: +$18,013 (reported on 23.1% of returns)
Here:
+$18,013
State:
+$11,802
(% of AGI for various income ranges: 1.1% for AGIs $25k-50k, 0.4% for AGIs $50k-75k, 1.6% for AGIs $75k-100k, 21.0% for AGIs $100k-200k)
Profit/loss from business: +$9,296 (reported on 19.2% of returns)
Here:
+$9,296
State:
+$10,509
(% of AGI for various income ranges: 5.7% for AGIs below $25k, 2.3% for AGIs $25k-50k, 2.6% for AGIs $50k-75k, 2.0% for AGIs $75k-100k, 4.7% for AGIs $100k-200k)
Taxable individual retirement arrangement distribution: $7,833 (reported on 11.5% of returns)
50665:
$7,833
Iowa:
$11,773
(% of AGI for various income ranges: 2.9% for AGIs below $25k, 1.2% for AGIs $25k-50k, 2.0% for AGIs $50k-75k, 1.6% for AGIs $75k-100k, 1.5% for AGIs $100k-200k)
Self-employment retirement plans: $17,800 (reported on 1.5% of returns)
50665:
$17,800
Iowa:
$18,614
Total itemized deductions: $19,681 (19% of AGI, reported on 36.2% of returns)
Here:
$19,681
State:
$21,278
Here:
19.3% of AGI
State:
18.9% of AGI
(% of AGI for various income ranges: 12.2% for AGIs below $25k, 11.4% for AGIs $25k-50k, 10.5% for AGIs $50k-75k, 9.9% for AGIs $75k-100k, 13.3% for AGIs $100k-200k, 8.2% for AGIs over 200k)
Charity contributions: $3,576 (reported on 28.5% of returns)
Here:
$3,576
State:
$4,044
(% of AGI for various income ranges: 1.1% for AGIs below $25k, 1.3% for AGIs $25k-50k, 1.2% for AGIs $50k-75k, 1.0% for AGIs $75k-100k, 2.4% for AGIs $100k-200k, 1.5% for AGIs over 200k)
Taxes paid: $7,906 (reported on 36.2% of returns)
50665:
$7,906
State:
$8,846
(% of AGI for various income ranges: 2.3% for AGIs below $25k, 2.7% for AGIs $25k-50k, 3.5% for AGIs $50k-75k, 3.9% for AGIs $75k-100k, 5.9% for AGIs $100k-200k, 5.5% for AGIs over 200k)
Earned income credit: $2,169 (reported on 10.0% of returns)
Here:
$2,169
State:
$2,098
(% of AGI for various income ranges: 3.5% for AGIs below $25k, 1.0% for AGIs $25k-50k)
Percentage of individuals using paid preparers for their 2012 taxes: 80.8%
Here:
81%
State:
65%
(% for various income ranges: 76.3% for AGIs below $25k, 77.4% for AGIs $25k-50k, 82.6% for AGIs $50k-75k, 82.4% for AGIs $75k-100k, 88.9% for AGIs $100k-200k, 100.0% for AGIs over 200k)
Averages for the 2004 tax year for zip code 50665, filed in 2005:
Average Adjusted Gross Income (AGI) in 2004: $39,313 (Individual Income Tax Returns)
Here:
$39,313
State:
$43,875
Salary/wage: $35,646 (reported on 80.5% of returns)
Here:
$35,646
State:
$38,265
(% of AGI for various income ranges: 74.0% for AGIs below $10k, 61.7% for AGIs $10k-25k, 72.5% for AGIs $25k-50k, 82.4% for AGIs $50k-75k, 79.6% for AGIs $75k-100k, 54.9% for AGIs over 100k)
Taxable interest for individuals: $1,432 (reported on 63.5% of returns)
This zip code:
$1,432
Iowa:
$1,768
(% of AGI for various income ranges: 6.4% for AGIs below $10k, 4.6% for AGIs $10k-25k, 2.7% for AGIs $25k-50k, 1.9% for AGIs $50k-75k, 0.5% for AGIs $75k-100k, 2.0% for AGIs over 100k)
Taxable dividends: $1,518 (reported on 28.5% of returns)
Here:
$1,518
State:
$2,510
(% of AGI for various income ranges: 2.7% for AGIs below $10k, 1.6% for AGIs $10k-25k, 1.0% for AGIs $25k-50k, 0.8% for AGIs $50k-75k, 1.5% for AGIs $75k-100k, 0.8% for AGIs over 100k)
Net capital gain/loss: +$2,841 (reported on 25.7% of returns)
Here:
+$2,841
State:
+$6,139
(% of AGI for various income ranges: -1.1% for AGIs below $10k, 1.0% for AGIs $10k-25k, 1.3% for AGIs $25k-50k, 1.5% for AGIs $50k-75k, 0.8% for AGIs $75k-100k, 6.1% for AGIs over 100k)
Profit/loss from business: +$4,329 (reported on 19.7% of returns)
Here:
+$4,329
State:
+$8,574
(% of AGI for various income ranges: 10.3% for AGIs below $10k, 5.3% for AGIs $10k-25k, 1.1% for AGIs $25k-50k, 1.5% for AGIs $50k-75k, 4.1% for AGIs $75k-100k, -0.2% for AGIs over 100k)
Profit/loss from farming: +$3,910 (reported on 10.3% of returns)
Here:
+$3,910
State:
-$74
(% of AGI for various income ranges: -7.3% for AGIs below $10k, -0.2% for AGIs $10k-25k, 2.5% for AGIs $25k-50k, 2.6% for AGIs $50k-75k, -1.6% for AGIs over 100k)
IRA payment deduction: $3,296 (reported on 5.5% of returns)
50665:
$3,296
Iowa:
$2,970
Self-employed pension: $5,273 (reported on 0.9% of returns)
Here:
$5,273
Iowa:
$11,928
Total itemized deductions: $15,130 (25% of AGI, reported on 31.5% of returns)
Here:
$15,130
State:
$16,976
Here:
25.2% of AGI
State:
20.8% of AGI
(% of AGI for various income ranges: 25.4% for AGIs below $10k, 14.1% for AGIs $10k-25k, 10.0% for AGIs $25k-50k, 9.9% for AGIs $50k-75k, 13.8% for AGIs $75k-100k, 15.3% for AGIs over 100k)
Charity contributions deductions: $2,595 (4% of AGI, reported on 27.1% of returns)
Here:
$2,595
State:
$3,089
Here:
4.2% of AGI
State:
3.6% of AGI
(% of AGI for various income ranges: 1.6% for AGIs below $10k, 1.6% for AGIs $10k-25k, 1.3% for AGIs $25k-50k, 1.7% for AGIs $50k-75k, 2.1% for AGIs $75k-100k, 2.7% for AGIs over 100k)
Total tax: $4,273 (reported on 79.6% of returns)
50665:
$4,273
State:
$6,177
(% of AGI for various income ranges: 3.5% for AGIs below $10k, 4.1% for AGIs $10k-25k, 6.2% for AGIs $25k-50k, 8.4% for AGIs $50k-75k, 10.3% for AGIs $75k-100k, 16.0% for AGIs over 100k)
Earned income credit: $1,523 (reported on 10.2% of returns)
Here:
$1,523
State:
$1,540
Percentage of individuals using paid preparers for their 2004 taxes: 83.9%
Here:
84%
State:
70%
(% for various income ranges: 77.6% for AGIs below $10k, 85.0% for AGIs $10k-25k, 82.2% for AGIs $25k-50k, 86.2% for AGIs $50k-75k, 91.6% for AGIs $75k-100k, 91.8% for AGIs over 100k)
Household received Food Stamps/SNAP in the past 12 months: 73 Household did not receive Food Stamps/SNAP in the past 12 months: 1,044
Women who had a birth in the past 12 months: 5 (5 now married, 0 unmarried) Women who did not have a birth in the past 12 months: 548 (273 now married, 274 unmarried)
Housing units in zip code 50665 with a mortgage: 554 (107 second mortgage, 4 home equity loan, 67 both second mortgage and home equity loan) Houses without a mortgage: 63
Median monthly owner costs for units with a mortgage: $1,534 Median monthly owner costs for units without a mortgage: $596
Residents with income below the poverty level in 2022:
This zip code:
13.4%
Whole state:
11.0%
Residents with income below 50% of the poverty level in 2022:
This zip code:
5.6%
Whole state:
5.5%
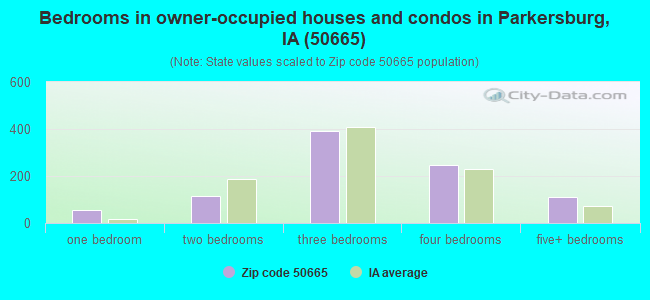
Median number of rooms in houses and condos:
Here:
7.2
State:
6.8
Median number of rooms in apartments:
Here:
4.3
State:
4.2
Notable locations in this zip code not listed on our city pages
Notable locations in zip code 50665: Sinclair (A), Sinclair Elevator Incorporated Elevator (B), Wagoner Supply and Elevator Incorporated Elevator (C), Parkersburg (D), Beaver Meadows Golf Club (E), Parkersburg City Hall (F), Parkersburg Police Department (G), Parkersburg Historical Home (H), Parkersburg Public Library (I), Parkersburg Ambulance Service (J), Stout Community Fire Department (K), Parkersburg Fire Department (L), Stout City Hall (M). Display/hide their locations on the map
Churches in zip code 50665 include: Reformed Church of Stout (A), Plymouth Brethren Gospel Hall (B), Parkersburg United Methodist Church (C), Saint Patricks Church (D), Calvary Baptist Church (E), Hope Reformed Church (F), Christian Reformed Church (G), First Congregational Church (H), Bethel Lutheran Church (I). Display/hide their locations on the map
Cemeteries: Saint Clair Gravel Cemetery (1), Parker Burial Grounds (2), Buck Grove Cemetery (3), Saint Patricks Catholic Cemetery (4), Salem Cemetery (5), Oak Hill Cemetery (6), Codner Cemetery (7). Display/hide their locations on the map
Parks in zip code 50665 include: Big Marsh Wildlife Area (1), Depot-Caboose Riverfront Park (2), Ed Thomas Field (3), Beaver Meadows County Park (4), Helt Memorial Reserve (5). Display/hide their locations on the map
In group quarters: 31 (-1 institutionalized population)
Size of family households: 348 2-persons, 201 3-persons, 144 4-persons, 40 5-persons, 12 6-persons, 5 7-or-more-persons
Size of nonfamily households: 323 1-person, 34 2-persons
480 married couples with children.
179 single-parent households (136 men, 43 women).
98.0% of residents of 50665 zip code speak English at home.
0.6% of residents speak Spanish at home (31% very well, 69% well).
1.5% of residents speak other Indo-European language at home (47% very well, 42% well, 11% not well).
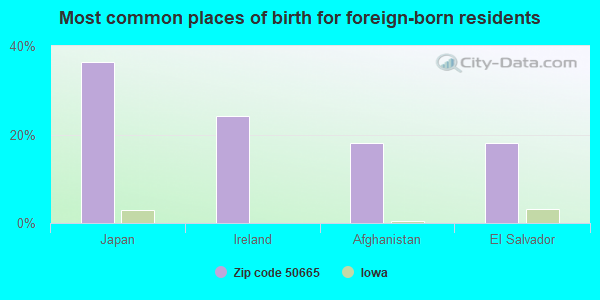
Foreign born population: 35 (1.3%) (73.4% of them are naturalized citizens)
This zip code:
1.3%
Whole state:
6.0%
36%Japan
24%Ireland
18%Afghanistan
18%El Salvador
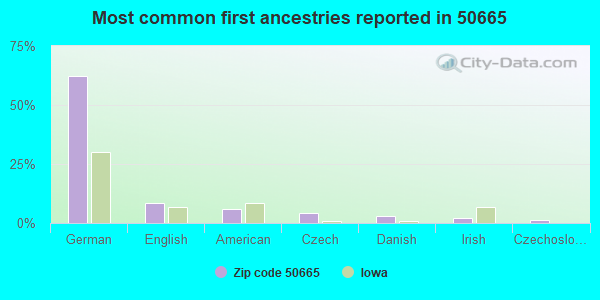
62%German
8%English
6%American
4%Czech
3%Danish
2%Irish
1%Czechoslovakian
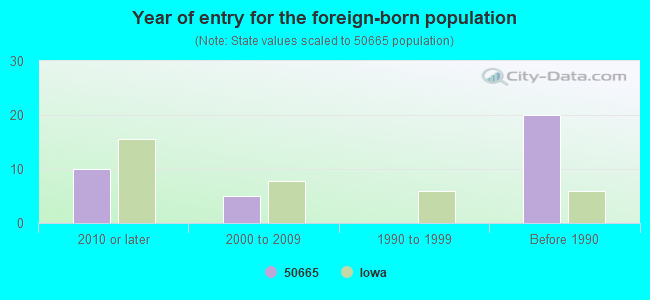
Year of entry for the foreign-born population
102010 or later
52000 to 2009
01990 to 1999
20Before 1990
Major facilities with environmental interests located in this zip code:
MONSANTO CO - PARKERSBURG (18739 HIGHWAY 20 WEST in PARKERSBURG, IA)
AIR SYNTHETIC MINOR (AIRS/AFS) (Resource Conservation and Recovery Act (tracking hazardous waste)) - ICIS-, ENFORCEMENT/COMPLIANCE ACTIVITY Business SIC classification: FLOUR AND OTHER GRAIN MILL PRODUCTS Business NAICS classification: POSTHARVEST CROP ACTIVITIES (EXCEPT COTTON GINNING).
APLINGTON-PARKERSBURG HIGH SCHOOL (610 N JOHNSON ST in PARKERSBURG, IA)
(Geographic Names Information System) Conditionally Exempt Small Quantity Generators, less than 100 kg/month of hazardous waste (Resource Conservation and Recovery Act (tracking hazardous waste)) - ICIS-, ENFORCEMENT/COMPLIANCE ACTIVITY Organizations: APLINGTON-PARKERSBURG COMM SCHOOL DIST (CONTACT/OPERATOR)
PARKERSBURG ELEMENTARY SCHOOL (602 LINCOLN in PARKERSBURG, IA)
(Geographic Names Information System) (National Center for Education Statistics) - STATE ID-125130 409 Organizations: PARKERSBURG COMM SCHOOL DISTRICT (SCHOOL DISTRICT)
SINCLAIR ELEVATOR (32746 SINCLAIR AVENUE in PARKERSBURG, IA)
(Integrated Compliance Information System) - ICIS-07-2000-0223, FORMAL ENFORCEMENT ACTION
DEANS STANDARD-FORMER SITE OF (605 6TH ST in PARKERSBURG, IA)
(Resource Conservation and Recovery Act (tracking hazardous waste)) Organizations: DEAN A PATTERSON (CONTACT/OWNER)
PARKERSBURG CITY OF STP (608 HIGHWAY 57 in PARKERSBURG, IA)
National Pollutant Discharge Elimination System NON-MAJOR (Tracking pollutant discharge elimination systems) - permit Business SIC classification: SEWERAGE SYSTEMS Organizations: CITY OF PARKERSBURG (CONTACT/OWNER)
CROELL REDI-MIX INC (302 NORTHSIDE RD in PARKERSBURG, IA)
AIR MINOR (AIRS/AFS) Business SIC classification: READY-MIXED CONCRETE Alternative names: KNOCKS BUILDING SUPPLIES
CROELL REDI-MIX INC (112 6TH ST in PARKERSBURG, IA)
AIR MINOR (AIRS/AFS) Business SIC classification: READY-MIXED CONCRETE
MS ENTERPRISES (406 HWY 20 in PARKERSBURG, IA)
(Resource Conservation and Recovery Act (tracking hazardous waste))
PARKERSBURG STREET DEPT (102 2ND ST in PARKERSBURG, IA)
(Resource Conservation and Recovery Act (tracking hazardous waste))
ROBERT DEAN (19535 HWY 57 in PARKERSBURG, IA)
Small Quantity Generators, between 100 kg and 1000 kg of hazardous waste/month (Resource Conservation and Recovery Act (tracking hazardous waste)) - notification
PARKERSBURG C S D (610 JOHNSON in PARKERSBURG, IA)
COMPLIANCE ACTIVITY (Tracking inspections of insecticide, fungicide, and rodenticide, and toxic substances)
Housing units lacking complete plumbing facilities: 1.3% Housing units lacking complete kitchen facilities: 2.0%
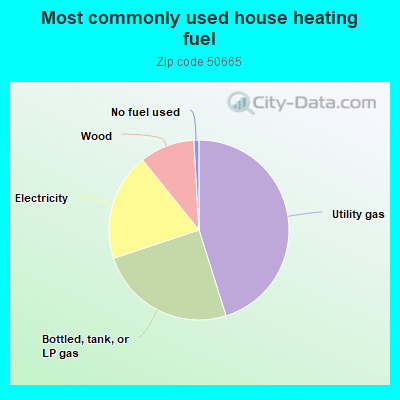
45.2%Utility gas
24.8%Bottled, tank, or LP gas
19.3%Electricity
9.9%Wood
0.9%No fuel used
Population in 1990: 3,544.
Place of birth for U.S.-born residents:
This state: 2,387
Northeast: 30
Midwest: 147
South: 55
West: 28
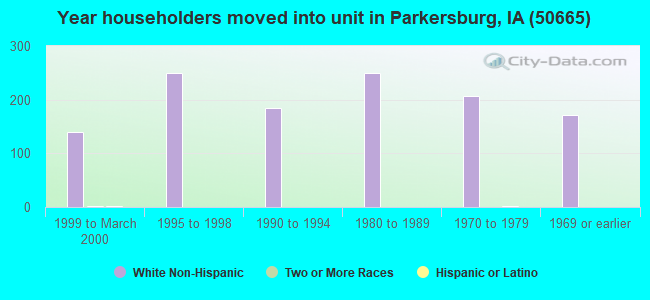
68% of the 50665 zip code residents lived in the same house 5 years ago. Out of people who lived in different houses, 47% lived in this county. Out of people who lived in different counties, 50% lived in Iowa.
96% of the 50665 zip code residents lived in the same house 1 year ago. Out of people who lived in different houses, 55% moved from this county. Out of people who lived in different houses, 43% moved from different county within same state. Out of people who lived in different houses, 8% moved from different state.
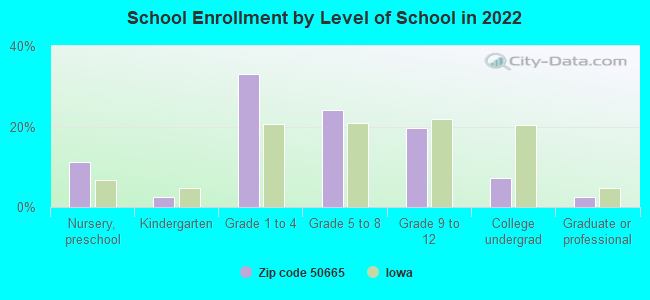
Private vs. public school enrollment:
Students in private schools in grades 1 to 8 (elementary and middle school): 3
Here:
1.0%
Iowa:
10.6%
Students in private schools in grades 9 to 12 (high school): 2
Here:
2.2%
Iowa:
7.9%
Students in private undergraduate colleges:
Here:
0.0%
Iowa:
23.9%
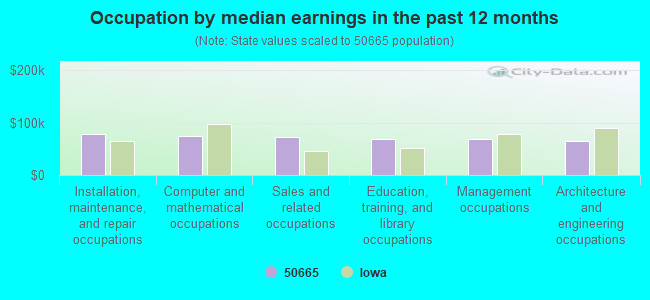
Occupation by median earnings in the past 12 months ($)
78,106Installation, maintenance, and repair occupations
74,333Computer and mathematical occupations
73,525Sales and related occupations
69,096Education, training, and library occupations
68,139Management occupations
65,908Architecture and engineering occupations
Top industries in this zip code by the number of employees in 2005:
Wholesale Trade: Grain and Field Bean Merchant Wholesalers (10-19: 1, 5-9: 1)
Accommodation and Food Services: Full-Service Restaurants (5-9: 2, 1-4: 2)
Accommodation and Food Services: Limited-Service Restaurants (10-19: 1, 1-4: 1)
Other Services (except Public Administration): Funeral Homes and Funeral Services (10-19: 1)
Health Care and Social Assistance: Offices of Physicians (except Mental Health Specialists) (10-19: 1)
Fatal accident statistics in 2013:
Fatal accident count: 1
Vehicles involved in fatal accidents: 1
Fatal accidents caused by drunken drivers: 1
Fatalities: 1
Persons involved in fatal accidents: 4
Pedestrians involved in fatal accidents: 0
Fatal accident statistics in 2011:
Fatal accident count: 1
Vehicles involved in fatal accidents: 2
Fatal accidents caused by drunken drivers: 0
Fatalities: 1
Persons involved in fatal accidents: 2
Pedestrians involved in fatal accidents: 0
2002 - 2018 National Fire Incident Reporting System (NFIRS) incidents
Based on the data from the years 2002 - 2018 the average number of fire incidents per year is 6. The highest number of reported fire incidents - 12 took place in 2009, and the least - 1 in 2005. The data has a decreasing trend.
When looking into fire subcategories, the most incidents belonged to: Outside Fires (52.7%), and Structure Fires (30.0%).
Fire incident types reported to NFIRS in Zip Code 50665


+$3,910
-$74
(% of AGI for various income ranges: -7.3% for AGIs below $10k, -0.2% for AGIs $10k-25k, 2.5% for AGIs $25k-50k, 2.6% for AGIs $50k-75k, -1.6% for AGIs over 100k)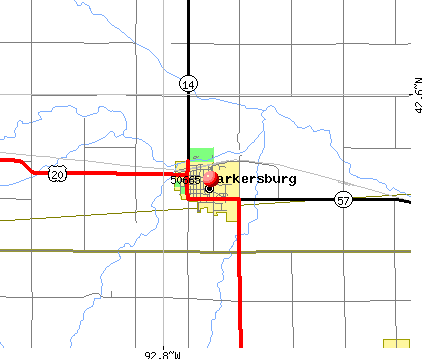 Nearest zip codes: 50673, 50604, 50660, 50642, 50624, 50602.


 Based on the data from the years 2002 - 2018 the average number of fire incidents per year is 6. The highest number of reported fire incidents - 12 took place in 2009, and the least - 1 in 2005. The data has a decreasing trend.
 When looking into fire subcategories, the most incidents belonged to: Outside Fires (52.7%), and Structure Fires (30.0%).