Estimated zip code population in 2022: 866 Zip code population in 2010: 1,033 Zip code population in 2000: 1,174
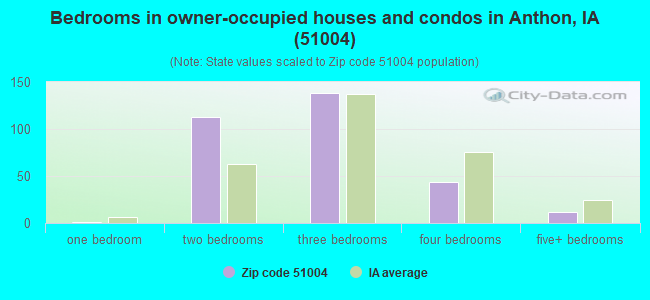
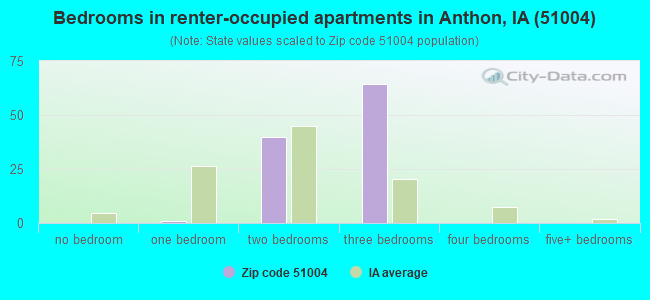
Houses and condos: 477 Renter-occupied apartments: 108
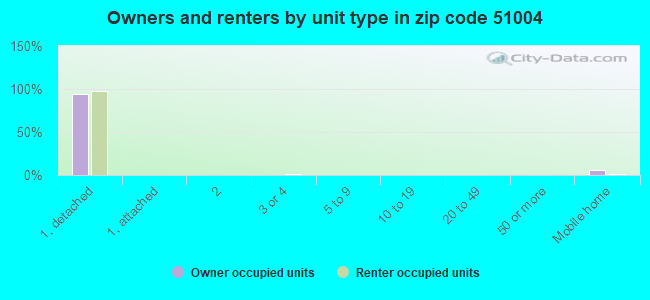
% of renters here:
26%
State:
28%
March 2022 cost of living index in zip code 51004: 83.2 (low, U.S. average is 100)
Land area: 81.9 sq. mi. Water area: 0.3 sq. mi.
Population density: 11 people per square mile
(very low).
OSM Map
General Map
Google Map
MSN Map
OSM Map
General Map
Google Map
MSN Map
OSM Map
General Map
Google Map
MSN Map
OSM Map
General Map
Google Map
MSN Map
Please wait while loading the map...
Real estate property taxes paid for housing units in 2022:
This zip code:
1.3% ($1,355)
Iowa:
1.4% ($2,724)
Median real estate property taxes paid for housing units with mortgages in 2022: $1,253 (1.3%) Median real estate property taxes paid for housing units with no mortgage in 2022: $1,425 (1.3%)
Business Search- 14 Million verified businesses
Males: 406
(46.9%)
Females: 459
(53.1%)
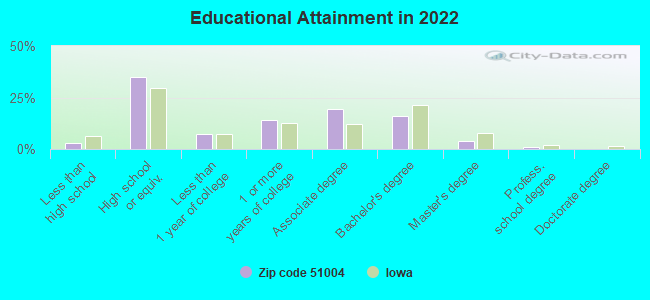
For population 25 years and over in 51004:
High school or higher: 95.7%
Bachelor's degree or higher: 20.7%
Graduate or professional degree: 5.0%
Unemployed: 2.6%
Mean travel time to work (commute): 26.9 minutes
For population 15 years and over in 51004:
Never married: 24.7%
Now married: 51.7%
Separated: 0.0%
Widowed: 9.8%
Divorced: 13.8%
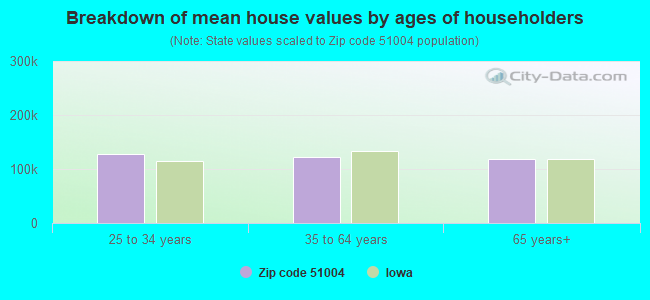
Zip code 51004 compared to state average:
Median house value below state average.
Black race population percentage significantly below state average.
Hispanic race population percentage below state average.
Median age significantly above state average.
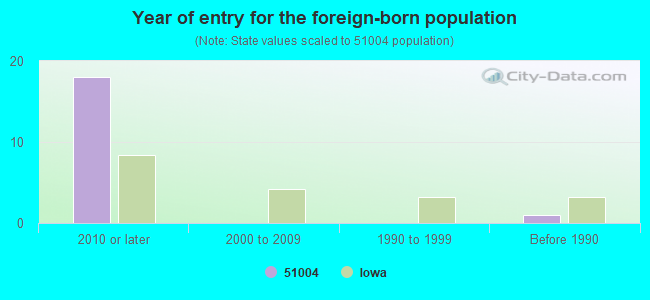
Foreign-born population percentage significantly below state average.
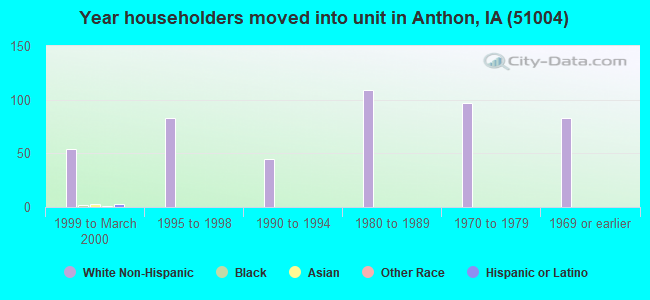
Length of stay since moving in significantly above state average.
Estimated median house/condo value in 2022: $105,123
51004:
$105,123
Iowa:
$194,600
According to our research of Iowa and other state lists, there were 2 registered sex offenders living in 51004 zip code as of May 28, 2024. The ratio of all residents to sex offenders in zip code 51004 is 565 to 1. The ratio of registered sex offenders to all residents in this zip code is near the state average.
Median resident age:
This zip code:
47.0 years
Iowa median age:
38.9 years
Average household size:
This zip code:
2.1 people
Iowa:
2.3 people
Averages for the 2020 tax year for zip code 51004, filed in 2021:
Average Adjusted Gross Income (AGI) in 2020: $65,633 (Individual Income Tax Returns)
Here:
$65,633
State:
$71,087
Salary/wage: $47,958 (reported on 82.6% of returns)
Here:
$47,958
State:
$57,361
(% of AGI for various income ranges: 1219.0% for AGIs below $25k, 3843.3% for AGIs $25k-50k, 7442.5% for AGIs $50k-75k, 10996.7% for AGIs $75k-100k, 24233.3% for AGIs $100k-200k)
Taxable interest for individuals: $1,260 (reported on 32.6% of returns)
This zip code:
$1,260
Iowa:
$1,633
(% of AGI for various income ranges: 31.0% for AGIs below $25k, 15.6% for AGIs $25k-50k, 90.0% for AGIs $50k-75k, 173.3% for AGIs $75k-100k, 186.7% for AGIs $100k-200k)
Ordinary dividends: $1,500 (reported on 15.2% of returns)
Here:
$1,500
State:
$5,432
(% of AGI for various income ranges: 54.4% for AGIs $25k-50k, 186.7% for AGIs $100k-200k)
Net capital gain/loss in AGI: +$5,200 (reported on 17.4% of returns)
Here:
+$5,200
State:
+$15,243
(% of AGI for various income ranges: 17.0% for AGIs below $25k, 232.5% for AGIs $50k-75k, 1020.0% for AGIs $100k-200k)
Profit/loss from business: +$5,625 (reported on 17.4% of returns)
Here:
+$5,625
State:
+$11,763
(% of AGI for various income ranges: 205.0% for AGIs below $25k, 333.3% for AGIs $25k-50k)
Taxable individual retirement arrangement distribution: $5,767 (reported on 6.5% of returns)
51004:
$5,767
Iowa:
$17,324
(% of AGI for various income ranges: 192.2% for AGIs $25k-50k)
Earned income credit: $2,186 (reported on 15.2% of returns)
Here:
$2,186
State:
$2,195
(% of AGI for various income ranges: 153.0% for AGIs below $25k)
Percentage of individuals using paid preparers for their 2020 taxes: 100.0%
Here:
100%
State:
95%
(% for various income ranges: 100.0% for AGIs below $25k, 100.0% for AGIs $25k-50k, 100.0% for AGIs $50k-75k, 100.0% for AGIs $75k-100k, 100.0% for AGIs $100k-200k)
Averages for the 2012 tax year for zip code 51004, filed in 2013:
Average Adjusted Gross Income (AGI) in 2012: $53,458 (Individual Income Tax Returns)
Here:
$53,458
State:
$58,860
Salary/wage: $36,395 (reported on 79.2% of returns)
Here:
$36,395
State:
$46,659
(% of AGI for various income ranges: 72.7% for AGIs below $25k, 74.9% for AGIs $25k-50k, 62.5% for AGIs $50k-75k, 72.2% for AGIs $75k-100k, 28.2% for AGIs $100k-200k)
Taxable interest for individuals: $1,176 (reported on 35.4% of returns)
This zip code:
$1,176
Iowa:
$1,537
(% of AGI for various income ranges: 2.0% for AGIs below $25k, 0.5% for AGIs $25k-50k, 1.2% for AGIs $50k-75k, 0.2% for AGIs $75k-100k, 0.6% for AGIs $100k-200k)
Ordinary dividends: $950 (reported on 12.5% of returns)
Here:
$950
State:
$4,542
(% of AGI for various income ranges: 1.0% for AGIs below $25k, 0.1% for AGIs $50k-75k, 0.3% for AGIs $100k-200k)
Net capital gain/loss in AGI: +$13,043 (reported on 14.6% of returns)
Here:
+$13,043
State:
+$11,802
Profit/loss from business: +$5,350 (reported on 20.8% of returns)
Here:
+$5,350
State:
+$10,509
(% of AGI for various income ranges: 6.8% for AGIs below $25k, 4.2% for AGIs $25k-50k, 5.2% for AGIs $75k-100k)
Taxable individual retirement arrangement distribution: $4,500 (reported on 8.3% of returns)
51004:
$4,500
Iowa:
$11,773
Total itemized deductions: $17,455 (19% of AGI, reported on 22.9% of returns)
Here:
$17,455
State:
$21,278
Here:
18.9% of AGI
State:
18.9% of AGI
(% of AGI for various income ranges: 11.3% for AGIs $25k-50k, 12.4% for AGIs $50k-75k, 7.7% for AGIs $100k-200k)
Charity contributions: $2,430 (reported on 20.8% of returns)
Here:
$2,430
State:
$4,044
(% of AGI for various income ranges: 1.3% for AGIs $25k-50k, 1.3% for AGIs $50k-75k, 1.1% for AGIs $100k-200k)
Taxes paid: $5,682 (reported on 22.9% of returns)
51004:
$5,682
State:
$8,846
(% of AGI for various income ranges: 1.5% for AGIs $25k-50k, 3.7% for AGIs $50k-75k, 3.7% for AGIs $100k-200k)
Earned income credit: $2,300 (reported on 16.7% of returns)
Here:
$2,300
State:
$2,098
(% of AGI for various income ranges: 5.6% for AGIs below $25k, 1.4% for AGIs $25k-50k)
Percentage of individuals using paid preparers for their 2012 taxes: 72.9%
Here:
73%
State:
65%
(% for various income ranges: 55.6% for AGIs below $25k, 75.0% for AGIs $25k-50k, 88.9% for AGIs $50k-75k, 100.0% for AGIs $75k-100k, 80.0% for AGIs $100k-200k)
Averages for the 2004 tax year for zip code 51004, filed in 2005:
Average Adjusted Gross Income (AGI) in 2004: $36,100 (Individual Income Tax Returns)
Here:
$36,100
State:
$43,875
Salary/wage: $29,988 (reported on 80.3% of returns)
Here:
$29,988
State:
$38,265
(% of AGI for various income ranges: 85.4% for AGIs below $10k, 62.7% for AGIs $10k-25k, 72.2% for AGIs $25k-50k, 76.8% for AGIs $50k-75k, 69.9% for AGIs $75k-100k, 42.7% for AGIs over 100k)
Taxable interest for individuals: $1,889 (reported on 47.2% of returns)
This zip code:
$1,889
Iowa:
$1,768
(% of AGI for various income ranges: 3.5% for AGIs below $10k, 6.7% for AGIs $10k-25k, 2.0% for AGIs $25k-50k, 2.3% for AGIs $50k-75k, 0.7% for AGIs $75k-100k, 1.7% for AGIs over 100k)
Taxable dividends: $1,207 (reported on 24.3% of returns)
Here:
$1,207
State:
$2,510
(% of AGI for various income ranges: 2.3% for AGIs below $10k, 1.2% for AGIs $10k-25k, 0.2% for AGIs $25k-50k, 0.1% for AGIs $50k-75k, 0.0% for AGIs $75k-100k, 2.6% for AGIs over 100k)
Net capital gain/loss: +$3,913 (reported on 23.1% of returns)
Here:
+$3,913
State:
+$6,139
(% of AGI for various income ranges: 1.2% for AGIs below $10k, 2.7% for AGIs $10k-25k, 1.3% for AGIs $25k-50k, 1.6% for AGIs $50k-75k, 7.7% for AGIs over 100k)
Profit/loss from business: +$4,978 (reported on 18.7% of returns)
Here:
+$4,978
State:
+$8,574
(% of AGI for various income ranges: 12.0% for AGIs below $10k, 4.7% for AGIs $10k-25k, 3.8% for AGIs $25k-50k, -0.2% for AGIs $50k-75k, 4.1% for AGIs $75k-100k)
Profit/loss from farming: +$726 (reported on 16.9% of returns)
Here:
+$726
State:
-$74
(% of AGI for various income ranges: -9.7% for AGIs below $10k, -0.4% for AGIs $10k-25k, -1.7% for AGIs $25k-50k, 0.5% for AGIs $50k-75k, 6.7% for AGIs $75k-100k)
IRA payment deduction: $2,273 (reported on 2.2% of returns)
51004:
$2,273
Iowa:
$2,970
Total itemized deductions: $15,224 (23% of AGI, reported on 19.7% of returns)
Here:
$15,224
State:
$16,976
Here:
22.7% of AGI
State:
20.8% of AGI
(% of AGI for various income ranges: 9.8% for AGIs $10k-25k, 7.3% for AGIs $25k-50k, 6.1% for AGIs $50k-75k, 11.5% for AGIs $75k-100k, 10.4% for AGIs over 100k)
Charity contributions deductions: $1,976 (3% of AGI, reported on 17.1% of returns)
Here:
$1,976
State:
$3,089
Here:
2.9% of AGI
State:
3.6% of AGI
(% of AGI for various income ranges: 1.2% for AGIs below $10k, 1.1% for AGIs $25k-50k, 0.5% for AGIs $50k-75k, 1.3% for AGIs $75k-100k, 1.6% for AGIs over 100k)
Total tax: $4,283 (reported on 76.7% of returns)
51004:
$4,283
State:
$6,177
(% of AGI for various income ranges: 4.3% for AGIs below $10k, 4.6% for AGIs $10k-25k, 6.3% for AGIs $25k-50k, 8.7% for AGIs $50k-75k, 11.2% for AGIs $75k-100k, 15.7% for AGIs over 100k)
Earned income credit: $1,635 (reported on 14.9% of returns)
Here:
$1,635
State:
$1,540
Percentage of individuals using paid preparers for their 2004 taxes: 79.5%
Here:
80%
State:
70%
(% for various income ranges: 70.4% for AGIs below $10k, 82.2% for AGIs $10k-25k, 80.6% for AGIs $25k-50k, 84.3% for AGIs $50k-75k, 82.4% for AGIs $75k-100k, 81.8% for AGIs over 100k)
Household received Food Stamps/SNAP in the past 12 months: 34 Household did not receive Food Stamps/SNAP in the past 12 months: 384
Women who had a birth in the past 12 months: 4 (4 now married, 0 unmarried) Women who did not have a birth in the past 12 months: 166 (54 now married, 112 unmarried)
Housing units in zip code 51004 with a mortgage: 91 (10 second mortgage, 2 both second mortgage and home equity loan) Median monthly owner costs for units with a mortgage: $981 Median monthly owner costs for units without a mortgage: $579
Residents with income below the poverty level in 2022:
This zip code:
9.7%
Whole state:
11.0%
Residents with income below 50% of the poverty level in 2022:
This zip code:
6.0%
Whole state:
5.5%
Median number of rooms in houses and condos:
Here:
6.3
State:
6.8
Median number of rooms in apartments:
Here:
5.2
State:
4.2
Notable locations in this zip code not listed on our city pages
Notable locations in zip code 51004: Discord (A), Gale (B), Piero (C), Pithan Feedlot (D), Anthon Golf Club (E), Anthon Rescue Squad (F), Anthon City Hall (G), Anthon City Police (H), Anthon Volunteer Fire Department (I), Anthon Public Library (J), Anthon Community Center (K), Woodbury County Courthouse (L). Display/hide their locations on the map
Churches in zip code 51004 include: Bethel Church (A), United Methodist Church (B), Saint Joseph's Church (C), Trinity Lutheran Church (D). Display/hide their locations on the map
Cemeteries: Oak Hill Cemetery (1), Saint Joseph's Catholic Cemetery (2), Peiro Bethel Cemetery (3), Pleasant Hill Cemetery (4), Wolf Creek Cemetery (5), Lucky Valley Cemetery (6). Display/hide their locations on the map
Rivers and creeks: East Branch Wolf Creek (A), Big Creek (B), Coon Creek (C), Rock Creek (D), Old Channel Little Sioux River (E). Display/hide their locations on the map
Size of family households: 177 2-persons, 65 3-persons, 29 4-persons, 2 5-persons, 5 6-persons
Size of nonfamily households: 113 1-person, 22 2-persons, 2 3-persons
82 married couples with children.
71 single-parent households (4 men, 67 women).
97.2% of residents of 51004 zip code speak English at home.
1.9% of residents speak Spanish at home (100% not well).
1.1% of residents speak other Indo-European language at home (100% well).
Foreign born population: 15 (1.8%) (0.0% of them are naturalized citizens)
:
1.8%
Whole state:
6.0%
93%Honduras
36%German
27%Irish
12%American
10%English
2%Dutch
1%Norwegian
1%Scandinavian
Year of entry for the foreign-born population
182010 or later
02000 to 2009
01990 to 1999
1Before 1990
Facilities with environmental interests located in this zip code:
ANTHON-OTO ELEMENTARY SCHOOL (110 W DIVISION in ANTHON, IA)
(National Center for Education Statistics) - STATE ID-970270 418 Organizations: ANTHON-OTO COMM SCHOOL DISTRICT (SCHOOL DISTRICT)
ANTHON-OTO-MAPLE VALLEY MIDDLE SCHOOL (110 W DIVISION in ANTHON, IA)
(National Center for Education Statistics) - STATE ID-970270 172 Organizations: ANTHON-OTO COMM SCHOOL DISTRICT (SCHOOL DISTRICT)
ANTHON PIT (2236 HIGHWAY 31 in ANTHON, IA)
National Pollutant Discharge Elimination System NON-MAJOR (Tracking pollutant discharge elimination systems) - permit Business SIC classification: CRUSHED AND BROKEN LIMESTONE Organizations: HALLETT MATERIALS (CONTACT/OWNER)
Alternative names: HALLETT MATERIALS
ANTHON CITY OF STP (CITY CLERK in ANTHON, IA)
National Pollutant Discharge Elimination System NON-MAJOR (Tracking pollutant discharge elimination systems) - permit Business SIC classification: SEWERAGE SYSTEMS Organizations: CITY OF ANTHON (CONTACT/OWNER)
Alternative names: ANTHON CITY OF WWTP
ANTHON-OTO COMMUNITY SCHOOL DISTRICT (110 WEST DIVISION in ANTHON, IA)
COMPLIANCE ACTIVITY (Tracking inspections of insecticide, fungicide, and rodenticide, and toxic substances) Alternative names: ANTHNO-OTO SCHOOL DIST, ANTHON-OTO COMM SCHOOLS, ANTHON-OTO CSD
BALDWIN LIVESTOCK COMPANY (3846-245TH STREET in ANTHON, IA)
National Pollutant Discharge Elimination System NON-MAJOR (Tracking pollutant discharge elimination systems) - permit Alternative names: COMFORT INN
BRIAN BALDWIN FEEDLOT (2406 MASON AVE. in ANTHON, IA)
National Pollutant Discharge Elimination System NON-MAJOR (Tracking pollutant discharge elimination systems) - permit Alternative names: SAYLORVILLE WATER TREATMENT PL
BROWER CONSTRUCTION CO-FORMER SITE OF (.6 MI S ON HWY 31 in ANTHON, IA)
(Resource Conservation and Recovery Act (tracking hazardous waste)) Business NAICS classification: ASPHALT PAVING MIXTURE AND BLOCK MANUFACTURING.
TERRAGRO INC (207 N MILLER AVE in ANTHON, IA)
AIR MINOR (AIRS/AFS) Business SIC classification: SPECIAL WAREHOUSING AND STORAGE Alternative names: AGRO DISTRIBUTION LIMITED LIABILITY COMPANY
PITHAN FEEDLOT (112 COUNTRY CLUB DRIVE in ANTHON, IA)
National Pollutant Discharge Elimination System NON-MAJOR (STATE)
Housing units lacking complete plumbing facilities: 0.4% Housing units lacking complete kitchen facilities: 0.3%
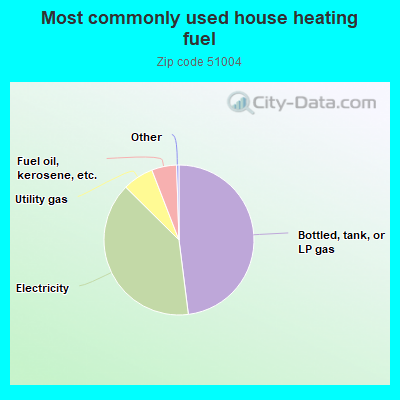
48.2%Bottled, tank, or LP gas
39.6%Electricity
6.7%Utility gas
5.4%Fuel oil, kerosene, etc.
Population in 1990: 1,550.
Place of birth for U.S.-born residents:
This state: 725
Midwest: 62
South: 49
West: 10
74% of the 51004 zip code residents lived in the same house 5 years ago. Out of people who lived in different houses, 67% lived in this county. Out of people who lived in different counties, 50% lived in Iowa.
92% of the 51004 zip code residents lived in the same house 1 year ago. Out of people who lived in different houses, 55% moved from this county. Out of people who lived in different houses, 12% moved from different state. Out of people who lived in different houses, 31% moved from abroad.
Private vs. public school enrollment:
Students in private schools in grades 1 to 8 (elementary and middle school):
Here:
0.0%
Iowa:
10.6%
Students in private schools in grades 9 to 12 (high school):
Here:
0.0%
Iowa:
7.9%
Students in private undergraduate colleges: 2
Here:
13.0%
Iowa:
23.9%
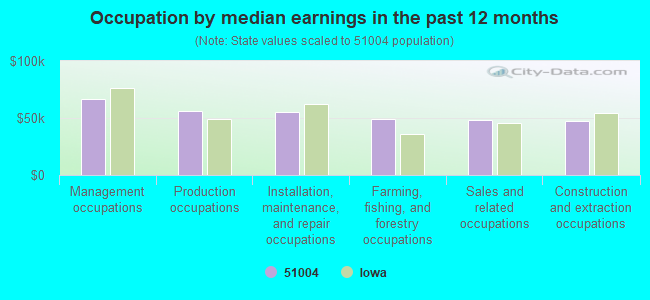
Occupation by median earnings in the past 12 months ($)
66,530Management occupations
56,286Production occupations
55,434Installation, maintenance, and repair occupations
49,253Farming, fishing, and forestry occupations
48,554Sales and related occupations
47,359Construction and extraction occupations
Top industries in this zip code by the number of employees in 2005:
Accommodation and Food Services: Full-Service Restaurants (20-49 employees: 1 establishment)
Finance and Insurance: Commercial Banking (10-19: 1)
Accommodation and Food Services: Drinking Places (Alcoholic Beverages) (10-19: 1)
Wholesale Trade: Grain and Field Bean Merchant Wholesalers (5-9: 1)
Construction: Highway, Street, and Bridge Construction (5-9: 1)
Construction: Poured Concrete Foundation and Structure Contractors (5-9: 1)
Other Services (except Public Administration): General Automotive Repair (1-4: 3)
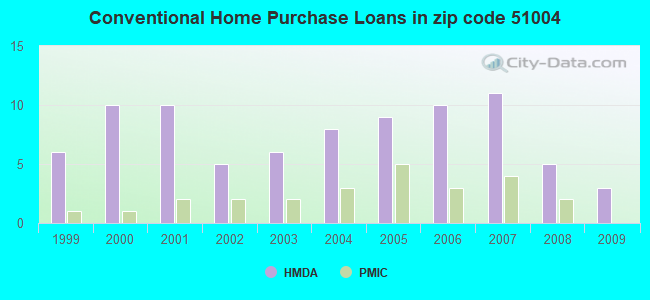
Home Mortgage Disclosure Act Aggregated Statistics For Year 2009 (Based on 2 partial tracts)
A) FHA, FSA/RHS & VA Home Purchase Loans
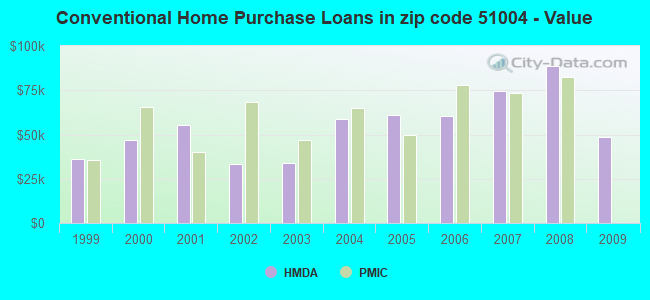
B) Conventional Home Purchase Loans
C) Refinancings
D) Home Improvement Loans
F) Non-occupant Loans on < 5 Family Dwellings (A B C & D)
G) Loans On Manufactured Home Dwelling (A B C & D)
Number
Average Value
Number
Average Value
Number
Average Value
Number
Average Value
Number
Average Value
Number
Average Value
LOANS ORIGINATED
3
$55,753
3
$48,783
15
$111,867
4
$14,318
1
$170,890
2
$53,935
APPLICATIONS APPROVED, NOT ACCEPTED
0
$0
0
$0
1
$44,540
0
$0
0
$0
0
$0
APPLICATIONS DENIED
1
$41,810
1
$64,840
6
$105,090
2
$36,665
1
$2,120
0
$0
APPLICATIONS WITHDRAWN
0
$0
0
$0
5
$89,324
1
$10,610
0
$0
0
$0
FILES CLOSED FOR INCOMPLETENESS
0
$0
0
$0
0
$0
0
$0
0
$0
0
$0
Aggregated Statistics For Year 2008 (Based on 2 partial tracts)
A) FHA, FSA/RHS & VA Home Purchase Loans
B) Conventional Home Purchase Loans
C) Refinancings
D) Home Improvement Loans
F) Non-occupant Loans on < 5 Family Dwellings (A B C & D)
G) Loans On Manufactured Home Dwelling (A B C & D)
Number
Average Value
Number
Average Value
Number
Average Value
Number
Average Value
Number
Average Value
Number
Average Value
LOANS ORIGINATED
4
$70,750
5
$88,778
14
$91,398
4
$26,588
3
$133,823
1
$56,960
APPLICATIONS APPROVED, NOT ACCEPTED
1
$39,090
0
$0
1
$129,080
0
$0
0
$0
0
$0
APPLICATIONS DENIED
1
$60,300
2
$46,815
9
$99,486
2
$44,240
0
$0
1
$214,520
APPLICATIONS WITHDRAWN
0
$0
1
$35,150
3
$89,083
1
$19,700
0
$0
0
$0
FILES CLOSED FOR INCOMPLETENESS
0
$0
0
$0
0
$0
0
$0
0
$0
0
$0
Aggregated Statistics For Year 2007 (Based on 2 partial tracts)
B) Conventional Home Purchase Loans
C) Refinancings
D) Home Improvement Loans
F) Non-occupant Loans on < 5 Family Dwellings (A B C & D)
G) Loans On Manufactured Home Dwelling (A B C & D)
Number
Average Value
Number
Average Value
Number
Average Value
Number
Average Value
Number
Average Value
LOANS ORIGINATED
11
$74,593
18
$65,902
3
$26,663
2
$68,175
1
$32,720
APPLICATIONS APPROVED, NOT ACCEPTED
0
$0
2
$41,510
2
$35,300
0
$0
0
$0
APPLICATIONS DENIED
3
$44,743
7
$83,454
4
$40,830
0
$0
1
$49,090
APPLICATIONS WITHDRAWN
1
$47,570
5
$79,628
1
$34,840
0
$0
0
$0
FILES CLOSED FOR INCOMPLETENESS
0
$0
0
$0
0
$0
0
$0
0
$0
Aggregated Statistics For Year 2006 (Based on 2 partial tracts)
A) FHA, FSA/RHS & VA Home Purchase Loans
B) Conventional Home Purchase Loans
C) Refinancings
D) Home Improvement Loans
F) Non-occupant Loans on < 5 Family Dwellings (A B C & D)
G) Loans On Manufactured Home Dwelling (A B C & D)
Number
Average Value
Number
Average Value
Number
Average Value
Number
Average Value
Number
Average Value
Number
Average Value
LOANS ORIGINATED
1
$40,910
10
$60,539
15
$66,499
4
$17,422
4
$26,740
1
$81,510
APPLICATIONS APPROVED, NOT ACCEPTED
0
$0
1
$94,540
3
$88,880
1
$8,790
0
$0
0
$0
APPLICATIONS DENIED
0
$0
4
$55,752
13
$84,700
6
$26,867
1
$25,450
1
$24,850
APPLICATIONS WITHDRAWN
0
$0
1
$46,060
6
$81,860
1
$47,270
0
$0
0
$0
FILES CLOSED FOR INCOMPLETENESS
0
$0
1
$36,360
1
$106,050
0
$0
0
$0
0
$0
Aggregated Statistics For Year 2005 (Based on 2 partial tracts)
A) FHA, FSA/RHS & VA Home Purchase Loans
B) Conventional Home Purchase Loans
C) Refinancings
D) Home Improvement Loans
F) Non-occupant Loans on < 5 Family Dwellings (A B C & D)
G) Loans On Manufactured Home Dwelling (A B C & D)
Number
Average Value
Number
Average Value
Number
Average Value
Number
Average Value
Number
Average Value
Number
Average Value
LOANS ORIGINATED
0
$0
9
$61,038
18
$65,599
4
$18,710
4
$33,935
1
$29,690
APPLICATIONS APPROVED, NOT ACCEPTED
0
$0
0
$0
4
$64,993
1
$11,510
0
$0
0
$0
APPLICATIONS DENIED
1
$20,600
4
$57,342
12
$60,701
3
$20,100
0
$0
0
$0
APPLICATIONS WITHDRAWN
0
$0
1
$48,180
4
$67,115
1
$28,180
0
$0
0
$0
FILES CLOSED FOR INCOMPLETENESS
0
$0
0
$0
4
$67,872
0
$0
0
$0
0
$0
Aggregated Statistics For Year 2004 (Based on 2 partial tracts)
A) FHA, FSA/RHS & VA Home Purchase Loans
B) Conventional Home Purchase Loans
C) Refinancings
D) Home Improvement Loans
F) Non-occupant Loans on < 5 Family Dwellings (A B C & D)
G) Loans On Manufactured Home Dwelling (A B C & D)
Number
Average Value
Number
Average Value
Number
Average Value
Number
Average Value
Number
Average Value
Number
Average Value
LOANS ORIGINATED
1
$46,060
8
$58,706
19
$73,900
4
$13,105
2
$44,995
1
$24,240
APPLICATIONS APPROVED, NOT ACCEPTED
0
$0
0
$0
3
$80,293
0
$0
0
$0
0
$0
APPLICATIONS DENIED
0
$0
3
$36,460
11
$65,090
4
$18,862
1
$36,970
2
$28,180
APPLICATIONS WITHDRAWN
0
$0
1
$64,540
3
$66,257
1
$51,510
0
$0
0
$0
FILES CLOSED FOR INCOMPLETENESS
0
$0
0
$0
2
$102,715
0
$0
0
$0
0
$0
Aggregated Statistics For Year 2003 (Based on 2 partial tracts)
A) FHA, FSA/RHS & VA Home Purchase Loans
B) Conventional Home Purchase Loans
C) Refinancings
D) Home Improvement Loans
F) Non-occupant Loans on < 5 Family Dwellings (A B C & D)
Number
Average Value
Number
Average Value
Number
Average Value
Number
Average Value
Number
Average Value
LOANS ORIGINATED
1
$33,330
6
$33,885
23
$59,322
4
$17,878
2
$38,635
APPLICATIONS APPROVED, NOT ACCEPTED
0
$0
1
$58,480
3
$53,630
1
$14,850
0
$0
APPLICATIONS DENIED
0
$0
2
$37,420
11
$68,285
1
$28,180
2
$55,450
APPLICATIONS WITHDRAWN
0
$0
0
$0
6
$79,688
0
$0
0
$0
FILES CLOSED FOR INCOMPLETENESS
0
$0
0
$0
1
$101,810
0
$0
0
$0
Aggregated Statistics For Year 2002 (Based on 2 partial tracts)
B) Conventional Home Purchase Loans
C) Refinancings
D) Home Improvement Loans
F) Non-occupant Loans on < 5 Family Dwellings (A B C & D)
Number
Average Value
Number
Average Value
Number
Average Value
Number
Average Value
LOANS ORIGINATED
5
$33,208
25
$58,067
5
$10,180
2
$23,180
APPLICATIONS APPROVED, NOT ACCEPTED
0
$0
5
$80,114
1
$6,670
0
$0
APPLICATIONS DENIED
1
$36,060
9
$57,806
2
$11,360
1
$73,020
APPLICATIONS WITHDRAWN
0
$0
8
$53,290
0
$0
0
$0
FILES CLOSED FOR INCOMPLETENESS
0
$0
2
$65,905
0
$0
0
$0
Aggregated Statistics For Year 2001 (Based on 2 partial tracts)
A) FHA, FSA/RHS & VA Home Purchase Loans
B) Conventional Home Purchase Loans
C) Refinancings
D) Home Improvement Loans
F) Non-occupant Loans on < 5 Family Dwellings (A B C & D)
Number
Average Value
Number
Average Value
Number
Average Value
Number
Average Value
Number
Average Value
LOANS ORIGINATED
1
$75,750
10
$55,328
31
$50,503
5
$16,180
3
$40,300
APPLICATIONS APPROVED, NOT ACCEPTED
0
$0
0
$0
3
$46,460
0
$0
0
$0
APPLICATIONS DENIED
0
$0
2
$39,390
12
$42,218
1
$22,420
0
$0
APPLICATIONS WITHDRAWN
0
$0
1
$46,060
7
$51,077
0
$0
0
$0
FILES CLOSED FOR INCOMPLETENESS
0
$0
0
$0
1
$74,230
0
$0
0
$0
Aggregated Statistics For Year 2000 (Based on 2 partial tracts)
A) FHA, FSA/RHS & VA Home Purchase Loans
B) Conventional Home Purchase Loans
C) Refinancings
D) Home Improvement Loans
F) Non-occupant Loans on < 5 Family Dwellings (A B C & D)
Number
Average Value
Number
Average Value
Number
Average Value
Number
Average Value
Number
Average Value
LOANS ORIGINATED
2
$47,115
10
$47,026
15
$39,693
5
$13,756
3
$30,503
APPLICATIONS APPROVED, NOT ACCEPTED
0
$0
1
$57,270
2
$60,450
1
$44,840
0
$0
APPLICATIONS DENIED
0
$0
5
$35,754
7
$58,393
2
$39,085
1
$33,330
APPLICATIONS WITHDRAWN
0
$0
1
$86,360
5
$51,570
1
$12,120
1
$25,450
FILES CLOSED FOR INCOMPLETENESS
0
$0
0
$0
1
$81,200
0
$0
0
$0
Aggregated Statistics For Year 1999 (Based on 1 partial tract)
B) Conventional Home Purchase Loans
C) Refinancings
D) Home Improvement Loans
F) Non-occupant Loans on < 5 Family Dwellings (A B C & D)


+$726
-$74
(% of AGI for various income ranges: -9.7% for AGIs below $10k, -0.4% for AGIs $10k-25k, -1.7% for AGIs $25k-50k, 0.5% for AGIs $50k-75k, 6.7% for AGIs $75k-100k) Nearest zip codes: 51044, 51056, 51016, 51039, 51051, 51048.