Estimated zip code population in 2022: 983 Zip code population in 2010: 904 Zip code population in 2000: 921
Houses and condos: 425 Renter-occupied apartments: 106
% of renters here:
27%
State:
28%
March 2022 cost of living index in zip code 51436: 83.5 (less than average, U.S. average is 100)
Land area: 60.5 sq. mi. Water area: 0.0 sq. mi.
Population density: 16 people per square mile
(very low).
OSM Map
General Map
Google Map
MSN Map
OSM Map
General Map
Google Map
MSN Map
OSM Map
General Map
Google Map
MSN Map
OSM Map
General Map
Google Map
MSN Map
Please wait while loading the map...
Real estate property taxes paid for housing units in 2022:
This zip code:
0.7% ($1,386)
Iowa:
1.4% ($2,724)
Median real estate property taxes paid for housing units with mortgages in 2022: $1,310 (0.5%) Median real estate property taxes paid for housing units with no mortgage in 2022: $1,577 (0.9%)
Business Search- 14 Million verified businesses
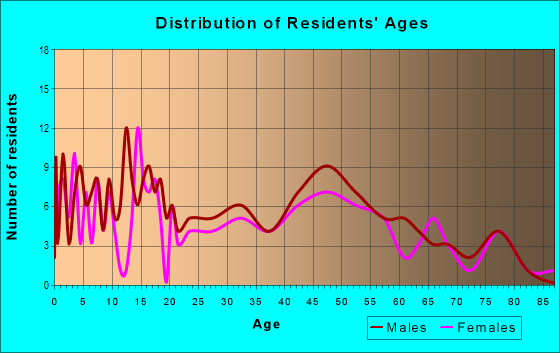
Males: 613
(62.3%)
Females: 370
(37.7%)
For population 25 years and over in 51436:
High school or higher: 96.3%
Bachelor's degree or higher: 24.6%
Graduate or professional degree: 4.2%
Unemployed: 1.8%
Mean travel time to work (commute): 14.1 minutes
For population 15 years and over in 51436:
Never married: 24.2%
Now married: 67.8%
Separated: 0.0%
Widowed: 3.8%
Divorced: 4.3%
Zip code 51436 compared to state average:
Black race population percentage significantly below state average.
Hispanic race population percentage significantly below state average.
Median age significantly below state average.
Foreign-born population percentage significantly below state average.
Length of stay since moving in significantly above state average.
House age above state average.
Number of college students significantly below state average.
Estimated median house/condo value in 2022: $208,959
51436:
$208,959
Iowa:
$194,600
Median resident age:
This zip code:
30.3 years
Iowa median age:
38.9 years
Average household size:
This zip code:
2.5 people
Iowa:
2.3 people
Averages for the 2020 tax year for zip code 51436, filed in 2021:
Average Adjusted Gross Income (AGI) in 2020: $82,436 (Individual Income Tax Returns)
Here:
$82,436
State:
$71,087
Salary/wage: $53,779 (reported on 83.0% of returns)
Here:
$53,779
State:
$57,361
(% of AGI for various income ranges: 1732.5% for AGIs below $25k, 3983.8% for AGIs $25k-50k, 6202.0% for AGIs $50k-75k, 9365.0% for AGIs $75k-100k, 16080.0% for AGIs $100k-200k)
Taxable interest for individuals: $1,581 (reported on 44.7% of returns)
This zip code:
$1,581
Iowa:
$1,633
(% of AGI for various income ranges: 8.8% for AGIs below $25k, 35.0% for AGIs $25k-50k, 94.0% for AGIs $50k-75k, 77.5% for AGIs $75k-100k, 152.5% for AGIs $100k-200k)
Ordinary dividends: $1,961 (reported on 38.3% of returns)
Here:
$1,961
State:
$5,432
(% of AGI for various income ranges: 18.8% for AGIs below $25k, 32.5% for AGIs $25k-50k, 56.0% for AGIs $50k-75k, 115.0% for AGIs $75k-100k, 465.0% for AGIs $100k-200k)
Net capital gain/loss in AGI: +$8,645 (reported on 23.4% of returns)
Here:
+$8,645
State:
+$15,243
(% of AGI for various income ranges: 55.0% for AGIs below $25k, 402.0% for AGIs $50k-75k, 1765.0% for AGIs $100k-200k)
Profit/loss from business: +$14,033 (reported on 19.1% of returns)
Here:
+$14,033
State:
+$11,763
(% of AGI for various income ranges: 267.5% for AGIs $25k-50k, 808.0% for AGIs $50k-75k, 1612.5% for AGIs $100k-200k)
Taxable individual retirement arrangement distribution: $7,567 (reported on 6.4% of returns)
51436:
$7,567
Iowa:
$17,324
(% of AGI for various income ranges: 454.0% for AGIs $50k-75k)
Total itemized deductions: $36,500 (reported on 4.3% of returns)
Here:
$36,500
State:
$33,775
(% of AGI for various income ranges: 912.5% for AGIs $25k-50k)
Taxes paid: $6,850 (reported on 4.3% of returns)
51436:
$6,850
State:
$7,704
(% of AGI for various income ranges: 171.2% for AGIs $25k-50k)
Earned income credit: $1,950 (reported on 8.5% of returns)
Here:
$1,950
State:
$2,195
(% of AGI for various income ranges: 32.5% for AGIs below $25k, 65.0% for AGIs $25k-50k)
Percentage of individuals using paid preparers for their 2020 taxes: 97.9%
Here:
98%
State:
95%
(% for various income ranges: 91.7% for AGIs below $25k, 100.0% for AGIs $25k-50k, 100.0% for AGIs $50k-75k, 100.0% for AGIs $75k-100k, 100.0% for AGIs $100k-200k, 100.0% for AGIs over 200k)
Averages for the 2012 tax year for zip code 51436, filed in 2013:
Average Adjusted Gross Income (AGI) in 2012: $63,744 (Individual Income Tax Returns)
Here:
$63,744
State:
$58,860
Salary/wage: $43,030 (reported on 82.2% of returns)
Here:
$43,030
State:
$46,659
(% of AGI for various income ranges: 82.0% for AGIs below $25k, 80.2% for AGIs $25k-50k, 70.8% for AGIs $50k-75k, 66.4% for AGIs $75k-100k, 35.6% for AGIs $100k-200k)
Taxable interest for individuals: $1,067 (reported on 46.7% of returns)
This zip code:
$1,067
Iowa:
$1,537
(% of AGI for various income ranges: 1.1% for AGIs below $25k, 1.1% for AGIs $25k-50k, 1.0% for AGIs $50k-75k, 0.3% for AGIs $75k-100k, 0.7% for AGIs $100k-200k)
Ordinary dividends: $1,878 (reported on 40.0% of returns)
Here:
$1,878
State:
$4,542
(% of AGI for various income ranges: 1.1% for AGIs below $25k, 0.7% for AGIs $25k-50k, 1.5% for AGIs $50k-75k, 0.5% for AGIs $75k-100k, 1.4% for AGIs $100k-200k)
Net capital gain/loss in AGI: +$3,357 (reported on 15.6% of returns)
Here:
+$3,357
State:
+$11,802
(% of AGI for various income ranges: 3.8% for AGIs below $25k, 1.2% for AGIs $50k-75k, 0.7% for AGIs $100k-200k)
Profit/loss from business: +$8,700 (reported on 15.6% of returns)
Here:
+$8,700
State:
+$10,509
(% of AGI for various income ranges: 11.7% for AGIs below $25k, 2.9% for AGIs $50k-75k, 5.6% for AGIs $75k-100k)
Taxable individual retirement arrangement distribution: $4,240 (reported on 11.1% of returns)
51436:
$4,240
Iowa:
$11,773
Total itemized deductions: $19,791 (14% of AGI, reported on 24.4% of returns)
Here:
$19,791
State:
$21,278
Here:
14.3% of AGI
State:
18.9% of AGI
(% of AGI for various income ranges: 21.7% for AGIs below $25k, 11.6% for AGIs $50k-75k, 8.4% for AGIs $100k-200k)
Charity contributions: $4,000 (reported on 20.0% of returns)
Here:
$4,000
State:
$4,044
Taxes paid: $8,427 (reported on 24.4% of returns)
51436:
$8,427
State:
$8,846
(% of AGI for various income ranges: 3.7% for AGIs below $25k, 3.3% for AGIs $50k-75k, 5.0% for AGIs $100k-200k)
Earned income credit: $1,960 (reported on 11.1% of returns)
Here:
$1,960
State:
$2,098
(% of AGI for various income ranges: 5.7% for AGIs below $25k)
Percentage of individuals using paid preparers for their 2012 taxes: 84.4%
Here:
84%
State:
65%
(% for various income ranges: 78.6% for AGIs below $25k, 80.0% for AGIs $25k-50k, 90.0% for AGIs $50k-75k, 100.0% for AGIs $75k-100k, 83.3% for AGIs $100k-200k)
Averages for the 2004 tax year for zip code 51436, filed in 2005:
Average Adjusted Gross Income (AGI) in 2004: $38,175 (Individual Income Tax Returns)
Here:
$38,175
State:
$43,875
Salary/wage: $29,438 (reported on 82.9% of returns)
Here:
$29,438
State:
$38,265
(% of AGI for various income ranges: 113.9% for AGIs below $10k, 67.2% for AGIs $10k-25k, 76.3% for AGIs $25k-50k, 72.0% for AGIs $50k-75k, 72.5% for AGIs $75k-100k, 34.1% for AGIs over 100k)
Taxable interest for individuals: $1,963 (reported on 63.5% of returns)
This zip code:
$1,963
Iowa:
$1,768
(% of AGI for various income ranges: 7.6% for AGIs below $10k, 4.0% for AGIs $10k-25k, 2.1% for AGIs $25k-50k, 1.8% for AGIs $50k-75k, 0.6% for AGIs $75k-100k, 6.2% for AGIs over 100k)
Taxable dividends: $974 (reported on 42.3% of returns)
Here:
$974
State:
$2,510
(% of AGI for various income ranges: 1.6% for AGIs below $10k, 3.4% for AGIs $10k-25k, 0.8% for AGIs $25k-50k, 0.6% for AGIs $50k-75k, 0.5% for AGIs $75k-100k, 1.1% for AGIs over 100k)
Net capital gain/loss: +$2,202 (reported on 21.4% of returns)
Here:
+$2,202
State:
+$6,139
(% of AGI for various income ranges: 0.8% for AGIs $10k-25k, 0.9% for AGIs $25k-50k, 0.8% for AGIs $50k-75k, 0.5% for AGIs $75k-100k, 2.6% for AGIs over 100k)
Profit/loss from business: +$4,385 (reported on 14.0% of returns)
Here:
+$4,385
State:
+$8,574
Profit/loss from farming: +$1,675 (reported on 17.3% of returns)
Here:
+$1,675
State:
-$74
(% of AGI for various income ranges: -5.6% for AGIs $10k-25k, 5.0% for AGIs $25k-50k, 2.1% for AGIs $50k-75k, -3.6% for AGIs $75k-100k)
IRA payment deduction: $3,423 (reported on 5.6% of returns)
51436:
$3,423
Iowa:
$2,970
Total itemized deductions: $15,574 (22% of AGI, reported on 20.3% of returns)
Here:
$15,574
State:
$16,976
Here:
21.9% of AGI
State:
20.8% of AGI
(% of AGI for various income ranges: 16.5% for AGIs $10k-25k, 7.2% for AGIs $25k-50k, 6.5% for AGIs $50k-75k, 8.3% for AGIs $75k-100k, 8.4% for AGIs over 100k)
Charity contributions deductions: $1,811 (3% of AGI, reported on 19.4% of returns)
Here:
$1,811
State:
$3,089
Here:
2.5% of AGI
State:
3.6% of AGI
(% of AGI for various income ranges: 1.8% for AGIs $10k-25k, 0.6% for AGIs $25k-50k, 0.2% for AGIs $50k-75k, 0.6% for AGIs $75k-100k, 1.7% for AGIs over 100k)
Total tax: $5,491 (reported on 72.6% of returns)
51436:
$5,491
State:
$6,177
(% of AGI for various income ranges: 2.8% for AGIs below $10k, 4.3% for AGIs $10k-25k, 6.3% for AGIs $25k-50k, 6.9% for AGIs $50k-75k, 11.0% for AGIs $75k-100k, 20.4% for AGIs over 100k)
Earned income credit: $1,535 (reported on 9.3% of returns)
Here:
$1,535
State:
$1,540
Percentage of individuals using paid preparers for their 2004 taxes: 84.2%
Here:
84%
State:
70%
(% for various income ranges: 79.1% for AGIs below $10k, 85.3% for AGIs $10k-25k, 82.2% for AGIs $25k-50k, 93.2% for AGIs $50k-75k, 88.9% for AGIs $75k-100k, 88.0% for AGIs over 100k)
Household received Food Stamps/SNAP in the past 12 months: 1 Household did not receive Food Stamps/SNAP in the past 12 months: 400
Women who had a birth in the past 12 months: 5 (5 now married, 0 unmarried) Women who did not have a birth in the past 12 months: 207 (163 now married, 43 unmarried)
Housing units in zip code 51436 with a mortgage: 177 (3 second mortgage) Median monthly owner costs for units with a mortgage: $1,317 Median monthly owner costs for units without a mortgage: $627
Residents with income below the poverty level in 2022:
This zip code:
1.7%
Whole state:
11.0%
Residents with income below 50% of the poverty level in 2022:
This zip code:
0.2%
Whole state:
5.5%
Median number of rooms in houses and condos:
Here:
7.5
State:
6.8
Median number of rooms in apartments:
Here:
5.6
State:
4.2
Notable locations in this zip code not listed on our city pages
Notable locations in zip code 51436: Breda Feed and Grain Incorporated Elevator (A), Breda Golf Club (B), Carroll County Ambulance Service Breda (C), Breda Fire Hall (D), Breda City Hall (E). Display/hide their locations on the map
Size of family households: 120 2-persons, 39 3-persons, 47 4-persons, 33 5-persons, 16 6-persons
Size of nonfamily households: 114 1-person, 26 2-persons
301 married couples with children.
13 single-parent households (7 men, 6 women).
99.4% of residents of 51436 zip code speak English at home.
Foreign born population: 0 (0.0%)
:
0.0%
Whole state:
6.0%
82%German
6%American
3%English
1%Danish
1%Dutch
1%Scandinavian
0%Irish
Facilities with environmental interests located in this zip code:
CHRIST THE KING SCHOOL (304 NORTH 2ND STREET in BREDA, IA)
(Integrated Compliance Information System) - ICIS-07-1987-0130, FORMAL ENFORCEMENT ACTION COMPLIANCE ACTIVITY (Tracking inspections of insecticide, fungicide, and rodenticide, and toxic substances) Alternative names: CHRIST THE KING SCH ST BERNARD
MOORHOUSE READY MIX INC (11975 HAWTHORNE AVE in BREDA, IA)
AIR MINOR (AIRS/AFS) Business SIC classification: READY-MIXED CONCRETE Alternative names: MOORHOUSE READY MIX INC - BREDA
BREDA CITY OF STP (108 NORTH 2ND STREET in BREDA, IA)
National Pollutant Discharge Elimination System NON-MAJOR (Tracking pollutant discharge elimination systems) - permit Business SIC classification: SEWERAGE SYSTEMS
UAP DISTRIBUTION, INC. (HAZEL BUSH RD in BREDA, IA)
COMPLIANCE ACTIVITY (Tracking inspections of insecticide, fungicide, and rodenticide, and toxic substances) (Resource Conservation and Recovery Act (tracking hazardous waste)) Business NAICS classification: FERTILIZER (MIXING ONLY) MANUFACTURING. Alternative names: BREDA FERTILIZER CO
BREDA ELECTRIC DEPT (108 N 2ND ST in BREDA, IA)
COMPLIANCE ACTIVITY (Tracking inspections of insecticide, fungicide, and rodenticide, and toxic substances)
TOYNE INC (104 GRANITE AVE in BREDA, IA)
Conditionally Exempt Small Quantity Generators, less than 100 kg/month of hazardous waste (Resource Conservation and Recovery Act (tracking hazardous waste)) Business NAICS classification: MOTOR VEHICLE BODY MANUFACTURING.; GENERAL AUTOMOTIVE REPAIR.
57.2%Bottled, tank, or LP gas
19.2%Electricity
12.7%Fuel oil, kerosene, etc.
9.6%Utility gas
1.8%Wood
Population in 1990: 773. Population change in the 1990s: +148 (+19.1%).
Place of birth for U.S.-born residents:
This state: 959
Midwest: 12
South: 2
West: 10
77% of the 51436 zip code residents lived in the same house 5 years ago. Out of people who lived in different houses, 68% lived in this county. Out of people who lived in different counties, 50% lived in Iowa.
97% of the 51436 zip code residents lived in the same house 1 year ago. Out of people who lived in different houses, 65% moved from this county. Out of people who lived in different houses, 40% moved from different county within same state.
Private vs. public school enrollment:
Students in private schools in grades 1 to 8 (elementary and middle school): 55
Here:
34.4%
Iowa:
10.6%
Students in private schools in grades 9 to 12 (high school): 51
Here:
53.2%
Iowa:
7.9%
Students in private undergraduate colleges: 1
Here:
11.2%
Iowa:
23.9%
Occupation by median earnings in the past 12 months ($)
80,486Transportation occupations
54,145Installation, maintenance, and repair occupations
50,697Construction and extraction occupations
47,628Health diagnosing and treating practitioners and other technical occupations
45,604Production occupations
42,510Business and financial operations occupations
Companies with federal contracts located in this zip code:
COMPUTER TRANSPORTATION SERVIC (107 W MAIN ST in BREDA, IA; small business)
$6,805 with Defense Information Systems Agency for Other Transportation Travel and Relocation Services. Taking place in UT. Signed on 2006-01-18. Completion date: 2006-01-31.
Top industries in this zip code by the number of employees in 2005:
Finance and Insurance: Insurance Agencies and Brokerages (10-19: 1, 1-4: 1)
Professional, Scientific, and Technical Services: Veterinary Services (10-19: 1)
Other Services (except Public Administration): Religious Organizations (5-9: 1, 1-4: 1)
Finance and Insurance: Commercial Banking (5-9: 1)
Fatal accident statistics in 2014:
Fatal accident count: 1
Vehicles involved in fatal accidents: 2
Fatal accidents caused by drunken drivers: 2
Fatalities: 2
Persons involved in fatal accidents: 6
Pedestrians involved in fatal accidents: 0
Fatal accident statistics in 2011:
Fatal accident count: 1
Vehicles involved in fatal accidents: 2
Fatal accidents caused by drunken drivers: 0
Fatalities: 1
Persons involved in fatal accidents: 4
Pedestrians involved in fatal accidents: 0
2002 - 2018 National Fire Incident Reporting System (NFIRS) incidents
Based on the data from the years 2002 - 2018 the average number of fire incidents per year is 9. The highest number of fire incidents - 19 took place in 2005, and the least - 0 in 2009. The data has a constant trend.
When looking into fire subcategories, the most incidents belonged to: Outside Fires (51.4%), and Structure Fires (30.4%).
Fire incident types reported to NFIRS in Zip Code 51436


+$1,675
-$74
(% of AGI for various income ranges: -5.6% for AGIs $10k-25k, 5.0% for AGIs $25k-50k, 2.1% for AGIs $50k-75k, -3.6% for AGIs $75k-100k) Nearest zip codes: 51430, 51466, 51450, 51467, 51433, 51444.
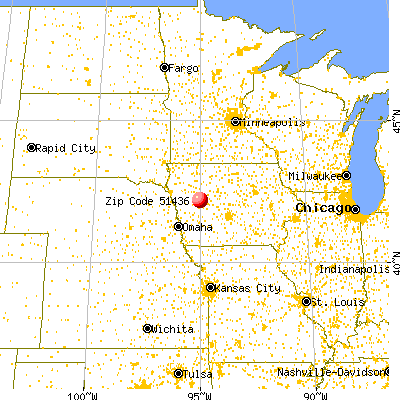


 Based on the data from the years 2002 - 2018 the average number of fire incidents per year is 9. The highest number of fire incidents - 19 took place in 2005, and the least - 0 in 2009. The data has a constant trend.
 When looking into fire subcategories, the most incidents belonged to: Outside Fires (51.4%), and Structure Fires (30.4%).