Estimated zip code population in 2022: 3,793 Zip code population in 2010: 3,785 Zip code population in 2000: 3,248
Houses and condos: 1,466 Renter-occupied apartments: 266
% of renters here:
19%
State:
28%
March 2022 cost of living index in zip code 51510: 89.2 (less than average, U.S. average is 100)
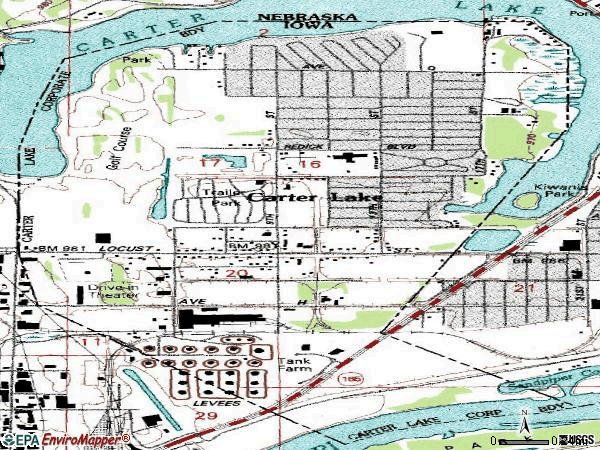
Land area: 1.9 sq. mi. Water area: 0.1 sq. mi.
Population density: 2,029 people per square mile
(low).
OSM Map
General Map
Google Map
MSN Map
OSM Map
General Map
Google Map
MSN Map
OSM Map
General Map
Google Map
MSN Map
OSM Map
General Map
Google Map
MSN Map
Please wait while loading the map...
Real estate property taxes paid for housing units in 2022:
This zip code:
1.7% ($2,538)
Iowa:
1.4% ($2,724)
Median real estate property taxes paid for housing units with mortgages in 2022: $3,080 (1.7%) Median real estate property taxes paid for housing units with no mortgage in 2022: $1,644 (1.5%)
Business Search- 14 Million verified businesses
Males: 2,065
(54.4%)
Females: 1,728
(45.6%)
For population 25 years and over in 51510:
High school or higher: 89.0%
Bachelor's degree or higher: 13.8%
Graduate or professional degree: 4.8%
Unemployed: 4.5%
Mean travel time to work (commute): 20.0 minutes
For population 15 years and over in 51510:
Never married: 33.9%
Now married: 46.5%
Separated: 2.6%
Widowed: 8.1%
Divorced: 8.9%
Zip code 51510 compared to state average:
Black race population percentage significantly below state average.
Hispanic race population percentage above state average.
Length of stay since moving in significantly above state average.
Number of college students below state average.
Percentage of population with a bachelor's degree or higher significantly below state average.
Estimated median house/condo value in 2022: $147,557
51510:
$147,557
Iowa:
$194,600
According to our research of Iowa and other state lists, there was 1 registered sex offender living in 51510 zip code as of May 28, 2024. The ratio of all residents to sex offenders in zip code 51510 is 3,819 to 1. The ratio of registered sex offenders to all residents in this zip code is much lower than the state average.
Median resident age:
This zip code:
38.5 years
Iowa median age:
38.9 years
Average household size:
This zip code:
2.7 people
Iowa:
2.3 people
Averages for the 2020 tax year for zip code 51510, filed in 2021:
Average Adjusted Gross Income (AGI) in 2020: $55,499 (Individual Income Tax Returns)
Here:
$55,499
State:
$71,087
Salary/wage: $48,296 (reported on 84.6% of returns)
Here:
$48,296
State:
$57,361
(% of AGI for various income ranges: 1171.2% for AGIs below $25k, 3550.9% for AGIs $25k-50k, 6145.0% for AGIs $50k-75k, 10515.0% for AGIs $75k-100k, 15690.9% for AGIs $100k-200k)
Taxable interest for individuals: $644 (reported on 23.1% of returns)
This zip code:
$644
Iowa:
$1,633
(% of AGI for various income ranges: 8.1% for AGIs below $25k, 7.6% for AGIs $25k-50k, 15.9% for AGIs $50k-75k, 13.8% for AGIs $75k-100k, 101.8% for AGIs $100k-200k)
Ordinary dividends: $3,310 (reported on 11.8% of returns)
Here:
$3,310
State:
$5,432
(% of AGI for various income ranges: 7.0% for AGIs below $25k, 15.8% for AGIs $25k-50k, 21.8% for AGIs $50k-75k, 466.4% for AGIs $100k-200k)
Net capital gain/loss in AGI: +$8,317 (reported on 10.7% of returns)
Here:
+$8,317
State:
+$15,243
(% of AGI for various income ranges: 5.3% for AGIs below $25k, 6.7% for AGIs $25k-50k, 16.4% for AGIs $50k-75k, 1280.0% for AGIs $100k-200k)
Profit/loss from business: +$9,011 (reported on 11.2% of returns)
Here:
+$9,011
State:
+$11,763
(% of AGI for various income ranges: 81.2% for AGIs below $25k, 102.2% for AGIs $25k-50k, 165.5% for AGIs $50k-75k, 490.0% for AGIs $100k-200k)
Taxable individual retirement arrangement distribution: $14,592 (reported on 7.7% of returns)
51510:
$14,592
Iowa:
$17,324
(% of AGI for various income ranges: 50.5% for AGIs below $25k, 34.4% for AGIs $25k-50k, 247.3% for AGIs $50k-75k, 891.8% for AGIs $100k-200k)
Total itemized deductions: $31,229 (reported on 4.1% of returns)
Here:
$31,229
State:
$33,775
(% of AGI for various income ranges: 361.8% for AGIs $50k-75k, 1263.6% for AGIs $100k-200k)
Charity contributions: $4,540 (reported on 3.0% of returns)
Here:
$4,540
State:
$13,075
(% of AGI for various income ranges: 12.8% for AGIs below $25k, 156.4% for AGIs $100k-200k)
Taxes paid: $8,729 (reported on 4.1% of returns)
51510:
$8,729
State:
$7,704
(% of AGI for various income ranges: 98.6% for AGIs $50k-75k, 358.2% for AGIs $100k-200k)
Earned income credit: $2,538 (reported on 18.9% of returns)
Here:
$2,538
State:
$2,195
(% of AGI for various income ranges: 98.6% for AGIs below $25k, 86.2% for AGIs $25k-50k)
Percentage of individuals using paid preparers for their 2020 taxes: 95.9%
Here:
96%
State:
95%
(% for various income ranges: 94.4% for AGIs below $25k, 96.2% for AGIs $25k-50k, 96.4% for AGIs $50k-75k, 100.0% for AGIs $75k-100k, 94.4% for AGIs $100k-200k, 100.0% for AGIs over 200k)
Averages for the 2012 tax year for zip code 51510, filed in 2013:
Average Adjusted Gross Income (AGI) in 2012: $47,236 (Individual Income Tax Returns)
Here:
$47,236
State:
$58,860
Salary/wage: $40,570 (reported on 86.6% of returns)
Here:
$40,570
State:
$46,659
(% of AGI for various income ranges: 77.6% for AGIs below $25k, 84.2% for AGIs $25k-50k, 74.9% for AGIs $50k-75k, 82.1% for AGIs $75k-100k, 75.3% for AGIs $100k-200k, 52.4% for AGIs over 200k)
Taxable interest for individuals: $598 (reported on 27.4% of returns)
This zip code:
$598
Iowa:
$1,537
(% of AGI for various income ranges: 0.7% for AGIs below $25k, 0.3% for AGIs $25k-50k, 0.2% for AGIs $50k-75k, 0.1% for AGIs $75k-100k, 0.7% for AGIs $100k-200k)
Ordinary dividends: $2,905 (reported on 14.0% of returns)
Here:
$2,905
State:
$4,542
(% of AGI for various income ranges: 0.6% for AGIs below $25k, 0.3% for AGIs $25k-50k, 0.3% for AGIs $50k-75k, 0.8% for AGIs $75k-100k, 3.0% for AGIs $100k-200k)
Net capital gain/loss in AGI: +$4,325 (reported on 10.2% of returns)
Here:
+$4,325
State:
+$11,802
(% of AGI for various income ranges: 0.1% for AGIs $50k-75k, 5.3% for AGIs $100k-200k)
Profit/loss from business: +$7,433 (reported on 11.5% of returns)
Here:
+$7,433
State:
+$10,509
(% of AGI for various income ranges: 6.8% for AGIs below $25k, 1.9% for AGIs $25k-50k, 2.9% for AGIs $50k-75k, 0.7% for AGIs $100k-200k)
Taxable individual retirement arrangement distribution: $10,742 (reported on 7.6% of returns)
51510:
$10,742
Iowa:
$11,773
(% of AGI for various income ranges: 1.8% for AGIs below $25k, 2.0% for AGIs $25k-50k, 3.4% for AGIs $50k-75k, 2.9% for AGIs $100k-200k)
Total itemized deductions: $20,900 (22% of AGI, reported on 26.1% of returns)
Here:
$20,900
State:
$21,278
Here:
21.8% of AGI
State:
18.9% of AGI
(% of AGI for various income ranges: 7.5% for AGIs below $25k, 11.0% for AGIs $25k-50k, 9.2% for AGIs $50k-75k, 11.9% for AGIs $75k-100k, 15.3% for AGIs $100k-200k, 13.0% for AGIs over 200k)
Charity contributions: $2,548 (reported on 19.7% of returns)
Here:
$2,548
State:
$4,044
(% of AGI for various income ranges: 0.6% for AGIs below $25k, 0.6% for AGIs $25k-50k, 0.8% for AGIs $50k-75k, 1.5% for AGIs $75k-100k, 1.8% for AGIs $100k-200k, 1.1% for AGIs over 200k)
Taxes paid: $8,578 (reported on 26.1% of returns)
51510:
$8,578
State:
$8,846
(% of AGI for various income ranges: 1.8% for AGIs below $25k, 2.4% for AGIs $25k-50k, 3.7% for AGIs $50k-75k, 5.2% for AGIs $75k-100k, 7.3% for AGIs $100k-200k, 7.4% for AGIs over 200k)
Earned income credit: $2,322 (reported on 26.1% of returns)
Here:
$2,322
State:
$2,098
(% of AGI for various income ranges: 8.5% for AGIs below $25k, 1.4% for AGIs $25k-50k)
Percentage of individuals using paid preparers for their 2012 taxes: 60.5%
Here:
61%
State:
65%
(% for various income ranges: 53.7% for AGIs below $25k, 58.1% for AGIs $25k-50k, 75.0% for AGIs $50k-75k, 69.2% for AGIs $75k-100k, 72.7% for AGIs $100k-200k, 66.7% for AGIs over 200k)
Averages for the 2004 tax year for zip code 51510, filed in 2005:
Average Adjusted Gross Income (AGI) in 2004: $39,018 (Individual Income Tax Returns)
Here:
$39,018
State:
$43,875
Salary/wage: $36,749 (reported on 88.2% of returns)
Here:
$36,749
State:
$38,265
(% of AGI for various income ranges: 93.2% for AGIs below $10k, 80.8% for AGIs $10k-25k, 84.2% for AGIs $25k-50k, 85.2% for AGIs $50k-75k, 81.7% for AGIs $75k-100k, 80.8% for AGIs over 100k)
Taxable interest for individuals: $979 (reported on 35.2% of returns)
This zip code:
$979
Iowa:
$1,768
(% of AGI for various income ranges: 2.8% for AGIs below $10k, 1.5% for AGIs $10k-25k, 0.7% for AGIs $25k-50k, 1.1% for AGIs $50k-75k, 0.8% for AGIs $75k-100k, 0.4% for AGIs over 100k)
Taxable dividends: $1,096 (reported on 16.4% of returns)
Here:
$1,096
State:
$2,510
(% of AGI for various income ranges: 2.1% for AGIs below $10k, 0.8% for AGIs $10k-25k, 0.3% for AGIs $25k-50k, 0.2% for AGIs $50k-75k, 0.2% for AGIs $75k-100k, 0.7% for AGIs over 100k)
Net capital gain/loss: +$1,626 (reported on 13.0% of returns)
Here:
+$1,626
State:
+$6,139
(% of AGI for various income ranges: -1.3% for AGIs below $10k, -0.3% for AGIs $10k-25k, 0.3% for AGIs $25k-50k, -0.1% for AGIs $50k-75k, 1.3% for AGIs $75k-100k, 1.6% for AGIs over 100k)
Profit/loss from business: +$4,733 (reported on 11.0% of returns)
Here:
+$4,733
State:
+$8,574
(% of AGI for various income ranges: 6.4% for AGIs below $10k, 3.4% for AGIs $10k-25k, 2.0% for AGIs $25k-50k, 1.2% for AGIs $50k-75k, 0.2% for AGIs $75k-100k, -0.3% for AGIs over 100k)
IRA payment deduction: $1,895 (reported on 1.3% of returns)
51510:
$1,895
Iowa:
$2,970
Total itemized deductions: $16,875 (22% of AGI, reported on 27.9% of returns)
Here:
$16,875
State:
$16,976
Here:
22.5% of AGI
State:
20.8% of AGI
(% of AGI for various income ranges: 7.5% for AGIs $10k-25k, 8.9% for AGIs $25k-50k, 13.2% for AGIs $50k-75k, 15.3% for AGIs $75k-100k, 16.3% for AGIs over 100k)
Charity contributions deductions: $1,985 (2% of AGI, reported on 22.4% of returns)
Here:
$1,985
State:
$3,089
Here:
2.5% of AGI
State:
3.6% of AGI
(% of AGI for various income ranges: 0.3% for AGIs $10k-25k, 0.5% for AGIs $25k-50k, 1.1% for AGIs $50k-75k, 1.9% for AGIs $75k-100k, 1.9% for AGIs over 100k)
Total tax: $5,244 (reported on 73.6% of returns)
51510:
$5,244
State:
$6,177
(% of AGI for various income ranges: 2.0% for AGIs below $10k, 3.5% for AGIs $10k-25k, 6.3% for AGIs $25k-50k, 8.6% for AGIs $50k-75k, 10.5% for AGIs $75k-100k, 19.1% for AGIs over 100k)
Earned income credit: $1,729 (reported on 20.0% of returns)
Here:
$1,729
State:
$1,540
Percentage of individuals using paid preparers for their 2004 taxes: 67.6%
Here:
68%
State:
70%
(% for various income ranges: 50.0% for AGIs below $10k, 67.1% for AGIs $10k-25k, 71.5% for AGIs $25k-50k, 75.0% for AGIs $50k-75k, 72.3% for AGIs $75k-100k, 82.9% for AGIs over 100k)
Household received Food Stamps/SNAP in the past 12 months: 174 Household did not receive Food Stamps/SNAP in the past 12 months: 1,213
Women who had a birth in the past 12 months: 29 (30 now married, 0 unmarried) Women who did not have a birth in the past 12 months: 646 (216 now married, 430 unmarried)
Housing units in zip code 51510 with a mortgage: 653 (30 second mortgage, 28 both second mortgage and home equity loan) Houses without a mortgage: 17
Median monthly owner costs for units with a mortgage: $1,314 Median monthly owner costs for units without a mortgage: $559
Residents with income below the poverty level in 2022:
This zip code:
17.7%
Whole state:
11.0%
Residents with income below 50% of the poverty level in 2022:
This zip code:
12.1%
Whole state:
5.5%
Median number of rooms in houses and condos:
Here:
5.6
State:
6.8
Median number of rooms in apartments:
Here:
5.0
State:
4.2
Notable locations in this zip code not listed on our city pages
Size of family households: 445 2-persons, 318 3-persons, 102 4-persons, 28 5-persons, 50 6-persons, 50 7-or-more-persons
Size of nonfamily households: 374 1-person, 11 2-persons, 10 3-persons
595 married couples with children.
271 single-parent households (135 men, 136 women).
82.8% of residents of 51510 zip code speak English at home.
16.6% of residents speak Spanish at home (29% very well, 34% well, 20% not well, 17% not at all).
0.9% of residents speak other Indo-European language at home (100% very well).
Foreign born population: 332 (8.8%) (70.9% of them are naturalized citizens)
This zip code:
8.8%
Whole state:
6.0%
79%Honduras
6%Sweden
5%France
4%Belarus
26%English
18%German
9%Irish
4%American
3%Polish
3%Scottish
1%Eastern European
Year of entry for the foreign-born population
512010 or later
852000 to 2009
961990 to 1999
103Before 1990
Facilities with environmental interests located in this zip code:
CARTER LAKE ELEMENTARY SCHOOL (1105 REDICK BLVD in CARTER LAKE, IA)
(Geographic Names Information System) (National Center for Education Statistics) - STATE ID-781476 422 Organizations: COUNCIL BLUFFS COMM SCHOOL DISTRICT (SCHOOL DISTRICT)
NATIONAL FREIGHTWAYS INC (801 WOOD AVENUE in CARTER LAKE, IA)
AIR MINOR (AIRS/AFS) - ICIS-07-2005-0413, ENFORCEMENT/COMPLIANCE ACTIVITY Business SIC classification: TRUCKING, EXCEPT LOCAL
CARTER LAKE, CITY OF MS4 (950 LOCUST ST in CARTER LAKE, IA)
COMPLIANCE ACTIVITY (Tracking inspections of insecticide, fungicide, and rodenticide, and toxic substances) National Pollutant Discharge Elimination System NON-MAJOR (Tracking pollutant discharge elimination systems) - permit (Resource Conservation and Recovery Act (tracking hazardous waste)) Business SIC classification: ELECTRIC SERVICES; SEWERAGE SYSTEMS Business NAICS classification: GENERAL AUTOMOTIVE REPAIR.
CHARLES H LINDHORST (108 SHORLINE DR in CARTER LAKE, IA)
(Integrated Compliance Information System) - ICIS-07-2001-0090, FORMAL ENFORCEMENT ACTION
PAXTON & VIERLING STEEL COMPANY (5TH & AVENUE H in CARTER LAKE, IA)
AIR SYNTHETIC MINOR (AIRS/AFS) CRITERIA AND HAZARDOUS AIR POLLUTANT INVENTORY (Inventory of air pollution sources) TRI REPORTER (Tracking of toxic chemicals releasing facilities) Business SIC classification: FABRICATED STRUCTURAL METAL; INDUSTRIAL TRUCKS, TRACTORS, TRAILERS, AND STACKERS; METALS SERVICE CENTERS AND OFFICES Business NAICS classification: FABRICATED STRUCTURAL METAL MANUFACTURING.
PRAXAIR INDUSTRIAL WASTE DISPOSAL SITE-CARTER LAKE (1100 AVE H in CARTER LAKE, IA)
STATE MASTER (Iowa emission factors information) Conditionally Exempt Small Quantity Generators, less than 100 kg/month of hazardous waste (Resource Conservation and Recovery Act (tracking hazardous waste)) Organizations: PRAXAIR CORPORATION (CONTACT/OWNER)
Alternative names: PRAXAIR DISTRIBUTION INC
PAXTON & VIERLING STEEL CO (501 AVE H in CARTER LAKE, IA)
Small Quantity Generators, between 100 kg and 1000 kg of hazardous waste/month (Resource Conservation and Recovery Act (tracking hazardous waste)) Organizations: OWEN INDUSTRIES (CONTACT/OWNER)
PAXTON & VIERLING STEEL CO (5TH AVENUE H in CARTER LAKE, IA)
COMPLIANCE ACTIVITY (Tracking inspections of insecticide, fungicide, and rodenticide, and toxic substances) Business SIC classification: FABRICATED STRUCTURAL METAL
84.1%Utility gas
15.0%Electricity
0.5%No fuel used
Population in 1990: 3,200. Population change in the 1990s: +48 (+1.5%).
Place of birth for U.S.-born residents:
This state: 1,086
Northeast: 25
Midwest: 2,055
South: 172
West: 53
64% of the 51510 zip code residents lived in the same house 5 years ago. Out of people who lived in different houses, 39% lived in this county. Out of people who lived in different counties, 50% lived in Iowa.
96% of the 51510 zip code residents lived in the same house 1 year ago. Out of people who lived in different houses, 69% moved from this county. Out of people who lived in different houses, 10% moved from different county within same state. Out of people who lived in different houses, 27% moved from different state.
Private vs. public school enrollment:
Students in private schools in grades 1 to 8 (elementary and middle school): 11
Here:
2.4%
Iowa:
10.6%
Students in private schools in grades 9 to 12 (high school): 10
Here:
5.6%
Iowa:
7.9%
Students in private undergraduate colleges:
Here:
0.0%
Iowa:
23.9%
Occupation by median earnings in the past 12 months ($)
92,682Management occupations
90,596Computer and mathematical occupations
87,778Architecture and engineering occupations
75,236Sales and related occupations
59,757Business and financial operations occupations
57,068Health technologists and technicians
Companies with federal contracts located in this zip code:
WINGATE INN (1201 AVENUE H in CARTER LAKE, IA) : $150,869 in 5 contractsfrom 2003 to 2005
Contracts for Lodging - Hotel/Motel by Army Signed by year:2000: $0; 2001: $0; 2002: $0; 2003: $9,072; 2004: $133,497; 2005: $8,300; 2006: $0.
Biggest contracts:
$131,040 with Army for Lodging - Hotel/Motel. Signed on 2004-05-19. Completion date: 2004-06-10.
$8,300, same as above.Signed on 2005-09-16. Completion date: 2005-09-25.
$6,048, same as above.Signed on 2003-11-20. Completion date: 2003-12-10.
$3,024, same as above.Signed on 2003-11-25. Completion date: 2003-12-10.
Top industries in this zip code by the number of employees in 2005:
Professional, Scientific, and Technical Services: Direct Mail Advertising (50-99 employees: 1 establishment)
Information: Data Processing, Hosting, and Related Services (50-99: 1)
Wholesale Trade: Fresh Fruit and Vegetable Merchant Wholesalers (50-99: 1)
Accommodation and Food Services: Hotels (except Casino Hotels) and Motels (20-49: 2, 1-4: 1)
Real Estate and Rental and Leasing: All Other Consumer Goods Rental (20-49: 1)
Wholesale Trade: Men's and Boys' Clothing and Furnishings Merchant Wholesalers (20-49: 1)
Home Mortgage Disclosure Act Aggregated Statistics For Year 2009 (Based on 2 full tracts)
A) FHA, FSA/RHS & VA Home Purchase Loans
B) Conventional Home Purchase Loans
C) Refinancings
D) Home Improvement Loans
F) Non-occupant Loans on < 5 Family Dwellings (A B C & D)
G) Loans On Manufactured Home Dwelling (A B C & D)
Number
Average Value
Number
Average Value
Number
Average Value
Number
Average Value
Number
Average Value
Number
Average Value
LOANS ORIGINATED
46
$105,042
33
$65,115
123
$132,571
17
$34,822
31
$70,184
0
$0
APPLICATIONS APPROVED, NOT ACCEPTED
4
$114,840
0
$0
12
$114,679
0
$0
6
$96,100
0
$0
APPLICATIONS DENIED
4
$76,400
4
$167,215
58
$140,704
19
$14,061
4
$59,102
8
$2,642
APPLICATIONS WITHDRAWN
0
$0
4
$27,388
35
$126,413
0
$0
0
$0
0
$0
FILES CLOSED FOR INCOMPLETENESS
0
$0
0
$0
4
$292,145
0
$0
0
$0
0
$0
Aggregated Statistics For Year 2008 (Based on 2 full tracts)
A) FHA, FSA/RHS & VA Home Purchase Loans
B) Conventional Home Purchase Loans
C) Refinancings
D) Home Improvement Loans
F) Non-occupant Loans on < 5 Family Dwellings (A B C & D)
G) Loans On Manufactured Home Dwelling (A B C & D)
Number
Average Value
Number
Average Value
Number
Average Value
Number
Average Value
Number
Average Value
Number
Average Value
LOANS ORIGINATED
27
$104,001
58
$100,209
92
$110,766
13
$24,099
38
$61,909
4
$60,062
APPLICATIONS APPROVED, NOT ACCEPTED
0
$0
2
$165,290
17
$119,051
0
$0
0
$0
0
$0
APPLICATIONS DENIED
4
$75,920
17
$57,999
67
$116,123
37
$26,648
10
$34,019
8
$25,466
APPLICATIONS WITHDRAWN
0
$0
4
$150,878
29
$115,519
2
$182,590
2
$38,440
0
$0
FILES CLOSED FOR INCOMPLETENESS
0
$0
2
$39,400
6
$114,358
2
$19,220
0
$0
0
$0
Aggregated Statistics For Year 2007 (Based on 2 full tracts)
A) FHA, FSA/RHS & VA Home Purchase Loans
B) Conventional Home Purchase Loans
C) Refinancings
D) Home Improvement Loans
F) Non-occupant Loans on < 5 Family Dwellings (A B C & D)
G) Loans On Manufactured Home Dwelling (A B C & D)
Number
Average Value
Number
Average Value
Number
Average Value
Number
Average Value
Number
Average Value
Number
Average Value
LOANS ORIGINATED
10
$96,677
85
$109,011
115
$104,925
38
$24,278
31
$97,340
2
$43,245
APPLICATIONS APPROVED, NOT ACCEPTED
0
$0
6
$61,825
27
$80,226
4
$60,062
4
$44,688
2
$46,130
APPLICATIONS DENIED
4
$143,670
29
$64,221
110
$98,616
48
$32,954
15
$51,381
13
$29,274
APPLICATIONS WITHDRAWN
0
$0
10
$55,546
19
$121,288
8
$41,564
10
$40,939
0
$0
FILES CLOSED FOR INCOMPLETENESS
0
$0
2
$48,050
12
$101,065
4
$45,168
0
$0
0
$0
Aggregated Statistics For Year 2006 (Based on 2 full tracts)
A) FHA, FSA/RHS & VA Home Purchase Loans
B) Conventional Home Purchase Loans
C) Refinancings
D) Home Improvement Loans
F) Non-occupant Loans on < 5 Family Dwellings (A B C & D)
G) Loans On Manufactured Home Dwelling (A B C & D)
Number
Average Value
Number
Average Value
Number
Average Value
Number
Average Value
Number
Average Value
Number
Average Value
LOANS ORIGINATED
15
$114,551
140
$88,906
158
$85,590
46
$25,655
40
$65,348
2
$106,670
APPLICATIONS APPROVED, NOT ACCEPTED
0
$0
13
$64,461
27
$132,120
6
$43,565
2
$199,890
6
$27,548
APPLICATIONS DENIED
0
$0
54
$74,246
94
$97,715
52
$28,904
15
$73,549
19
$31,359
APPLICATIONS WITHDRAWN
0
$0
15
$76,239
50
$89,488
12
$36,518
10
$39,017
0
$0
FILES CLOSED FOR INCOMPLETENESS
0
$0
0
$0
27
$88,270
0
$0
2
$77,840
0
$0
Aggregated Statistics For Year 2005 (Based on 2 full tracts)
A) FHA, FSA/RHS & VA Home Purchase Loans
B) Conventional Home Purchase Loans
C) Refinancings
D) Home Improvement Loans
E) Loans on Dwellings For 5+ Families
F) Non-occupant Loans on < 5 Family Dwellings (A B C & D)
G) Loans On Manufactured Home Dwelling (A B C & D)
Number
Average Value
Number
Average Value
Number
Average Value
Number
Average Value
Number
Average Value
Number
Average Value
Number
Average Value
LOANS ORIGINATED
12
$81,845
92
$104,394
192
$99,233
31
$37,324
2
$499,720
21
$82,005
0
$0
APPLICATIONS APPROVED, NOT ACCEPTED
0
$0
19
$76,172
50
$85,606
4
$25,468
0
$0
4
$77,360
2
$4,805
APPLICATIONS DENIED
0
$0
27
$55,311
146
$110,897
54
$30,076
0
$0
6
$54,137
12
$16,978
APPLICATIONS WITHDRAWN
0
$0
10
$109,170
81
$98,900
6
$38,120
0
$0
8
$58,861
0
$0
FILES CLOSED FOR INCOMPLETENESS
0
$0
8
$105,950
37
$92,879
8
$24,505
0
$0
0
$0
0
$0
Aggregated Statistics For Year 2004 (Based on 2 full tracts)
A) FHA, FSA/RHS & VA Home Purchase Loans
B) Conventional Home Purchase Loans
C) Refinancings
D) Home Improvement Loans
E) Loans on Dwellings For 5+ Families
F) Non-occupant Loans on < 5 Family Dwellings (A B C & D)
G) Loans On Manufactured Home Dwelling (A B C & D)
Number
Average Value
Number
Average Value
Number
Average Value
Number
Average Value
Number
Average Value
Number
Average Value
Number
Average Value
LOANS ORIGINATED
4
$109,072
146
$94,915
175
$94,716
31
$32,054
4
$389,685
21
$64,799
29
$27,041
APPLICATIONS APPROVED, NOT ACCEPTED
2
$66,310
19
$58,571
29
$111,211
0
$0
0
$0
8
$69,432
10
$28,638
APPLICATIONS DENIED
2
$99,945
33
$63,251
154
$80,824
50
$21,719
0
$0
13
$64,018
13
$22,768
APPLICATIONS WITHDRAWN
2
$49,970
13
$56,034
38
$87,249
6
$35,237
0
$0
2
$73,035
0
$0
FILES CLOSED FOR INCOMPLETENESS
0
$0
2
$88,410
56
$90,437
0
$0
0
$0
2
$57,660
0
$0
Aggregated Statistics For Year 2003 (Based on 2 full tracts)
A) FHA, FSA/RHS & VA Home Purchase Loans
B) Conventional Home Purchase Loans
C) Refinancings
D) Home Improvement Loans
E) Loans on Dwellings For 5+ Families
F) Non-occupant Loans on < 5 Family Dwellings (A B C & D)
Number
Average Value
Number
Average Value
Number
Average Value
Number
Average Value
Number
Average Value
Number
Average Value
LOANS ORIGINATED
10
$84,568
111
$94,091
379
$97,358
42
$20,547
2
$660,205
37
$77,763
APPLICATIONS APPROVED, NOT ACCEPTED
2
$110,515
33
$68,435
37
$71,374
4
$14,895
0
$0
6
$63,747
APPLICATIONS DENIED
0
$0
40
$55,642
148
$76,568
29
$11,532
0
$0
8
$55,738
APPLICATIONS WITHDRAWN
0
$0
10
$93,794
69
$101,170
6
$40,682
0
$0
12
$76,560
FILES CLOSED FOR INCOMPLETENESS
4
$91,775
0
$0
12
$88,572
0
$0
0
$0
0
$0
Aggregated Statistics For Year 2002 (Based on 2 full tracts)
A) FHA, FSA/RHS & VA Home Purchase Loans
B) Conventional Home Purchase Loans
C) Refinancings
D) Home Improvement Loans
F) Non-occupant Loans on < 5 Family Dwellings (A B C & D)
Number
Average Value
Number
Average Value
Number
Average Value
Number
Average Value
Number
Average Value
LOANS ORIGINATED
8
$80,004
92
$95,202
252
$91,669
62
$20,243
27
$64,138
APPLICATIONS APPROVED, NOT ACCEPTED
0
$0
12
$45,647
42
$79,717
2
$28,830
2
$61,505
APPLICATIONS DENIED
2
$77,840
25
$25,678
133
$65,464
35
$13,619
10
$57,852
APPLICATIONS WITHDRAWN
4
$75,438
15
$137,871
63
$70,656
4
$12,492
2
$54,775
FILES CLOSED FOR INCOMPLETENESS
0
$0
0
$0
6
$73,037
0
$0
0
$0
Aggregated Statistics For Year 2001 (Based on 2 full tracts)
A) FHA, FSA/RHS & VA Home Purchase Loans
B) Conventional Home Purchase Loans
C) Refinancings
D) Home Improvement Loans
F) Non-occupant Loans on < 5 Family Dwellings (A B C & D)
Number
Average Value
Number
Average Value
Number
Average Value
Number
Average Value
Number
Average Value
LOANS ORIGINATED
10
$72,459
98
$103,984
188
$77,146
25
$22,680
21
$77,520
APPLICATIONS APPROVED, NOT ACCEPTED
0
$0
17
$52,685
40
$52,422
8
$12,974
4
$39,882
APPLICATIONS DENIED
0
$0
31
$37,014
62
$61,721
35
$19,220
4
$51,895
APPLICATIONS WITHDRAWN
0
$0
8
$133,579
46
$63,426
0
$0
0
$0
FILES CLOSED FOR INCOMPLETENESS
0
$0
2
$101,865
4
$67,270
0
$0
0
$0
Aggregated Statistics For Year 2000 (Based on 2 full tracts)
A) FHA, FSA/RHS & VA Home Purchase Loans
B) Conventional Home Purchase Loans
C) Refinancings
D) Home Improvement Loans
F) Non-occupant Loans on < 5 Family Dwellings (A B C & D)
Number
Average Value
Number
Average Value
Number
Average Value
Number
Average Value
Number
Average Value
LOANS ORIGINATED
10
$53,432
79
$62,988
111
$65,660
35
$14,443
21
$69,558
APPLICATIONS APPROVED, NOT ACCEPTED
0
$0
23
$45,543
52
$56,477
12
$15,536
2
$15,375
APPLICATIONS DENIED
2
$61,505
104
$39,882
85
$56,145
54
$10,535
4
$22,102
APPLICATIONS WITHDRAWN
2
$55,740
12
$162,569
37
$55,374
4
$19,220
0
$0
FILES CLOSED FOR INCOMPLETENESS
0
$0
4
$60,062
13
$60,765
0
$0
0
$0
Aggregated Statistics For Year 1999 (Based on 1 partial tract)
A) FHA, FSA/RHS & VA Home Purchase Loans
B) Conventional Home Purchase Loans
C) Refinancings
D) Home Improvement Loans
F) Non-occupant Loans on < 5 Family Dwellings (A B C & D)


 Nearest zip codes: 68110, 68102, 68178, 68111, 68108, 68131.