Estimated zip code population in 2022: 1,499 Zip code population in 2010: 1,783 Zip code population in 2000: 2,033
Houses and condos: 707 Renter-occupied apartments: 138
% of renters here:
23%
State:
28%
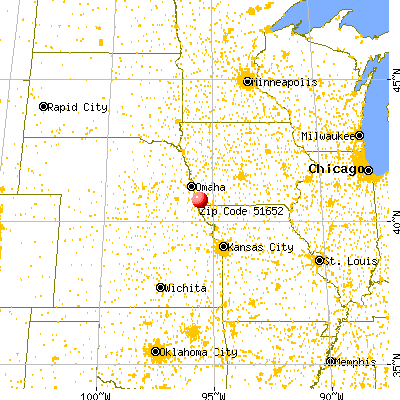
March 2022 cost of living index in zip code 51652: 81.9 (low, U.S. average is 100)
Land area: 76.8 sq. mi. Water area: 0.4 sq. mi.
Population density: 20 people per square mile
(very low).
OSM Map
General Map
Google Map
MSN Map
OSM Map
General Map
Google Map
MSN Map
OSM Map
General Map
Google Map
MSN Map
OSM Map
General Map
Google Map
MSN Map
Please wait while loading the map...
Real estate property taxes paid for housing units in 2022:
This zip code:
1.5% ($2,035)
Iowa:
1.4% ($2,724)
Median real estate property taxes paid for housing units with mortgages in 2022: $1,922 (1.4%) Median real estate property taxes paid for housing units with no mortgage in 2022: $2,184 (1.6%)
Business Search- 14 Million verified businesses
Males: 704
(47.0%)
Females: 794
(53.0%)
For population 25 years and over in 51652:
High school or higher: 93.9%
Bachelor's degree or higher: 23.0%
Graduate or professional degree: 3.9%
Unemployed: 2.2%
Mean travel time to work (commute): 20.4 minutes
For population 15 years and over in 51652:
Never married: 24.5%
Now married: 53.4%
Separated: 0.6%
Widowed: 8.8%
Divorced: 12.8%
Zip code 51652 compared to state average:
Black race population percentage significantly below state average.
Hispanic race population percentage below state average.
Median age above state average.
Foreign-born population percentage significantly below state average.
Length of stay since moving in above state average.
Averages for the 2020 tax year for zip code 51652, filed in 2021:
Average Adjusted Gross Income (AGI) in 2020: $63,510 (Individual Income Tax Returns)
Here:
$63,510
State:
$71,087
Salary/wage: $50,033 (reported on 86.4% of returns)
Here:
$50,033
State:
$57,361
(% of AGI for various income ranges: 1375.0% for AGIs below $25k, 3607.5% for AGIs $25k-50k, 6663.3% for AGIs $50k-75k, 9746.7% for AGIs $75k-100k, 15270.0% for AGIs $100k-200k)
Taxable interest for individuals: $1,008 (reported on 29.6% of returns)
This zip code:
$1,008
Iowa:
$1,633
(% of AGI for various income ranges: 29.4% for AGIs below $25k, 8.8% for AGIs $25k-50k, 55.6% for AGIs $50k-75k, 41.7% for AGIs $75k-100k, 87.5% for AGIs $100k-200k)
Ordinary dividends: $2,454 (reported on 16.0% of returns)
Here:
$2,454
State:
$5,432
(% of AGI for various income ranges: 48.8% for AGIs $25k-50k, 130.0% for AGIs $50k-75k, 155.0% for AGIs $100k-200k)
Net capital gain/loss in AGI: +$8,908 (reported on 14.8% of returns)
Here:
+$8,908
State:
+$15,243
(% of AGI for various income ranges: 35.6% for AGIs $25k-50k, 164.4% for AGIs $50k-75k, 1080.0% for AGIs $100k-200k)
Profit/loss from business: +$8,127 (reported on 13.6% of returns)
Here:
+$8,127
State:
+$11,763
(% of AGI for various income ranges: 214.4% for AGIs below $25k, 66.7% for AGIs $50k-75k, 361.7% for AGIs $75k-100k, 342.5% for AGIs $100k-200k)
Taxable individual retirement arrangement distribution: $17,157 (reported on 8.6% of returns)
51652:
$17,157
Iowa:
$17,324
(% of AGI for various income ranges: 288.8% for AGIs $25k-50k, 1231.7% for AGIs $75k-100k)
Total itemized deductions: $28,533 (reported on 3.7% of returns)
Here:
$28,533
State:
$33,775
(% of AGI for various income ranges: 951.1% for AGIs $50k-75k)
Charity contributions: $4,850 (reported on 2.5% of returns)
Here:
$4,850
State:
$13,075
(% of AGI for various income ranges: 60.6% for AGIs $25k-50k)
Taxes paid: $5,475 (reported on 4.9% of returns)
51652:
$5,475
State:
$7,704
(% of AGI for various income ranges: 365.0% for AGIs $75k-100k)
Earned income credit: $2,455 (reported on 13.6% of returns)
Here:
$2,455
State:
$2,195
(% of AGI for various income ranges: 103.8% for AGIs below $25k, 65.0% for AGIs $25k-50k)
Percentage of individuals using paid preparers for their 2020 taxes: 97.5%
Here:
98%
State:
95%
(% for various income ranges: 95.7% for AGIs below $25k, 95.0% for AGIs $25k-50k, 100.0% for AGIs $50k-75k, 100.0% for AGIs $75k-100k, 100.0% for AGIs $100k-200k, 100.0% for AGIs over 200k)
Averages for the 2012 tax year for zip code 51652, filed in 2013:
Average Adjusted Gross Income (AGI) in 2012: $54,347 (Individual Income Tax Returns)
Here:
$54,347
State:
$58,860
Salary/wage: $40,183 (reported on 82.3% of returns)
Here:
$40,183
State:
$46,659
(% of AGI for various income ranges: 70.4% for AGIs below $25k, 81.1% for AGIs $25k-50k, 72.4% for AGIs $50k-75k, 71.5% for AGIs $75k-100k, 80.3% for AGIs $100k-200k)
Taxable interest for individuals: $1,100 (reported on 34.2% of returns)
This zip code:
$1,100
Iowa:
$1,537
(% of AGI for various income ranges: 1.3% for AGIs below $25k, 0.2% for AGIs $25k-50k, 1.2% for AGIs $50k-75k, 0.7% for AGIs $75k-100k, 0.8% for AGIs $100k-200k, 0.2% for AGIs over 200k)
Ordinary dividends: $2,015 (reported on 16.5% of returns)
Here:
$2,015
State:
$4,542
(% of AGI for various income ranges: 1.8% for AGIs below $25k, 0.4% for AGIs $25k-50k, 0.9% for AGIs $50k-75k, 1.0% for AGIs $100k-200k)
Net capital gain/loss in AGI: +$8,317 (reported on 15.2% of returns)
Here:
+$8,317
State:
+$11,802
(% of AGI for various income ranges: 0.8% for AGIs below $25k, 1.6% for AGIs $50k-75k, 8.9% for AGIs $100k-200k)
Profit/loss from business: +$11,718 (reported on 13.9% of returns)
Here:
+$11,718
State:
+$10,509
(% of AGI for various income ranges: 8.9% for AGIs below $25k, 3.2% for AGIs $50k-75k, 11.3% for AGIs $75k-100k)
Taxable individual retirement arrangement distribution: $7,662 (reported on 10.1% of returns)
51652:
$7,662
Iowa:
$11,773
Total itemized deductions: $17,970 (17% of AGI, reported on 25.3% of returns)
Here:
$17,970
State:
$21,278
Here:
17.1% of AGI
State:
18.9% of AGI
(% of AGI for various income ranges: 13.1% for AGIs $25k-50k, 5.2% for AGIs $50k-75k, 11.5% for AGIs $75k-100k, 16.7% for AGIs $100k-200k)
Charity contributions: $3,771 (reported on 17.7% of returns)
Here:
$3,771
State:
$4,044
(% of AGI for various income ranges: 1.7% for AGIs $25k-50k, 0.6% for AGIs $50k-75k, 1.6% for AGIs $75k-100k, 2.8% for AGIs $100k-200k)
Taxes paid: $6,550 (reported on 25.3% of returns)
51652:
$6,550
State:
$8,846
(% of AGI for various income ranges: 2.5% for AGIs $25k-50k, 1.7% for AGIs $50k-75k, 3.9% for AGIs $75k-100k, 8.1% for AGIs $100k-200k)
Earned income credit: $2,300 (reported on 17.7% of returns)
Here:
$2,300
State:
$2,098
(% of AGI for various income ranges: 6.4% for AGIs below $25k, 1.3% for AGIs $25k-50k)
Percentage of individuals using paid preparers for their 2012 taxes: 75.9%
Here:
76%
State:
65%
(% for various income ranges: 70.0% for AGIs below $25k, 73.7% for AGIs $25k-50k, 78.6% for AGIs $50k-75k, 85.7% for AGIs $75k-100k, 114.3% for AGIs $100k-200k)
Averages for the 2004 tax year for zip code 51652, filed in 2005:
Average Adjusted Gross Income (AGI) in 2004: $35,167 (Individual Income Tax Returns)
Here:
$35,167
State:
$43,875
Salary/wage: $31,396 (reported on 85.3% of returns)
Here:
$31,396
State:
$38,265
(% of AGI for various income ranges: 144.9% for AGIs below $10k, 70.0% for AGIs $10k-25k, 83.8% for AGIs $25k-50k, 77.5% for AGIs $50k-75k, 78.3% for AGIs $75k-100k, 42.4% for AGIs over 100k)
Taxable interest for individuals: $1,814 (reported on 45.6% of returns)
This zip code:
$1,814
Iowa:
$1,768
(% of AGI for various income ranges: 5.7% for AGIs below $10k, 5.5% for AGIs $10k-25k, 1.7% for AGIs $25k-50k, 2.3% for AGIs $50k-75k, 0.5% for AGIs $75k-100k, 3.3% for AGIs over 100k)
Taxable dividends: $1,309 (reported on 23.6% of returns)
Here:
$1,309
State:
$2,510
(% of AGI for various income ranges: 0.9% for AGIs below $10k, 0.9% for AGIs $10k-25k, 1.5% for AGIs $25k-50k, 0.5% for AGIs $50k-75k, 0.9% for AGIs $75k-100k)
Net capital gain/loss: +$2,205 (reported on 17.8% of returns)
Here:
+$2,205
State:
+$6,139
(% of AGI for various income ranges: 0.6% for AGIs $10k-25k, 0.6% for AGIs $25k-50k, 1.6% for AGIs $50k-75k, 1.0% for AGIs $75k-100k, 2.5% for AGIs over 100k)
Profit/loss from business: +$3,279 (reported on 14.0% of returns)
Here:
+$3,279
State:
+$8,574
(% of AGI for various income ranges: -7.1% for AGIs below $10k, 4.7% for AGIs $10k-25k, -1.2% for AGIs $25k-50k, 2.5% for AGIs $50k-75k, 3.2% for AGIs $75k-100k)
IRA payment deduction: $1,500 (reported on 1.6% of returns)
51652:
$1,500
Iowa:
$2,970
Total itemized deductions: $13,701 (24% of AGI, reported on 20.8% of returns)
Here:
$13,701
State:
$16,976
Here:
23.8% of AGI
State:
20.8% of AGI
(% of AGI for various income ranges: 6.9% for AGIs $10k-25k, 8.2% for AGIs $25k-50k, 6.7% for AGIs $50k-75k, 10.7% for AGIs $75k-100k, 10.2% for AGIs over 100k)
Charity contributions deductions: $1,852 (3% of AGI, reported on 15.5% of returns)
Here:
$1,852
State:
$3,089
Here:
3.1% of AGI
State:
3.6% of AGI
(% of AGI for various income ranges: 0.7% for AGIs $10k-25k, 1.0% for AGIs $25k-50k, 0.8% for AGIs $50k-75k, 0.8% for AGIs $75k-100k, 0.5% for AGIs over 100k)
Total tax: $3,891 (reported on 74.4% of returns)
51652:
$3,891
State:
$6,177
(% of AGI for various income ranges: 4.8% for AGIs below $10k, 4.1% for AGIs $10k-25k, 5.9% for AGIs $25k-50k, 8.6% for AGIs $50k-75k, 10.4% for AGIs $75k-100k, 15.9% for AGIs over 100k)
Earned income credit: $1,613 (reported on 15.0% of returns)
Here:
$1,613
State:
$1,540
Percentage of individuals using paid preparers for their 2004 taxes: 80.3%
Here:
80%
State:
70%
(% for various income ranges: 67.3% for AGIs below $10k, 85.7% for AGIs $10k-25k, 80.2% for AGIs $25k-50k, 88.4% for AGIs $50k-75k, 78.4% for AGIs $75k-100k, 85.0% for AGIs over 100k)
Household received Food Stamps/SNAP in the past 12 months: 50 Household did not receive Food Stamps/SNAP in the past 12 months: 554
Women who had a birth in the past 12 months: 6 (5 now married, 0 unmarried) Women who did not have a birth in the past 12 months: 255 (128 now married, 127 unmarried)
Housing units in zip code 51652 with a mortgage: 243 (6 second mortgage, 6 both second mortgage and home equity loan) Median monthly owner costs for units with a mortgage: $1,114 Median monthly owner costs for units without a mortgage: $563
Residents with income below the poverty level in 2022:
This zip code:
7.0%
Whole state:
11.0%
Residents with income below 50% of the poverty level in 2022:
This zip code:
4.0%
Whole state:
5.5%
Median number of rooms in houses and condos:
Here:
6.9
State:
6.8
Median number of rooms in apartments:
Here:
5.0
State:
4.2
Notable locations in this zip code not listed on our city pages
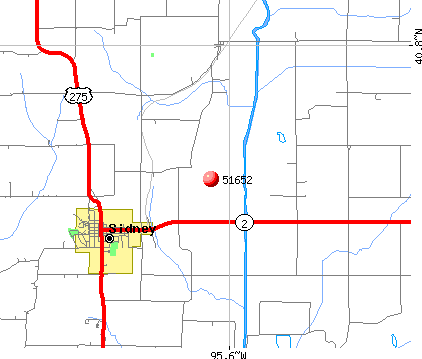
Notable locations in zip code 51652: Center School (A), Fremont County Golf Course (B), Knox (C), Mayflower School (D), Sidney Grain and Agricultural Services Incorporated Elevator (E), Fremont County Fairgrounds (F), Fremont County Historical Museum Complex (G), Riverside School (H), Fremont County Courthouse (I), Sidney Public Library (J), Sidney Fire and Rescue Department (K), Sidney City Hall (L), Fremont County Sheriffs Office (M). Display/hide their locations on the map
Churches in zip code 51652 include: Mount Zion Church (A), Our Savior Lutheran Church (B), First Presbyterian Church (C), United Methodist Church (D), Church of Christ (E), Victory Life Christian Center (F). Display/hide their locations on the map
Cemeteries: Parsley Cemetery (1), Redd Cemetery (2), Mount Zion Cemetery (3), Abshire Cemetery (4), Benson Cemetery (5), Buckham Cemetery (6), Lovelady Cemetery (7). Display/hide their locations on the map
In group quarters: 74 (-1 institutionalized population)
Size of family households: 176 2-persons, 51 3-persons, 64 4-persons, 25 5-persons, 17 6-persons, 9 7-or-more-persons
Size of nonfamily households: 195 1-person, 66 2-persons
224 married couples with children.
54 single-parent households (11 men, 43 women).
98.9% of residents of 51652 zip code speak English at home.
1.1% of residents speak Spanish at home (69% very well, 31% well).
0.2% of residents speak other Indo-European language at home (100% very well).
Foreign born population: 8 (0.6%) (38.3% of them are naturalized citizens)
This zip code:
0.6%
Whole state:
6.0%
50%Honduras
25%France
16%German
15%Irish
14%American
14%English
4%European
3%Dutch
3%French
Year of entry for the foreign-born population
02010 or later
02000 to 2009
41990 to 1999
11Before 1990
Facilities with environmental interests located in this zip code:
SIDNEY ELEMENTARY SCHOOL (1002 ILLINOIS ST in SIDNEY, IA)
(Geographic Names Information System) (National Center for Education Statistics) - STATE ID-366003 409 Organizations: SIDNEY COMM SCHOOL DISTRICT (SCHOOL DISTRICT)
SIDNEY HIGH SCHOOL (2754 KNOX ROAD in SIDNEY, IA)
(Geographic Names Information System) (National Center for Education Statistics) - STATE ID-366003 109 Organizations: SIDNEY COMM SCHOOL DISTRICT (SCHOOL DISTRICT)
SIDNEY CITY OF STP (CITY CLERK, CITY HALL in SIDNEY, IA)
National Pollutant Discharge Elimination System NON-MAJOR (Tracking pollutant discharge elimination systems) - permit Business SIC classification: SEWERAGE SYSTEMS Organizations: CITY OF SIDNEY (CONTACT/OWNER)
SIDNEY CSD (820 ILLINOIS POB 609 in SIDNEY, IA)
COMPLIANCE ACTIVITY (Tracking inspections of insecticide, fungicide, and rodenticide, and toxic substances) Alternative names: SIDNEY C.S.D.
SIDNEY SINCLAIR SITE (501 FILMORE ST in SIDNEY, IA)
SUPERFUND (Superfund database)
MOYER SERVICE (HWY 2, ~1 MI E OF TOWN in SIDNEY, IA)
Conditionally Exempt Small Quantity Generators, less than 100 kg/month of hazardous waste (Resource Conservation and Recovery Act (tracking hazardous waste)) Business NAICS classification: GENERAL AUTOMOTIVE REPAIR.
Housing units lacking complete plumbing facilities: 13.8% Housing units lacking complete kitchen facilities: 4.7%
48.6%Utility gas
33.9%Bottled, tank, or LP gas
16.4%Electricity
1.4%Wood
Population in 1990: 1,948. Population change in the 1990s: +85 (+4.4%).
Place of birth for U.S.-born residents:
This state: 578
Northeast: 3
Midwest: 786
South: 28
West: 66
56% of the 51652 zip code residents lived in the same house 5 years ago. Out of people who lived in different houses, 38% lived in this county. Out of people who lived in different counties, 50% lived in Iowa.
89% of the 51652 zip code residents lived in the same house 1 year ago. Out of people who lived in different houses, 61% moved from this county. Out of people who lived in different houses, 17% moved from different county within same state. Out of people who lived in different houses, 19% moved from different state.
Private vs. public school enrollment:
Students in private schools in grades 1 to 8 (elementary and middle school): 8
Here:
6.2%
Iowa:
10.6%
Students in private schools in grades 9 to 12 (high school): 8
Here:
10.6%
Iowa:
7.9%
Students in private undergraduate colleges:
Here:
0.0%
Iowa:
23.9%
Occupation by median earnings in the past 12 months ($)
61,965Health diagnosing and treating practitioners and other technical occupations
59,468Management occupations
50,946Health technologists and technicians
48,952Healthcare support occupations
47,269Installation, maintenance, and repair occupations
46,463Office and administrative support occupations
Companies with federal contracts located in this zip code:
WHITEHEAD FARMS CONSTRUCTION, (2468 300 AVE in SIDNEY, IA; small business) : $327,376 in 4 contractsfrom 2003 to 2004
$154,795 with Army for Maintenance, Repair or Alteration of Real Property -- Other Conservation and Development Facilities. Signed on 2003-12-01. Completion date: 2004-03-19.
$154,795 with U.S. Army Corps of Engineers - civil program financing only for Maintenance, Repair or Alteration of Real Property -- Other Conservation and Development Facilities. Signed on 2003-12-01. Completion date: 2004-03-19.
$8,893, same as above.Signed on 2004-03-31. Completion date: 2004-03-31.
$8,893 with Army for Maintenance, Repair or Alteration of Real Property -- Other Conservation and Development Facilities. Signed on 2004-03-31. Completion date: 2004-03-31.
Top industries in this zip code by the number of employees in 2005:
Health Care and Social Assistance: Nursing Care Facilities (50-99 employees: 1 establishment)
Finance and Insurance: Savings Institutions (10-19: 1)
Finance and Insurance: Commercial Banking (10-19: 1)
Health Care and Social Assistance: Residential Mental Retardation Facilities (10-19: 1)
Other Services (except Public Administration): Religious Organizations (5-9: 1, 1-4: 2)
Professional, Scientific, and Technical Services: Offices of Lawyers (5-9: 1, 1-4: 2)
People in group quarters in 2010:
49 people in nursing facilities/skilled-nursing facilities
19 people in residential treatment centers for adults
7 people in local jails and other municipal confinement facilities
People in group quarters in 2000:
70 people in nursing homes
15 people in homes for the mentally ill
13 people in local jails and other confinement facilities (including police lockups)
Fatal accident statistics in 2011:
Fatal accident count: 1
Vehicles involved in fatal accidents: 1
Fatal accidents caused by drunken drivers: 1
Fatalities: 1
Persons involved in fatal accidents: 1
Pedestrians involved in fatal accidents: 0
2002 - 2018 National Fire Incident Reporting System (NFIRS) incidents
Based on the data from the years 2002 - 2018 the average number of fire incidents per year is 16. The highest number of reported fires - 38 took place in 2012, and the least - 1 in 2010. The data has a decreasing trend.
When looking into fire subcategories, the most reports belonged to: Outside Fires (40.4%), and Structure Fires (28.2%).
Fire incident types reported to NFIRS in Zip Code 51652


 Nearest zip codes: 51653, 51649, 51650, 51640, 51639, 51654.


 Based on the data from the years 2002 - 2018 the average number of fire incidents per year is 16. The highest number of reported fires - 38 took place in 2012, and the least - 1 in 2010. The data has a decreasing trend.
 When looking into fire subcategories, the most reports belonged to: Outside Fires (40.4%), and Structure Fires (28.2%).