Estimated zip code population in 2022: 3,429 Zip code population in 2010: 3,202 Zip code population in 2000: 2,962
Houses and condos: 1,392 Renter-occupied apartments: 317
% of renters here:
23%
State:
28%
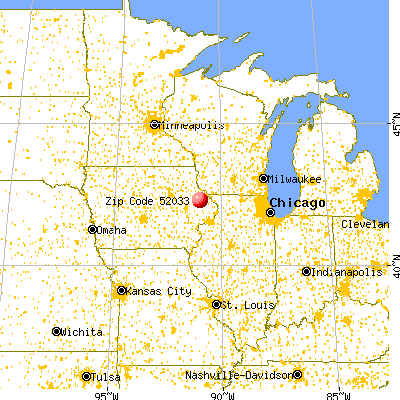
March 2022 cost of living index in zip code 52033: 83.6 (less than average, U.S. average is 100)
Land area: 97.5 sq. mi. Water area: 0.0 sq. mi.
Population density: 35 people per square mile
(very low).
OSM Map
General Map
Google Map
MSN Map
OSM Map
General Map
Google Map
MSN Map
OSM Map
General Map
Google Map
MSN Map
OSM Map
General Map
Google Map
MSN Map
Please wait while loading the map...
Real estate property taxes paid for housing units in 2022:
This zip code:
1.2% ($2,395)
Iowa:
1.4% ($2,724)
Median real estate property taxes paid for housing units with mortgages in 2022: $2,521 (1.1%) Median real estate property taxes paid for housing units with no mortgage in 2022: $2,065 (1.2%)
Estimated median house/condo value in 2022: $206,816
52033:
$206,816
Iowa:
$194,600
Median resident age:
This zip code:
33.7 years
Iowa median age:
38.9 years
Average household size:
This zip code:
2.5 people
Iowa:
2.3 people
Averages for the 2020 tax year for zip code 52033, filed in 2021:
Average Adjusted Gross Income (AGI) in 2020: $71,301 (Individual Income Tax Returns)
Here:
$71,301
State:
$71,087
Salary/wage: $55,008 (reported on 82.5% of returns)
Here:
$55,008
State:
$57,361
(% of AGI for various income ranges: 1434.8% for AGIs below $25k, 3797.0% for AGIs $25k-50k, 7008.8% for AGIs $50k-75k, 10456.7% for AGIs $75k-100k, 18165.7% for AGIs $100k-200k)
Taxable interest for individuals: $2,114 (reported on 52.5% of returns)
This zip code:
$2,114
Iowa:
$1,633
(% of AGI for various income ranges: 62.4% for AGIs below $25k, 77.0% for AGIs $25k-50k, 124.7% for AGIs $50k-75k, 273.3% for AGIs $75k-100k, 245.7% for AGIs $100k-200k)
Ordinary dividends: $4,800 (reported on 29.4% of returns)
Here:
$4,800
State:
$5,432
(% of AGI for various income ranges: 42.8% for AGIs below $25k, 84.8% for AGIs $25k-50k, 121.8% for AGIs $50k-75k, 229.2% for AGIs $75k-100k, 355.7% for AGIs $100k-200k)
Net capital gain/loss in AGI: +$11,402 (reported on 27.5% of returns)
Here:
+$11,402
State:
+$15,243
(% of AGI for various income ranges: 40.0% for AGIs below $25k, 114.8% for AGIs $25k-50k, 228.8% for AGIs $50k-75k, 383.3% for AGIs $75k-100k, 1069.3% for AGIs $100k-200k)
Profit/loss from business: +$12,639 (reported on 14.4% of returns)
Here:
+$12,639
State:
+$11,763
(% of AGI for various income ranges: 122.0% for AGIs below $25k, 95.2% for AGIs $25k-50k, 473.5% for AGIs $50k-75k, 565.8% for AGIs $75k-100k, 615.0% for AGIs $100k-200k)
Taxable individual retirement arrangement distribution: $9,900 (reported on 12.5% of returns)
52033:
$9,900
Iowa:
$17,324
(% of AGI for various income ranges: 107.2% for AGIs below $25k, 113.3% for AGIs $25k-50k, 270.6% for AGIs $50k-75k, 221.7% for AGIs $75k-100k, 485.7% for AGIs $100k-200k)
Total itemized deductions: $27,633 (reported on 3.8% of returns)
Here:
$27,633
State:
$33,775
(% of AGI for various income ranges: 470.0% for AGIs $50k-75k, 613.6% for AGIs $100k-200k)
Charity contributions: $5,400 (reported on 3.1% of returns)
Here:
$5,400
State:
$13,075
(% of AGI for various income ranges: 15.9% for AGIs $25k-50k, 162.1% for AGIs $100k-200k)
Taxes paid: $6,100 (reported on 3.8% of returns)
52033:
$6,100
State:
$7,704
(% of AGI for various income ranges: 77.6% for AGIs $50k-75k, 167.1% for AGIs $100k-200k)
Earned income credit: $2,331 (reported on 8.1% of returns)
Here:
$2,331
State:
$2,195
(% of AGI for various income ranges: 57.2% for AGIs below $25k, 59.3% for AGIs $25k-50k)
Percentage of individuals using paid preparers for their 2020 taxes: 96.2%
Here:
96%
State:
95%
(% for various income ranges: 95.2% for AGIs below $25k, 97.4% for AGIs $25k-50k, 96.3% for AGIs $50k-75k, 95.0% for AGIs $75k-100k, 96.4% for AGIs $100k-200k, 100.0% for AGIs over 200k)
Averages for the 2012 tax year for zip code 52033, filed in 2013:
Average Adjusted Gross Income (AGI) in 2012: $64,618 (Individual Income Tax Returns)
Here:
$64,618
State:
$58,860
Salary/wage: $44,683 (reported on 88.6% of returns)
Here:
$44,683
State:
$46,659
(% of AGI for various income ranges: 79.4% for AGIs below $25k, 80.2% for AGIs $25k-50k, 75.3% for AGIs $50k-75k, 77.4% for AGIs $75k-100k, 65.2% for AGIs $100k-200k, 24.1% for AGIs over 200k)
Taxable interest for individuals: $2,063 (reported on 52.3% of returns)
This zip code:
$2,063
Iowa:
$1,537
(% of AGI for various income ranges: 2.9% for AGIs below $25k, 2.1% for AGIs $25k-50k, 1.0% for AGIs $50k-75k, 1.3% for AGIs $75k-100k, 1.6% for AGIs $100k-200k, 1.9% for AGIs over 200k)
Ordinary dividends: $3,581 (reported on 28.9% of returns)
Here:
$3,581
State:
$4,542
(% of AGI for various income ranges: 2.2% for AGIs below $25k, 0.9% for AGIs $25k-50k, 1.4% for AGIs $50k-75k, 1.1% for AGIs $75k-100k, 0.9% for AGIs $100k-200k, 2.8% for AGIs over 200k)
Net capital gain/loss in AGI: +$18,178 (reported on 21.5% of returns)
Here:
+$18,178
State:
+$11,802
(% of AGI for various income ranges: 1.0% for AGIs below $25k, 1.6% for AGIs $25k-50k, 1.3% for AGIs $50k-75k, 3.0% for AGIs $75k-100k, 4.4% for AGIs $100k-200k, 16.0% for AGIs over 200k)
Profit/loss from business: +$10,739 (reported on 15.4% of returns)
Here:
+$10,739
State:
+$10,509
(% of AGI for various income ranges: 4.5% for AGIs below $25k, 4.5% for AGIs $25k-50k, 3.7% for AGIs $50k-75k, 4.0% for AGIs $75k-100k, 1.7% for AGIs $100k-200k)
Taxable individual retirement arrangement distribution: $7,876 (reported on 11.4% of returns)
52033:
$7,876
Iowa:
$11,773
(% of AGI for various income ranges: 3.3% for AGIs below $25k, 1.6% for AGIs $25k-50k, 1.8% for AGIs $50k-75k, 1.4% for AGIs $75k-100k, 2.1% for AGIs $100k-200k)
Total itemized deductions: $21,392 (16% of AGI, reported on 26.2% of returns)
Here:
$21,392
State:
$21,278
Here:
15.8% of AGI
State:
18.9% of AGI
(% of AGI for various income ranges: 4.8% for AGIs below $25k, 7.0% for AGIs $25k-50k, 6.6% for AGIs $50k-75k, 8.9% for AGIs $75k-100k, 10.6% for AGIs $100k-200k, 10.4% for AGIs over 200k)
Charity contributions: $3,915 (reported on 22.8% of returns)
Here:
$3,915
State:
$4,044
(% of AGI for various income ranges: 0.9% for AGIs $25k-50k, 1.0% for AGIs $50k-75k, 1.2% for AGIs $75k-100k, 1.8% for AGIs $100k-200k, 2.0% for AGIs over 200k)
Taxes paid: $9,172 (reported on 26.2% of returns)
52033:
$9,172
State:
$8,846
(% of AGI for various income ranges: 0.8% for AGIs below $25k, 1.9% for AGIs $25k-50k, 2.4% for AGIs $50k-75k, 3.4% for AGIs $75k-100k, 5.3% for AGIs $100k-200k, 5.4% for AGIs over 200k)
Earned income credit: $2,253 (reported on 10.1% of returns)
Here:
$2,253
State:
$2,098
(% of AGI for various income ranges: 4.1% for AGIs below $25k, 0.7% for AGIs $25k-50k)
Percentage of individuals using paid preparers for their 2012 taxes: 80.5%
Here:
81%
State:
65%
(% for various income ranges: 73.5% for AGIs below $25k, 77.8% for AGIs $25k-50k, 89.3% for AGIs $50k-75k, 83.3% for AGIs $75k-100k, 85.7% for AGIs $100k-200k, 100.0% for AGIs over 200k)
Averages for the 2004 tax year for zip code 52033, filed in 2005:
Average Adjusted Gross Income (AGI) in 2004: $47,238 (Individual Income Tax Returns)
Here:
$47,238
State:
$43,875
Salary/wage: $38,286 (reported on 85.6% of returns)
Here:
$38,286
State:
$38,265
(% of AGI for various income ranges: 125.7% for AGIs below $10k, 75.6% for AGIs $10k-25k, 80.0% for AGIs $25k-50k, 83.2% for AGIs $50k-75k, 76.1% for AGIs $75k-100k, 43.1% for AGIs over 100k)
Taxable interest for individuals: $2,077 (reported on 63.4% of returns)
This zip code:
$2,077
Iowa:
$1,768
(% of AGI for various income ranges: 12.2% for AGIs below $10k, 4.6% for AGIs $10k-25k, 3.3% for AGIs $25k-50k, 1.8% for AGIs $50k-75k, 1.2% for AGIs $75k-100k, 3.1% for AGIs over 100k)
Taxable dividends: $1,366 (reported on 30.5% of returns)
Here:
$1,366
State:
$2,510
(% of AGI for various income ranges: 2.9% for AGIs below $10k, 1.6% for AGIs $10k-25k, 0.8% for AGIs $25k-50k, 0.3% for AGIs $50k-75k, 0.8% for AGIs $75k-100k, 1.2% for AGIs over 100k)
Net capital gain/loss: +$10,367 (reported on 26.3% of returns)
Here:
+$10,367
State:
+$6,139
(% of AGI for various income ranges: 13.3% for AGIs below $10k, 1.7% for AGIs $10k-25k, 2.3% for AGIs $25k-50k, 3.2% for AGIs $50k-75k, 6.3% for AGIs $75k-100k, 10.7% for AGIs over 100k)
Profit/loss from business: +$7,181 (reported on 16.3% of returns)
Here:
+$7,181
State:
+$8,574
(% of AGI for various income ranges: 9.3% for AGIs below $10k, 3.9% for AGIs $10k-25k, 2.9% for AGIs $25k-50k, 4.2% for AGIs $50k-75k, 0.5% for AGIs $75k-100k, 1.1% for AGIs over 100k)
IRA payment deduction: $3,041 (reported on 7.1% of returns)
52033:
$3,041
Iowa:
$2,970
Self-employed pension: $6,400 (reported on 1.1% of returns)
Here:
$6,400
Iowa:
$11,928
Total itemized deductions: $15,247 (16% of AGI, reported on 26.0% of returns)
Here:
$15,247
State:
$16,976
Here:
16.0% of AGI
State:
20.8% of AGI
(% of AGI for various income ranges: 15.2% for AGIs below $10k, 6.4% for AGIs $10k-25k, 7.3% for AGIs $25k-50k, 8.4% for AGIs $50k-75k, 10.9% for AGIs $75k-100k, 8.0% for AGIs over 100k)
Charity contributions deductions: $2,416 (2% of AGI, reported on 22.7% of returns)
Here:
$2,416
State:
$3,089
Here:
2.4% of AGI
State:
3.6% of AGI
(% of AGI for various income ranges: 1.1% for AGIs below $10k, 1.0% for AGIs $10k-25k, 1.0% for AGIs $25k-50k, 1.0% for AGIs $50k-75k, 1.7% for AGIs $75k-100k, 1.2% for AGIs over 100k)
Total tax: $7,282 (reported on 79.5% of returns)
52033:
$7,282
State:
$6,177
(% of AGI for various income ranges: 5.3% for AGIs below $10k, 5.3% for AGIs $10k-25k, 6.5% for AGIs $25k-50k, 7.5% for AGIs $50k-75k, 9.3% for AGIs $75k-100k, 23.6% for AGIs over 100k)
Earned income credit: $1,241 (reported on 8.4% of returns)
Here:
$1,241
State:
$1,540
Percentage of individuals using paid preparers for their 2004 taxes: 82.8%
Here:
83%
State:
70%
(% for various income ranges: 76.3% for AGIs below $10k, 79.8% for AGIs $10k-25k, 86.9% for AGIs $25k-50k, 86.9% for AGIs $50k-75k, 79.1% for AGIs $75k-100k, 91.0% for AGIs over 100k)
Household received Food Stamps/SNAP in the past 12 months: 77 Household did not receive Food Stamps/SNAP in the past 12 months: 1,294
Women who had a birth in the past 12 months: 62 (53 now married, 9 unmarried) Women who did not have a birth in the past 12 months: 567 (327 now married, 239 unmarried)
Housing units in zip code 52033 with a mortgage: 623 (104 second mortgage, 97 both second mortgage and home equity loan) Houses without a mortgage: 27
Median monthly owner costs for units with a mortgage: $1,440 Median monthly owner costs for units without a mortgage: $481
Residents with income below the poverty level in 2022:
This zip code:
10.7%
Whole state:
11.0%
Residents with income below 50% of the poverty level in 2022:
This zip code:
2.7%
Whole state:
5.5%
Median number of rooms in houses and condos:
Here:
7.3
State:
6.8
Median number of rooms in apartments:
Here:
4.6
State:
4.2
Notable locations in this zip code not listed on our city pages
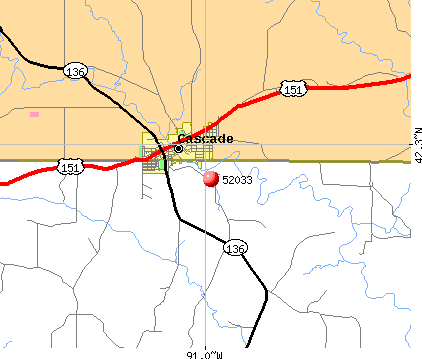
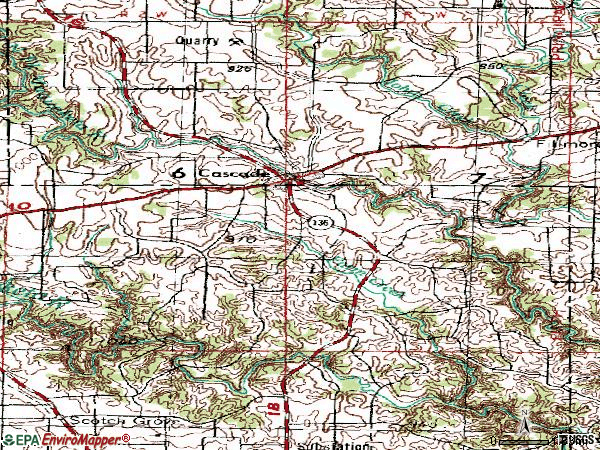
Notable locations in zip code 52033: Fillmore Fairways Golf Course (A), Cascade Sewer Plant (B), Cascade Fire Department (C), Cascade Police Department (D), Cascade Public Library (E), Cascade City Hall (F). Display/hide their locations on the map
Churches in zip code 52033 include: Saint Matthias Parish (A), Saint Peters Catholic Church (B), Community Presbyterian Church (C), Saint Peters Church (D). Display/hide their locations on the map
Cemeteries: Saint Peters Temple Hill Cemetery (1), Cascade Protestant Cemetery (2), Saint Martins Catholic Cemetery (3), Saint Marys Catholic Cemetery (4). Display/hide their locations on the map
In group quarters: 61 (-1 institutionalized population)
Size of family households: 450 2-persons, 83 3-persons, 195 4-persons, 73 5-persons, 68 6-persons, 9 7-or-more-persons
Size of nonfamily households: 370 1-person, 111 2-persons, 4 3-persons
819 married couples with children.
196 single-parent households (20 men, 176 women).
95.4% of residents of 52033 zip code speak English at home.
4.1% of residents speak Spanish at home (94% very well, 6% well, 1% not well).
0.3% of residents speak other Indo-European language at home (100% very well).
0.2% of residents speak Asian or Pacific Island language at home (100% very well).
Foreign born population: 32 (0.9%) (54.2% of them are naturalized citizens)
This zip code:
0.9%
Whole state:
6.0%
23%North Macedonia (Macedonia)
17%El Salvador
13%Malaysia
13%Honduras
13%Nicaragua
10%Japan
48%German
20%Irish
10%American
2%Polish
2%Luxembourger
2%European
1%Scottish
Year of entry for the foreign-born population
172010 or later
02000 to 2009
71990 to 1999
30Before 1990
Major facilities with environmental interests located in this zip code:
CASCADE ELEMENTARY SCHOOL (110 HARRISON ST SE in CASCADE, IA)
(Geographic Names Information System) (National Center for Education Statistics) - STATE ID-316961 418 Organizations: WESTERN DUBUQUE COMM SCHOOL DISTRICT (SCHOOL DISTRICT)
CASCADE JUNIOR-SENIOR HIGH SCHOOL (505 JOHNSON ST NW in CASCADE, IA)
(National Center for Education Statistics) - STATE ID-316961 172 Organizations: WESTERN DUBUQUE COMM SCHOOL DISTRICT (SCHOOL DISTRICT)
CASCADE MUNICIPAL UTILITIES (320 1ST AVENUE WEST in CASCADE, IA)
AIR SYNTHETIC MINOR (AIRS/AFS) COMPLIANCE ACTIVITY (Tracking inspections of insecticide, fungicide, and rodenticide, and toxic substances) National Pollutant Discharge Elimination System NON-MAJOR (Tracking pollutant discharge elimination systems) - permit Business SIC classification: COMBINATION UTILITIES; SEWERAGE SYSTEMS Organizations: CASCADE CITY OF STP (CONTACT/OWNER)
Alternative names: CASCADE CITY OF STP
R & J REITER (7272 BELLEVUE CASCADE RD. in CASCADE, IA)
National Pollutant Discharge Elimination System NON-MAJOR (Tracking pollutant discharge elimination systems) - permit Alternative names: LOWE'S OF RIVERVIEW, FL
AMERICAN IOWA MFG INC (117 NIXON ST in CASCADE, IA)
AIR MINOR (AIRS/AFS) Business SIC classification: FARM MACHINERY AND EQUIPMENT; SPORTING AND ATHLETIC GOODS
AT&T (3.7 MI W OF TOWN ON HWY 151 in CASCADE, IA)
(Resource Conservation and Recovery Act (tracking hazardous waste))
BARD CONCRETE (24773 HIGHWAY 136 in CASCADE, IA)
AIR MINOR (AIRS/AFS) Business SIC classification: READY-MIXED CONCRETE
CUSTOM PRECAST COMPANY (991 FARLEY ROAD in CASCADE, IA)
AIR MINOR (AIRS/AFS) Business SIC classification: CONCRETE PRODUCTS, EXCEPT BLOCK AND BRICK
CYRIL WOLFE REPAIR (577 WHITEWATER DRIVE in CASCADE, IA)
AIR MINOR (AIRS/AFS) Business SIC classification: SCRAP AND WASTE MATERIALS
SCHELL BODY SHOP (106 PIERCE ST SW BOX 686 in CASCADE, IA)
AIR MINOR (AIRS/AFS) Business SIC classification: TOP, BODY, AND UPHOLSTERY REPAIR SHOPS AND PAINT SHOPS Alternative names: CLOSED FACILITY -- SCHELL BODY SHOP
HOSCH INTERIORS (106 PIERCE STREET in CASCADE, IA)
(Resource Conservation and Recovery Act (tracking hazardous waste))
PRIVATE RESIDENCE OF THOMAS MCDERMOTT (804 2ND AVE NE in CASCADE, IA)
(Resource Conservation and Recovery Act (tracking hazardous waste)) Business NAICS classification: MACHINE TOOL (METAL CUTTING TYPES) MANUFACTURING.
AQUIN ELEMENTARY SCHOOL (608 3RD AVE in CASCADE, IA)
COMPLIANCE ACTIVITY (Tracking inspections of insecticide, fungicide, and rodenticide, and toxic substances)
Housing units lacking complete kitchen facilities: 1.6%
51.9%Utility gas
24.8%Bottled, tank, or LP gas
14.6%Electricity
5.7%Wood
1.7%No fuel used
1.5%Fuel oil, kerosene, etc.
Population in 1990: 3,155.
Place of birth for U.S.-born residents:
This state: 2,993
Northeast: 15
Midwest: 156
South: 135
West: 74
69% of the 52033 zip code residents lived in the same house 5 years ago. Out of people who lived in different houses, 53% lived in this county. Out of people who lived in different counties, 50% lived in Iowa.
92% of the 52033 zip code residents lived in the same house 1 year ago. Out of people who lived in different houses, 57% moved from this county. Out of people who lived in different houses, 22% moved from different county within same state. Out of people who lived in different houses, 21% moved from different state.
Private vs. public school enrollment:
Students in private schools in grades 1 to 8 (elementary and middle school): 76
Here:
18.9%
Iowa:
10.6%
Students in private schools in grades 9 to 12 (high school): 23
Here:
15.7%
Iowa:
7.9%
Students in private undergraduate colleges: 10
Here:
13.8%
Iowa:
23.9%
Occupation by median earnings in the past 12 months ($)
83,755Computer and mathematical occupations
83,027Architecture and engineering occupations
68,037Health technologists and technicians
67,682Management occupations
57,935Business and financial operations occupations
56,632Arts, design, entertainment, sports, and media occupations
Top industries in this zip code by the number of employees in 2005:
Educational Services: Elementary and Secondary Schools (50-99 employees: 1 establishment)
Health Care and Social Assistance: Nursing Care Facilities (50-99: 1)
Information: Cellular and Other Wireless Telecommunications (20-49: 1)
Detailed PMIC statistics for the following Tracts:0103.00
, 0104.00
2002 - 2018 National Fire Incident Reporting System (NFIRS) incidents
According to the data from the years 2002 - 2018 the average number of fire incidents per year is 11. The highest number of fire incidents - 24 took place in 2014, and the least - 0 in 2008. The data has a dropping trend.
When looking into fire subcategories, the most incidents belonged to: Outside Fires (49.5%), and Structure Fires (29.9%).
Fire incident types reported to NFIRS in Zip Code 52033


 Nearest zip codes: 52321, 52046, 52032, 52078, 52309, 52212.


 According to the data from the years 2002 - 2018 the average number of fire incidents per year is 11. The highest number of fire incidents - 24 took place in 2014, and the least - 0 in 2008. The data has a dropping trend.
 When looking into fire subcategories, the most incidents belonged to: Outside Fires (49.5%), and Structure Fires (29.9%).