Estimated zip code population in 2022: 827 Zip code population in 2010: 1,130 Zip code population in 2000: 989
Houses and condos: 346 Renter-occupied apartments: 33
% of renters here:
11%
State:
28%
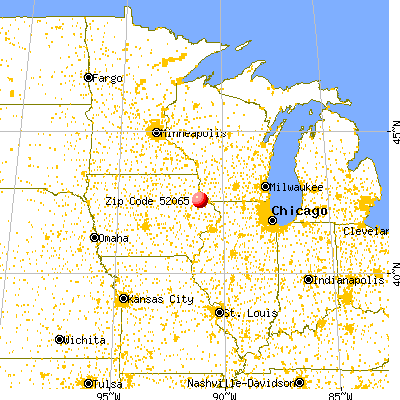
March 2022 cost of living index in zip code 52065: 83.8 (less than average, U.S. average is 100)
Land area: 50.7 sq. mi. Water area: 0.0 sq. mi.
Population density: 16 people per square mile
(very low).
OSM Map
General Map
Google Map
MSN Map
OSM Map
General Map
Google Map
MSN Map
OSM Map
General Map
Google Map
MSN Map
OSM Map
General Map
Google Map
MSN Map
Please wait while loading the map...
Real estate property taxes paid for housing units in 2022:
This zip code:
1.1% ($2,386)
Iowa:
1.4% ($2,724)
Median real estate property taxes paid for housing units with mortgages in 2022: $1,957 (1.0%) Median real estate property taxes paid for housing units with no mortgage in 2022: $2,654 (1.2%)
Business Search- 14 Million verified businesses
Males: 401
(48.5%)
Females: 425
(51.5%)
For population 25 years and over in 52065:
High school or higher: 94.5%
Bachelor's degree or higher: 19.9%
Graduate or professional degree: 4.2%
Unemployed: 0.9%
Mean travel time to work (commute): 27.5 minutes
For population 15 years and over in 52065:
Never married: 23.5%
Now married: 66.8%
Separated: 1.2%
Widowed: 6.5%
Divorced: 2.0%
Zip code 52065 compared to state average:
Unemployed percentage significantly below state average.
Black race population percentage significantly below state average.
Hispanic race population percentage significantly below state average.
Foreign-born population percentage significantly below state average.
Renting percentage significantly below state average.
Length of stay since moving in significantly above state average.
Number of rooms per house above state average.
Number of college students below state average.
Percentage of population with a bachelor's degree or higher below state average.
Estimated median house/condo value in 2022: $211,531
52065:
$211,531
Iowa:
$194,600
Median resident age:
This zip code:
38.5 years
Iowa median age:
38.9 years
Average household size:
This zip code:
2.8 people
Iowa:
2.3 people
Averages for the 2020 tax year for zip code 52065, filed in 2021:
Average Adjusted Gross Income (AGI) in 2020: $60,514 (Individual Income Tax Returns)
Here:
$60,514
State:
$71,087
Salary/wage: $48,737 (reported on 83.3% of returns)
Here:
$48,737
State:
$57,361
(% of AGI for various income ranges: 1538.3% for AGIs below $25k, 5034.3% for AGIs $25k-50k, 8627.5% for AGIs $50k-75k, 9850.0% for AGIs $75k-100k, 20683.3% for AGIs $100k-200k)
Taxable interest for individuals: $2,776 (reported on 59.5% of returns)
This zip code:
$2,776
Iowa:
$1,633
(% of AGI for various income ranges: 63.3% for AGIs below $25k, 117.1% for AGIs $25k-50k, 280.0% for AGIs $50k-75k, 306.7% for AGIs $75k-100k, 1233.3% for AGIs $100k-200k)
Ordinary dividends: $4,231 (reported on 31.0% of returns)
Here:
$4,231
State:
$5,432
(% of AGI for various income ranges: 85.0% for AGIs below $25k, 21.4% for AGIs $25k-50k, 475.0% for AGIs $50k-75k, 980.0% for AGIs $100k-200k)
Net capital gain/loss in AGI: +$9,357 (reported on 33.3% of returns)
Here:
+$9,357
State:
+$15,243
(% of AGI for various income ranges: 145.0% for AGIs below $25k, 181.4% for AGIs $25k-50k, 552.5% for AGIs $50k-75k, 870.0% for AGIs $75k-100k, 2046.7% for AGIs $100k-200k)
Profit/loss from business: +$9,280 (reported on 11.9% of returns)
Here:
+$9,280
State:
+$11,763
(% of AGI for various income ranges: 225.0% for AGIs below $25k, 822.5% for AGIs $50k-75k)
Taxable individual retirement arrangement distribution: $12,920 (reported on 11.9% of returns)
52065:
$12,920
Iowa:
$17,324
(% of AGI for various income ranges: 516.7% for AGIs below $25k, 1120.0% for AGIs $75k-100k)
Earned income credit: $2,000 (reported on 7.1% of returns)
Here:
$2,000
State:
$2,195
(% of AGI for various income ranges: 100.0% for AGIs below $25k)
Percentage of individuals using paid preparers for their 2020 taxes: 95.2%
Here:
95%
State:
95%
(% for various income ranges: 90.9% for AGIs below $25k, 100.0% for AGIs $25k-50k, 87.5% for AGIs $50k-75k, 100.0% for AGIs $75k-100k, 100.0% for AGIs $100k-200k)
Averages for the 2012 tax year for zip code 52065, filed in 2013:
Average Adjusted Gross Income (AGI) in 2012: $52,282 (Individual Income Tax Returns)
Here:
$52,282
State:
$58,860
Salary/wage: $35,468 (reported on 84.1% of returns)
Here:
$35,468
State:
$46,659
(% of AGI for various income ranges: 71.7% for AGIs below $25k, 70.8% for AGIs $25k-50k, 62.5% for AGIs $50k-75k, 66.7% for AGIs $75k-100k, 38.3% for AGIs $100k-200k)
Taxable interest for individuals: $2,361 (reported on 63.6% of returns)
This zip code:
$2,361
Iowa:
$1,537
(% of AGI for various income ranges: 2.9% for AGIs below $25k, 4.5% for AGIs $25k-50k, 3.1% for AGIs $50k-75k, 1.1% for AGIs $75k-100k, 2.8% for AGIs $100k-200k)
Ordinary dividends: $1,914 (reported on 31.8% of returns)
Here:
$1,914
State:
$4,542
(% of AGI for various income ranges: 1.9% for AGIs below $25k, 1.0% for AGIs $25k-50k, 2.9% for AGIs $50k-75k, 0.8% for AGIs $75k-100k, 0.5% for AGIs $100k-200k)
Net capital gain/loss in AGI: +$12,769 (reported on 29.5% of returns)
Here:
+$12,769
State:
+$11,802
(% of AGI for various income ranges: 6.2% for AGIs below $25k, 5.8% for AGIs $25k-50k, 17.7% for AGIs $50k-75k, 7.2% for AGIs $100k-200k)
Profit/loss from business: +$4,880 (reported on 11.4% of returns)
Here:
+$4,880
State:
+$10,509
Taxable individual retirement arrangement distribution: $6,133 (reported on 13.6% of returns)
52065:
$6,133
Iowa:
$11,773
Total itemized deductions: $17,067 (17% of AGI, reported on 20.5% of returns)
Here:
$17,067
State:
$21,278
Here:
16.8% of AGI
State:
18.9% of AGI
(% of AGI for various income ranges: 8.5% for AGIs $25k-50k, 15.0% for AGIs $50k-75k, 6.8% for AGIs $100k-200k)
Charity contributions: $2,471 (reported on 15.9% of returns)
Here:
$2,471
State:
$4,044
(% of AGI for various income ranges: 1.4% for AGIs below $25k, 2.1% for AGIs $50k-75k, 0.8% for AGIs $100k-200k)
Taxes paid: $6,033 (reported on 20.5% of returns)
52065:
$6,033
State:
$8,846
(% of AGI for various income ranges: 1.9% for AGIs $25k-50k, 5.1% for AGIs $50k-75k, 3.2% for AGIs $100k-200k)
Earned income credit: $1,825 (reported on 9.1% of returns)
Here:
$1,825
State:
$2,098
(% of AGI for various income ranges: 1.6% for AGIs $25k-50k)
Percentage of individuals using paid preparers for their 2012 taxes: 86.4%
Here:
86%
State:
65%
(% for various income ranges: 81.2% for AGIs below $25k, 84.6% for AGIs $25k-50k, 83.3% for AGIs $50k-75k, 100.0% for AGIs $75k-100k, 100.0% for AGIs $100k-200k)
Averages for the 2004 tax year for zip code 52065, filed in 2005:
Average Adjusted Gross Income (AGI) in 2004: $39,734 (Individual Income Tax Returns)
Here:
$39,734
State:
$43,875
Salary/wage: $29,441 (reported on 80.3% of returns)
Here:
$29,441
State:
$38,265
(% of AGI for various income ranges: 1831.6% for AGIs below $10k, 69.2% for AGIs $10k-25k, 71.6% for AGIs $25k-50k, 63.5% for AGIs $50k-75k, 58.9% for AGIs $75k-100k, 23.0% for AGIs over 100k)
Taxable interest for individuals: $2,510 (reported on 74.1% of returns)
This zip code:
$2,510
Iowa:
$1,768
(% of AGI for various income ranges: 310.5% for AGIs below $10k, 8.4% for AGIs $10k-25k, 3.2% for AGIs $25k-50k, 5.1% for AGIs $50k-75k, 4.5% for AGIs $75k-100k, 2.6% for AGIs over 100k)
Taxable dividends: $699 (reported on 34.7% of returns)
Here:
$699
State:
$2,510
(% of AGI for various income ranges: 31.6% for AGIs below $10k, 1.0% for AGIs $10k-25k, 1.0% for AGIs $25k-50k, 0.2% for AGIs $50k-75k, 0.6% for AGIs $75k-100k, 0.3% for AGIs over 100k)
Net capital gain/loss: +$9,782 (reported on 37.1% of returns)
Here:
+$9,782
State:
+$6,139
(% of AGI for various income ranges: 73.7% for AGIs below $10k, 7.8% for AGIs $10k-25k, 8.5% for AGIs $25k-50k, 9.8% for AGIs $50k-75k, 15.3% for AGIs $75k-100k, 5.8% for AGIs over 100k)
Profit/loss from business: +$5,531 (reported on 11.6% of returns)
Here:
+$5,531
State:
+$8,574
IRA payment deduction: $4,000 (reported on 6.4% of returns)
52065:
$4,000
Iowa:
$2,970
Total itemized deductions: $14,116 (19% of AGI, reported on 20.4% of returns)
Here:
$14,116
State:
$16,976
Here:
18.7% of AGI
State:
20.8% of AGI
(% of AGI for various income ranges: 9.5% for AGIs $10k-25k, 5.5% for AGIs $25k-50k, 6.9% for AGIs $50k-75k, 8.0% for AGIs $75k-100k, 8.6% for AGIs over 100k)
Charity contributions deductions: $1,684 (2% of AGI, reported on 18.8% of returns)
Here:
$1,684
State:
$3,089
Here:
2.2% of AGI
State:
3.6% of AGI
(% of AGI for various income ranges: 1.3% for AGIs $10k-25k, 0.6% for AGIs $25k-50k, 0.4% for AGIs $50k-75k, 1.3% for AGIs $75k-100k, 1.1% for AGIs over 100k)
Total tax: $5,012 (reported on 80.5% of returns)
52065:
$5,012
State:
$6,177
(% of AGI for various income ranges: 78.9% for AGIs below $10k, 5.2% for AGIs $10k-25k, 6.6% for AGIs $25k-50k, 8.0% for AGIs $50k-75k, 11.0% for AGIs $75k-100k, 19.8% for AGIs over 100k)
Earned income credit: $1,625 (reported on 11.4% of returns)
Here:
$1,625
State:
$1,540
Percentage of individuals using paid preparers for their 2004 taxes: 85.5%
Here:
86%
State:
70%
(% for various income ranges: 74.0% for AGIs below $10k, 84.4% for AGIs $10k-25k, 92.1% for AGIs $25k-50k, 84.5% for AGIs $50k-75k, 86.4% for AGIs $75k-100k, 100.0% for AGIs over 100k)
Household received Food Stamps/SNAP in the past 12 months: 15 Household did not receive Food Stamps/SNAP in the past 12 months: 284
Women who had a birth in the past 12 months: 8 (8 now married, 0 unmarried) Women who did not have a birth in the past 12 months: 163 (114 now married, 48 unmarried)
Housing units in zip code 52065 with a mortgage: 117 (4 second mortgage, 4 both second mortgage and home equity loan) Median monthly owner costs for units with a mortgage: $1,254 Median monthly owner costs for units without a mortgage: $550
Residents with income below the poverty level in 2022:
This zip code:
2.1%
Whole state:
11.0%
Residents with income below 50% of the poverty level in 2022:
This zip code:
1.7%
Whole state:
5.5%
Median number of rooms in houses and condos:
Here:
7.4
State:
6.8
Median number of rooms in apartments:
Here:
5.8
State:
4.2
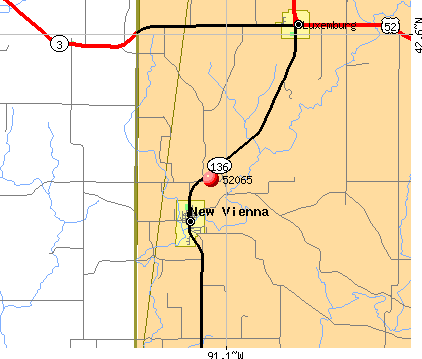
Notable locations in this zip code not listed on our city pages
Notable locations in zip code 52065: Luxemburg City Hall (A), Heritage House Museum (B), New Vienna Community Hall (C), New Vienna - Luxemburg Fire Department (D). Display/hide their locations on the map
Size of family households: 112 2-persons, 27 3-persons, 25 4-persons, 22 5-persons, 40 6-persons
Size of nonfamily households: 54 1-person, 16 2-persons
247 married couples with children.
14 single-parent households (14 women).
98.0% of residents of 52065 zip code speak English at home.
1.6% of residents speak Spanish at home (100% well).
0.1% of residents speak other Indo-European language at home (100% very well).
Foreign born population: 0 (0.0%)
:
0.0%
Whole state:
6.0%
75%German
12%American
1%European
1%Irish
1%Italian
0%Norwegian
0%Luxembourger
Year of entry for the foreign-born population
02010 or later
02000 to 2009
01990 to 1999
3Before 1990
Facilities with environmental interests located in this zip code:
NEW VIENNA CITY OF STP (CITY CLERK in NEW VIENNA, IA)
National Pollutant Discharge Elimination System NON-MAJOR (Tracking pollutant discharge elimination systems) - permit Business SIC classification: SEWERAGE SYSTEMS Organizations: CITY OF NEW VIENNA (CONTACT/OWNER)
ST BONIFACE SCHOOL (HWY 136 in NEW VIENNA, IA)
COMPLIANCE ACTIVITY (Tracking inspections of insecticide, fungicide, and rodenticide, and toxic substances)
HENNESSY CATHOLIC SCHOOL (ST. BONIFICE CENTER 7420 COLUMBUS STREET in NEW VIENNA, IA)
COMPLIANCE ACTIVITY (Tracking inspections of insecticide, fungicide, and rodenticide, and toxic substances)
56.8%Utility gas
18.8%Bottled, tank, or LP gas
18.8%Wood
5.2%Electricity
0.7%Other fuel
Population in 1990: 835. Population change in the 1990s: +154 (+18.4%).
Place of birth for U.S.-born residents:
This state: 768
Northeast: 7
Midwest: 19
South: 23
West: 5
81% of the 52065 zip code residents lived in the same house 5 years ago. Out of people who lived in different houses, 71% lived in this county.
98% of the 52065 zip code residents lived in the same house 1 year ago. Out of people who lived in different houses, 108% moved from this county.
Private vs. public school enrollment:
Students in private schools in grades 1 to 8 (elementary and middle school): 51
Here:
28.1%
Iowa:
10.6%
Students in private schools in grades 9 to 12 (high school): 8
Here:
19.4%
Iowa:
7.9%
Students in private undergraduate colleges: 11
Here:
92.8%
Iowa:
23.9%
Occupation by median earnings in the past 12 months ($)
105,918Law enforcement workers including supervisors
100,202Business and financial operations occupations
69,363Sales and related occupations
63,788Health diagnosing and treating practitioners and other technical occupations
51,957Construction and extraction occupations
50,897Production occupations
Companies with federal contracts located in this zip code:
TAYLOR CONSTRUCTION INC (7314 COLUMBUS ST in NEW VIENNA, IA) : $165,542 in 5 contractsfrom 2000 to 2005
Contracts for Maintenance, Repair or Alteration of Real Property -- Other Non-Building Facilities by U.S. Army Corps of Engineers - civil program financing only, Army Signed by year:2000: $38,174; 2001: $0; 2002: $0; 2003: $0; 2004: $110,700; 2005: $16,668; 2006: $0.
Biggest contracts:
$55,350 with U.S. Army Corps of Engineers - civil program financing only for Maintenance, Repair or Alteration of Real Property -- Other Non-Building Facilities. Signed on 2004-09-28. Completion date: 2004-08-31.
$55,350 with Army for Maintenance, Repair or Alteration of Real Property -- Other Non-Building Facilities. Signed on 2004-09-28. Completion date: 2004-08-31.
$38,174 with U.S. Army Corps of Engineers - civil program financing only for Maintenance, Repair or Alteration of Real Property -- Other Non-Building Facilities. Signed on 2000-01-19. Completion date: 1999-04-06.
$8,334, same as above.Signed on 2005-01-18. Completion date: 2004-08-31.
Top industries in this zip code by the number of employees in 2005:
Construction: Highway, Street, and Bridge Construction (20-49 employees: 1 establishment)
Educational Services: Elementary and Secondary Schools (10-19: 1, 5-9: 1)
Finance and Insurance: Direct Property and Casualty Insurance Carriers (10-19: 1)
Finance and Insurance: Commercial Banking (5-9: 1)
Wholesale Trade: Farm and Garden Machinery and Equipment Merchant Wholesalers (5-9: 1)
Home Mortgage Disclosure Act Aggregated Statistics For Year 2009 (Based on 2 partial tracts)
A) FHA, FSA/RHS & VA Home Purchase Loans
B) Conventional Home Purchase Loans
C) Refinancings
D) Home Improvement Loans
F) Non-occupant Loans on < 5 Family Dwellings (A B C & D)
G) Loans On Manufactured Home Dwelling (A B C & D)
Number
Average Value
Number
Average Value
Number
Average Value
Number
Average Value
Number
Average Value
Number
Average Value
LOANS ORIGINATED
4
$78,888
14
$99,275
69
$155,570
4
$44,422
4
$557,958
1
$2,550
APPLICATIONS APPROVED, NOT ACCEPTED
0
$0
1
$102,120
2
$71,230
0
$0
0
$0
0
$0
APPLICATIONS DENIED
1
$34,210
2
$55,145
7
$107,883
1
$43,400
1
$43,910
0
$0
APPLICATIONS WITHDRAWN
0
$0
1
$71,480
8
$126,565
0
$0
0
$0
0
$0
FILES CLOSED FOR INCOMPLETENESS
0
$0
0
$0
1
$41,360
0
$0
0
$0
0
$0
Aggregated Statistics For Year 2008 (Based on 2 partial tracts)
A) FHA, FSA/RHS & VA Home Purchase Loans
B) Conventional Home Purchase Loans
C) Refinancings
D) Home Improvement Loans
E) Loans on Dwellings For 5+ Families
F) Non-occupant Loans on < 5 Family Dwellings (A B C & D)
Number
Average Value
Number
Average Value
Number
Average Value
Number
Average Value
Number
Average Value
Number
Average Value
LOANS ORIGINATED
4
$75,570
14
$109,889
34
$158,706
5
$53,408
1
$166,460
3
$59,740
APPLICATIONS APPROVED, NOT ACCEPTED
0
$0
1
$91,400
5
$75,978
1
$4,600
0
$0
0
$0
APPLICATIONS DENIED
0
$0
1
$116,420
8
$98,992
1
$4,080
0
$0
1
$39,320
APPLICATIONS WITHDRAWN
0
$0
3
$97,183
3
$109,950
0
$0
0
$0
0
$0
FILES CLOSED FOR INCOMPLETENESS
0
$0
1
$71,480
0
$0
0
$0
0
$0
0
$0
Aggregated Statistics For Year 2007 (Based on 2 partial tracts)
A) FHA, FSA/RHS & VA Home Purchase Loans
B) Conventional Home Purchase Loans
C) Refinancings
D) Home Improvement Loans
F) Non-occupant Loans on < 5 Family Dwellings (A B C & D)
Number
Average Value
Number
Average Value
Number
Average Value
Number
Average Value
Number
Average Value
LOANS ORIGINATED
3
$86,460
22
$91,119
27
$85,781
10
$45,341
5
$75,774
APPLICATIONS APPROVED, NOT ACCEPTED
0
$0
1
$33,700
2
$140,670
1
$11,740
0
$0
APPLICATIONS DENIED
0
$0
1
$58,720
7
$106,204
2
$53,870
0
$0
APPLICATIONS WITHDRAWN
0
$0
3
$66,037
1
$69,950
0
$0
0
$0
FILES CLOSED FOR INCOMPLETENESS
0
$0
1
$51,060
1
$96,500
0
$0
0
$0
Aggregated Statistics For Year 2006 (Based on 2 partial tracts)
A) FHA, FSA/RHS & VA Home Purchase Loans
B) Conventional Home Purchase Loans
C) Refinancings
D) Home Improvement Loans
F) Non-occupant Loans on < 5 Family Dwellings (A B C & D)
G) Loans On Manufactured Home Dwelling (A B C & D)
Number
Average Value
Number
Average Value
Number
Average Value
Number
Average Value
Number
Average Value
Number
Average Value
LOANS ORIGINATED
3
$54,293
17
$101,639
19
$105,157
8
$31,210
1
$65,870
1
$5,110
APPLICATIONS APPROVED, NOT ACCEPTED
1
$31,660
2
$96,250
2
$50,550
0
$0
0
$0
0
$0
APPLICATIONS DENIED
1
$101,610
1
$108,760
9
$104,332
2
$83,995
0
$0
0
$0
APPLICATIONS WITHDRAWN
0
$0
2
$64,080
4
$99,695
0
$0
0
$0
0
$0
FILES CLOSED FOR INCOMPLETENESS
0
$0
0
$0
1
$121,010
0
$0
0
$0
0
$0
Aggregated Statistics For Year 2005 (Based on 2 partial tracts)
A) FHA, FSA/RHS & VA Home Purchase Loans
B) Conventional Home Purchase Loans
C) Refinancings
D) Home Improvement Loans
F) Non-occupant Loans on < 5 Family Dwellings (A B C & D)
Number
Average Value
Number
Average Value
Number
Average Value
Number
Average Value
Number
Average Value
LOANS ORIGINATED
2
$67,910
20
$81,084
33
$105,462
9
$47,259
3
$40,167
APPLICATIONS APPROVED, NOT ACCEPTED
0
$0
1
$56,680
3
$95,993
0
$0
1
$18,380
APPLICATIONS DENIED
0
$0
2
$76,845
11
$88,473
3
$51,400
1
$24,510
APPLICATIONS WITHDRAWN
0
$0
2
$72,505
5
$90,682
0
$0
1
$30,640
FILES CLOSED FOR INCOMPLETENESS
0
$0
0
$0
2
$99,055
1
$50,550
0
$0
Aggregated Statistics For Year 2004 (Based on 2 partial tracts)
A) FHA, FSA/RHS & VA Home Purchase Loans
B) Conventional Home Purchase Loans
C) Refinancings
D) Home Improvement Loans
E) Loans on Dwellings For 5+ Families
F) Non-occupant Loans on < 5 Family Dwellings (A B C & D)
G) Loans On Manufactured Home Dwelling (A B C & D)
Number
Average Value
Number
Average Value
Number
Average Value
Number
Average Value
Number
Average Value
Number
Average Value
Number
Average Value
LOANS ORIGINATED
0
$0
18
$88,674
29
$96,468
4
$29,232
1
$904,780
3
$70,293
1
$15,320
APPLICATIONS APPROVED, NOT ACCEPTED
0
$0
0
$0
3
$110,970
1
$40,850
0
$0
0
$0
0
$0
APPLICATIONS DENIED
1
$25,530
2
$104,675
8
$84,632
2
$42,125
0
$0
1
$97,010
0
$0
APPLICATIONS WITHDRAWN
1
$32,170
2
$43,910
4
$72,250
0
$0
0
$0
0
$0
0
$0
FILES CLOSED FOR INCOMPLETENESS
0
$0
2
$70,465
1
$77,100
0
$0
0
$0
0
$0
0
$0
Aggregated Statistics For Year 2003 (Based on 2 partial tracts)
A) FHA, FSA/RHS & VA Home Purchase Loans
B) Conventional Home Purchase Loans
C) Refinancings
D) Home Improvement Loans
E) Loans on Dwellings For 5+ Families
F) Non-occupant Loans on < 5 Family Dwellings (A B C & D)
Number
Average Value
Number
Average Value
Number
Average Value
Number
Average Value
Number
Average Value
Number
Average Value
LOANS ORIGINATED
2
$70,975
14
$84,723
70
$87,240
3
$30,297
1
$38,300
3
$93,100
APPLICATIONS APPROVED, NOT ACCEPTED
1
$27,570
2
$29,615
2
$30,635
0
$0
0
$0
0
$0
APPLICATIONS DENIED
0
$0
6
$72,335
6
$106,885
2
$18,380
0
$0
1
$165,950
APPLICATIONS WITHDRAWN
0
$0
1
$43,910
3
$86,460
1
$17,870
0
$0
0
$0
FILES CLOSED FOR INCOMPLETENESS
0
$0
1
$29,100
2
$70,720
0
$0
0
$0
0
$0
Aggregated Statistics For Year 2002 (Based on 2 partial tracts)
A) FHA, FSA/RHS & VA Home Purchase Loans
B) Conventional Home Purchase Loans
C) Refinancings
D) Home Improvement Loans
F) Non-occupant Loans on < 5 Family Dwellings (A B C & D)
Number
Average Value
Number
Average Value
Number
Average Value
Number
Average Value
Number
Average Value
LOANS ORIGINATED
1
$92,420
14
$74,183
42
$81,575
3
$22,467
2
$34,975
APPLICATIONS APPROVED, NOT ACCEPTED
0
$0
1
$21,960
1
$117,950
0
$0
0
$0
APPLICATIONS DENIED
1
$35,230
3
$55,317
7
$73,307
0
$0
0
$0
APPLICATIONS WITHDRAWN
0
$0
2
$68,675
3
$78,803
1
$4,080
0
$0
FILES CLOSED FOR INCOMPLETENESS
0
$0
0
$0
0
$0
0
$0
0
$0
Aggregated Statistics For Year 2001 (Based on 2 partial tracts)
A) FHA, FSA/RHS & VA Home Purchase Loans
B) Conventional Home Purchase Loans
C) Refinancings
D) Home Improvement Loans
F) Non-occupant Loans on < 5 Family Dwellings (A B C & D)
Number
Average Value
Number
Average Value
Number
Average Value
Number
Average Value
Number
Average Value
LOANS ORIGINATED
1
$84,250
8
$65,037
37
$71,898
4
$17,488
2
$24,510
APPLICATIONS APPROVED, NOT ACCEPTED
0
$0
1
$77,610
2
$62,295
0
$0
0
$0
APPLICATIONS DENIED
0
$0
1
$77,610
5
$66,888
1
$13,790
0
$0
APPLICATIONS WITHDRAWN
0
$0
3
$77,780
4
$54,380
0
$0
0
$0
FILES CLOSED FOR INCOMPLETENESS
0
$0
0
$0
2
$38,295
0
$0
0
$0
Aggregated Statistics For Year 2000 (Based on 2 partial tracts)
A) FHA, FSA/RHS & VA Home Purchase Loans
B) Conventional Home Purchase Loans
C) Refinancings
D) Home Improvement Loans
Number
Average Value
Number
Average Value
Number
Average Value
Number
Average Value
LOANS ORIGINATED
1
$103,140
14
$81,879
5
$46,668
3
$18,040
APPLICATIONS APPROVED, NOT ACCEPTED
0
$0
1
$37,780
1
$85,780
2
$20,170
APPLICATIONS DENIED
0
$0
3
$79,823
3
$60,590
0
$0
APPLICATIONS WITHDRAWN
0
$0
0
$0
4
$68,930
0
$0
FILES CLOSED FOR INCOMPLETENESS
0
$0
0
$0
0
$0
0
$0
Aggregated Statistics For Year 1999 (Based on 1 partial tract)


 Nearest zip codes: 52040, 52035, 52053, 52052, 52041, 52066.


