Estimated zip code population in 2022: 989 Zip code population in 2010: 843 Zip code population in 2000: 883
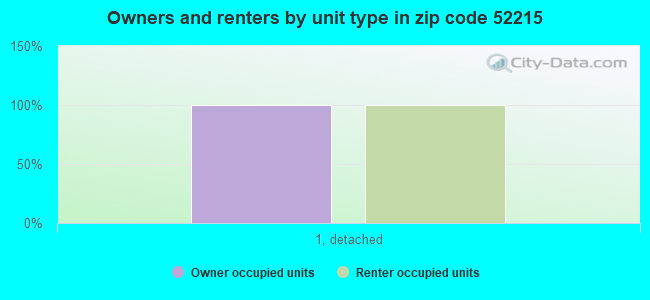
Houses and condos: 417 Renter-occupied apartments: 35
% of renters here:
9%
State:
28%
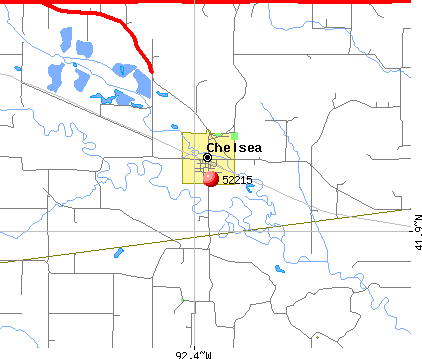
March 2022 cost of living index in zip code 52215: 81.7 (low, U.S. average is 100)
Land area: 86.3 sq. mi. Water area: 0.3 sq. mi.
Population density: 11 people per square mile
(very low).
OSM Map
General Map
Google Map
MSN Map
OSM Map
General Map
Google Map
MSN Map
OSM Map
General Map
Google Map
MSN Map
OSM Map
General Map
Google Map
MSN Map
Please wait while loading the map...
Real estate property taxes paid for housing units in 2022:
This zip code:
1.4% ($2,262)
Iowa:
1.4% ($2,724)
Median real estate property taxes paid for housing units with mortgages in 2022: $3,115 (1.1%) Median real estate property taxes paid for housing units with no mortgage in 2022: $1,719 (1.9%)
Business Search- 14 Million verified businesses
Males: 504
(51.0%)
Females: 484
(49.0%)
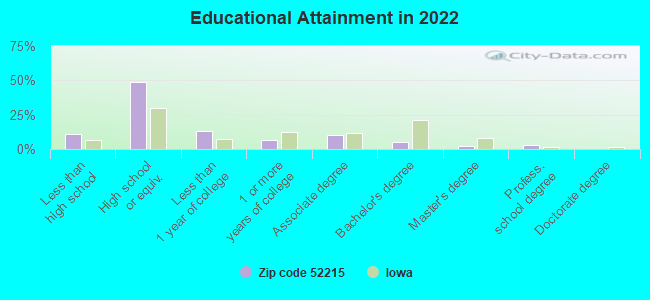
For population 25 years and over in 52215:
High school or higher: 87.5%
Bachelor's degree or higher: 10.3%
Graduate or professional degree: 4.9%
Unemployed: 1.5%
Mean travel time to work (commute): 32.2 minutes
For population 15 years and over in 52215:
Never married: 26.6%
Now married: 60.2%
Separated: 1.0%
Widowed: 6.2%
Divorced: 6.1%
Zip code 52215 compared to state average:
Unemployed percentage below state average.
Black race population percentage significantly below state average.
Hispanic race population percentage above state average.
Renting percentage significantly below state average.
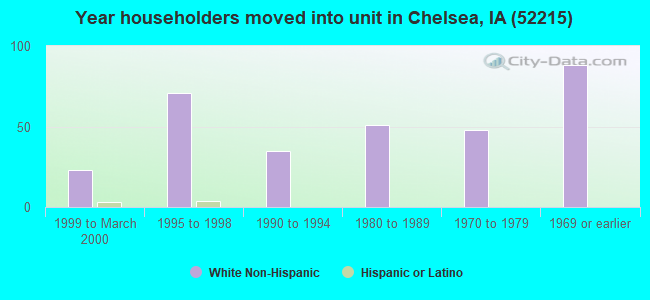
Length of stay since moving in significantly above state average.
Number of college students significantly below state average.
Percentage of population with a bachelor's degree or higher significantly below state average.
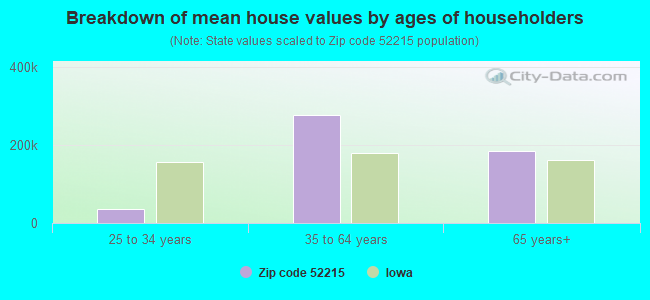
Estimated median house/condo value in 2022: $156,237
52215:
$156,237
Iowa:
$194,600
Median resident age:
This zip code:
35.8 years
Iowa median age:
38.9 years
Average household size:
This zip code:
2.5 people
Iowa:
2.3 people
Averages for the 2020 tax year for zip code 52215, filed in 2021:
Average Adjusted Gross Income (AGI) in 2020: $53,985 (Individual Income Tax Returns)
Here:
$53,985
State:
$71,087
Salary/wage: $49,061 (reported on 79.5% of returns)
Here:
$49,061
State:
$57,361
(% of AGI for various income ranges: 1305.0% for AGIs below $25k, 4290.0% for AGIs $25k-50k, 8763.3% for AGIs $50k-75k, 9920.0% for AGIs $75k-100k, 25640.0% for AGIs $100k-200k)
Taxable interest for individuals: $1,133 (reported on 46.2% of returns)
This zip code:
$1,133
Iowa:
$1,633
(% of AGI for various income ranges: 28.7% for AGIs below $25k, 92.5% for AGIs $25k-50k, 186.7% for AGIs $50k-75k, 116.7% for AGIs $75k-100k, 80.0% for AGIs $100k-200k)
Ordinary dividends: $1,233 (reported on 15.4% of returns)
Here:
$1,233
State:
$5,432
(% of AGI for various income ranges: 32.5% for AGIs below $25k, 160.0% for AGIs $50k-75k)
Net capital gain/loss in AGI: +$4,817 (reported on 15.4% of returns)
Here:
+$4,817
State:
+$15,243
(% of AGI for various income ranges: 160.0% for AGIs $25k-50k, 536.7% for AGIs $75k-100k)
Profit/loss from business: +$4,383 (reported on 15.4% of returns)
Here:
+$4,383
State:
+$11,763
(% of AGI for various income ranges: 106.2% for AGIs below $25k, 593.3% for AGIs $50k-75k)
Taxable individual retirement arrangement distribution: $10,350 (reported on 10.3% of returns)
52215:
$10,350
Iowa:
$17,324
(% of AGI for various income ranges: 517.5% for AGIs $25k-50k)
Total itemized deductions: $29,525 (reported on 10.3% of returns)
Here:
$29,525
State:
$33,775
(% of AGI for various income ranges: 3936.7% for AGIs $50k-75k)
Earned income credit: $2,150 (reported on 10.3% of returns)
Here:
$2,150
State:
$2,195
(% of AGI for various income ranges: 107.5% for AGIs below $25k)
Percentage of individuals using paid preparers for their 2020 taxes: 92.3%
Here:
92%
State:
95%
(% for various income ranges: 91.7% for AGIs below $25k, 91.7% for AGIs $25k-50k, 100.0% for AGIs $50k-75k, 80.0% for AGIs $75k-100k, 100.0% for AGIs $100k-200k)
Averages for the 2012 tax year for zip code 52215, filed in 2013:
Average Adjusted Gross Income (AGI) in 2012: $44,995 (Individual Income Tax Returns)
Here:
$44,995
State:
$58,860
Salary/wage: $40,210 (reported on 81.6% of returns)
Here:
$40,210
State:
$46,659
(% of AGI for various income ranges: 66.8% for AGIs below $25k, 77.6% for AGIs $25k-50k, 81.5% for AGIs $50k-75k, 70.1% for AGIs $75k-100k, 60.4% for AGIs $100k-200k)
Taxable interest for individuals: $1,476 (reported on 44.7% of returns)
This zip code:
$1,476
Iowa:
$1,537
(% of AGI for various income ranges: 3.5% for AGIs below $25k, 2.0% for AGIs $25k-50k, 0.8% for AGIs $50k-75k, 2.1% for AGIs $75k-100k, 0.3% for AGIs $100k-200k)
Ordinary dividends: $833 (reported on 15.8% of returns)
Here:
$833
State:
$4,542
Net capital gain/loss in AGI: +$1,457 (reported on 18.4% of returns)
Here:
+$1,457
State:
+$11,802
Profit/loss from business: +$3,700 (reported on 15.8% of returns)
Here:
+$3,700
State:
+$10,509
Taxable individual retirement arrangement distribution: $8,033 (reported on 7.9% of returns)
52215:
$8,033
Iowa:
$11,773
Total itemized deductions: $15,856 (25% of AGI, reported on 23.7% of returns)
Here:
$15,856
State:
$21,278
Here:
25.1% of AGI
State:
18.9% of AGI
(% of AGI for various income ranges: 14.1% for AGIs $25k-50k, 8.7% for AGIs $50k-75k, 13.5% for AGIs $75k-100k)
Charity contributions: $1,340 (reported on 13.2% of returns)
Here:
$1,340
State:
$4,044
Taxes paid: $5,178 (reported on 23.7% of returns)
52215:
$5,178
State:
$8,846
(% of AGI for various income ranges: 2.6% for AGIs $25k-50k, 2.4% for AGIs $50k-75k, 7.5% for AGIs $75k-100k)
Earned income credit: $1,380 (reported on 13.2% of returns)
Here:
$1,380
State:
$2,098
(% of AGI for various income ranges: 4.6% for AGIs below $25k)
Percentage of individuals using paid preparers for their 2012 taxes: 86.8%
Here:
87%
State:
65%
(% for various income ranges: 84.6% for AGIs below $25k, 90.9% for AGIs $25k-50k, 87.5% for AGIs $50k-75k, 75.0% for AGIs $75k-100k, 100.0% for AGIs $100k-200k)
Averages for the 2004 tax year for zip code 52215, filed in 2005:
Average Adjusted Gross Income (AGI) in 2004: $34,972 (Individual Income Tax Returns)
Here:
$34,972
State:
$43,875
Salary/wage: $33,043 (reported on 81.7% of returns)
Here:
$33,043
State:
$38,265
(% of AGI for various income ranges: 119.1% for AGIs below $10k, 69.9% for AGIs $10k-25k, 83.0% for AGIs $25k-50k, 79.5% for AGIs $50k-75k, 83.5% for AGIs $75k-100k, 45.6% for AGIs over 100k)
Taxable interest for individuals: $1,378 (reported on 55.6% of returns)
This zip code:
$1,378
Iowa:
$1,768
(% of AGI for various income ranges: 18.7% for AGIs below $10k, 4.8% for AGIs $10k-25k, 1.8% for AGIs $25k-50k, 2.2% for AGIs $50k-75k, 1.1% for AGIs $75k-100k)
Taxable dividends: $701 (reported on 21.8% of returns)
Here:
$701
State:
$2,510
(% of AGI for various income ranges: 1.3% for AGIs $10k-25k, 0.2% for AGIs $25k-50k, 0.5% for AGIs $50k-75k, 0.7% for AGIs $75k-100k)
Net capital gain/loss: +$2,430 (reported on 23.3% of returns)
Here:
+$2,430
State:
+$6,139
(% of AGI for various income ranges: 3.3% for AGIs below $10k, 0.4% for AGIs $10k-25k, 2.4% for AGIs $25k-50k, 1.7% for AGIs $50k-75k, 1.1% for AGIs $75k-100k)
IRA payment deduction: $2,556 (reported on 4.5% of returns)
52215:
$2,556
Iowa:
$2,970
Total itemized deductions: $13,045 (23% of AGI, reported on 22.1% of returns)
Here:
$13,045
State:
$16,976
Here:
23.1% of AGI
State:
20.8% of AGI
Charity contributions deductions: $945 (1% of AGI, reported on 13.8% of returns)
Here:
$945
State:
$3,089
Here:
1.5% of AGI
State:
3.6% of AGI
Total tax: $3,538 (reported on 74.9% of returns)
52215:
$3,538
State:
$6,177
(% of AGI for various income ranges: 4.8% for AGIs below $10k, 5.9% for AGIs $10k-25k, 5.6% for AGIs $25k-50k, 8.7% for AGIs $50k-75k, 21.1% for AGIs $75k-100k)
Earned income credit: $1,242 (reported on 8.3% of returns)
Here:
$1,242
State:
$1,540
Percentage of individuals using paid preparers for their 2004 taxes: 89.5%
Here:
89%
State:
70%
(% for various income ranges: 86.6% for AGIs below $10k, 88.3% for AGIs $10k-25k, 91.0% for AGIs $25k-50k, 92.6% for AGIs $50k-75k, 133.3% for AGIs $75k-100k)
Household received Food Stamps/SNAP in the past 12 months: 47 Household did not receive Food Stamps/SNAP in the past 12 months: 344
Women who had a birth in the past 12 months: 71 (73 now married, 0 unmarried) Women who did not have a birth in the past 12 months: 128 (60 now married, 68 unmarried)
Housing units in zip code 52215 with a mortgage: 199 (1 second mortgage, 1 both second mortgage and home equity loan) Median monthly owner costs for units with a mortgage: $1,537 Median monthly owner costs for units without a mortgage: $493
Residents with income below the poverty level in 2022:
This zip code:
24.6%
Whole state:
11.0%
Residents with income below 50% of the poverty level in 2022:
This zip code:
18.0%
Whole state:
5.5%
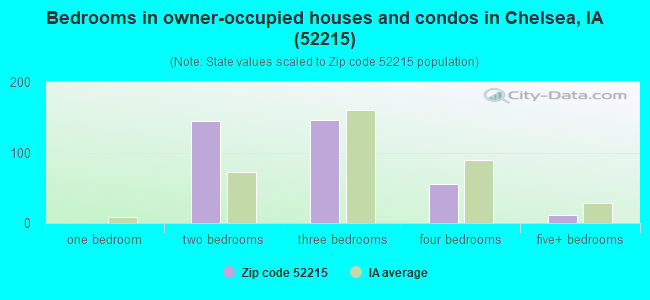
Median number of rooms in houses and condos:
Here:
7.0
State:
6.8
Median number of rooms in apartments:
Here:
6.6
State:
4.2
Notable locations in this zip code not listed on our city pages
Notable locations in zip code 52215: Chelsea (A), Chelsea City Hall (B), Chelsea Fire Department (C), Chelsea Public Library (D). Display/hide their locations on the map
Cemeteries: Squires Cemetery (1), Rector Cemetery (2), Saint Josephs Cemetery (3), Saint Mary Cemetery (4), Chambers Cemetery (5), Craig Cemetery (6), Stayskal Cemetery (7). Display/hide their locations on the map
Streams, rivers, and creeks: Richland Creek (A), Plague Mine Creek (B), Otter Creek (C), North Walnut Creek (D), Hog Run (E). Display/hide their locations on the map
Size of family households: 74 2-persons, 59 3-persons, 114 4-persons, 12 5-persons, 2 6-persons, 5 7-or-more-persons
Size of nonfamily households: 116 1-person, 2 2-persons
262 married couples with children.
62 single-parent households (22 men, 40 women).
87.3% of residents of 52215 zip code speak English at home.
12.0% of residents speak Spanish at home (37% very well, 4% well, 21% not well, 38% not at all).
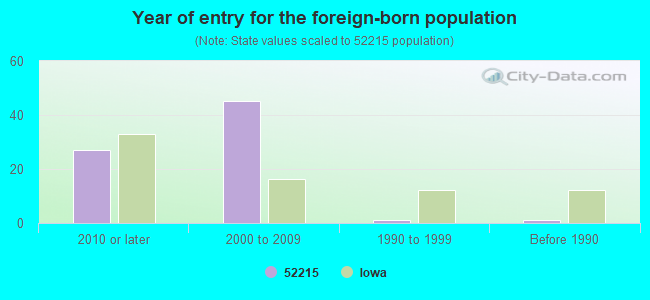
Foreign born population: 78 (8.0%) (40.0% of them are naturalized citizens)
This zip code:
8.0%
Whole state:
6.0%
63%Barbados
28%Honduras
3%Colombia
35%German
18%Czech
8%European
5%American
4%Swedish
2%Norwegian
1%Russian
Year of entry for the foreign-born population
272010 or later
452000 to 2009
11990 to 1999
1Before 1990
Facilities with environmental interests located in this zip code:
CHELSEA ELEMENTARY SCHOOL (500 OLIVE STREET in CHELSEA, IA)
(Geographic Names Information System) (National Center for Education Statistics) - STATE ID-866098 409 Organizations: SOUTH TAMA COUNTY COMM SCHOOL DISTRICT (SCHOOL DISTRICT)
CHELSEA CITY OF STP (CITY CLERK in CHELSEA, IA)
National Pollutant Discharge Elimination System NON-MAJOR (Tracking pollutant discharge elimination systems) - permit Business SIC classification: SEWERAGE SYSTEMS Organizations: CITY OF CHELSEA (CONTACT/OWNER)
AT&T-MICROWAVE TOWER SITE (NE CORNER OF HWY V-18 & S AVE in CHELSEA, IA)
(Resource Conservation and Recovery Act (tracking hazardous waste))
Housing units lacking complete plumbing facilities: 5.9% Housing units lacking complete kitchen facilities: 4.8%
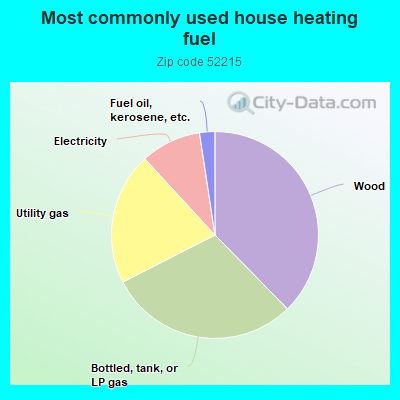
37.9%Wood
30.0%Bottled, tank, or LP gas
20.8%Utility gas
9.5%Electricity
2.4%Fuel oil, kerosene, etc.
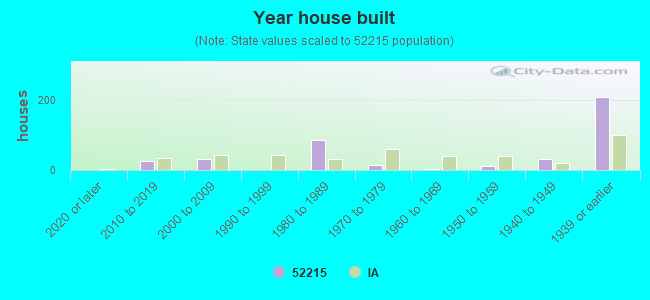
Population in 1990: 906.
Place of birth for U.S.-born residents:
This state: 826
Northeast: 4
Midwest: 24
South: 28
West: 30
66% of the 52215 zip code residents lived in the same house 5 years ago. Out of people who lived in different houses, 58% lived in this county. Out of people who lived in different counties, 50% lived in Iowa.
91% of the 52215 zip code residents lived in the same house 1 year ago. Out of people who lived in different houses, 37% moved from this county. Out of people who lived in different houses, 40% moved from different county within same state. Out of people who lived in different houses, 23% moved from different state.
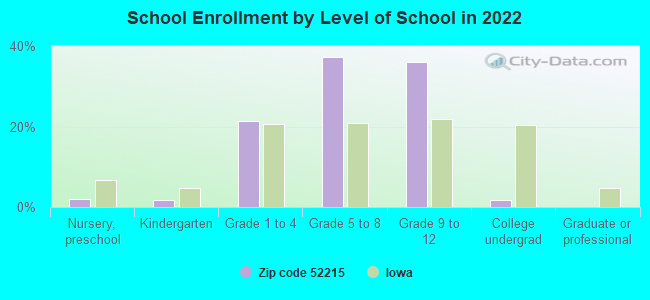
Private vs. public school enrollment:
Students in private schools in grades 1 to 8 (elementary and middle school): 2
Here:
1.5%
Iowa:
10.6%
Students in private schools in grades 9 to 12 (high school):
Here:
0.0%
Iowa:
7.9%
Students in private undergraduate colleges: 1
Here:
37.8%
Iowa:
23.9%
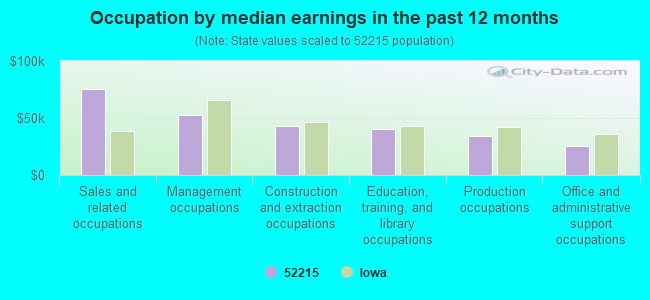
Occupation by median earnings in the past 12 months ($)
75,024Sales and related occupations
52,597Management occupations
42,572Construction and extraction occupations
40,717Education, training, and library occupations
34,511Production occupations
25,408Office and administrative support occupations
Top industries in this zip code by the number of employees in 2005:
Accommodation and Food Services: Full-Service Restaurants (1-4 employees: 1 establishment)
Wholesale Trade: Grain and Field Bean Merchant Wholesalers (1-4: 1)
Other Services (except Public Administration): Religious Organizations (1-4: 1)
Finance and Insurance: Commercial Banking (1-4: 1)
Construction: Site Preparation Contractors (1-4: 1)
Finance and Insurance: Insurance Agencies and Brokerages (1-4: 1)
Accommodation and Food Services: Drinking Places (Alcoholic Beverages) (1-4: 1)
Fatal accident statistics in 2014:
Fatal accident count: 1
Vehicles involved in fatal accidents: 1
Fatal accidents caused by drunken drivers: 1
Fatalities: 1
Persons involved in fatal accidents: 2
Pedestrians involved in fatal accidents: 0
Fatal accident statistics in 2011:
Fatal accident count: 1
Vehicles involved in fatal accidents: 2
Fatal accidents caused by drunken drivers: 0
Fatalities: 1
Persons involved in fatal accidents: 4
Pedestrians involved in fatal accidents: 0
Most common first names in zip code 52215 among deceased individuals
Name
Count
Lived (average)
Joseph
15
80.9 years
William
13
76.0 years
Frank
13
78.4 years
Charles
11
81.5 years
John
10
78.4 years
Emma
9
84.5 years
Mary
9
84.9 years
Edward
8
79.5 years
Agnes
7
89.4 years
George
7
80.9 years
Most common last names in zip code 52215 among deceased individuals
Last name
Count
Lived (average)
Behounek
13
82.2 years
Musel
9
79.4 years
Zeman
8
78.2 years
Johnston
7
82.5 years
Novak
7
81.3 years
Benda
7
85.7 years
Fetter
6
74.4 years
Upah
6
80.5 years
Kasal
6
74.0 years
Smith
5
78.8 years
Discuss Chelsea, Iowa (IA) on our hugely popular Iowa forum.


 Nearest zip codes: 52348, 52225, 52232, 52208, 52211, 52217.