Estimated zip code population in 2022: 1,170 Zip code population in 2010: 1,208 Zip code population in 2000: 1,254
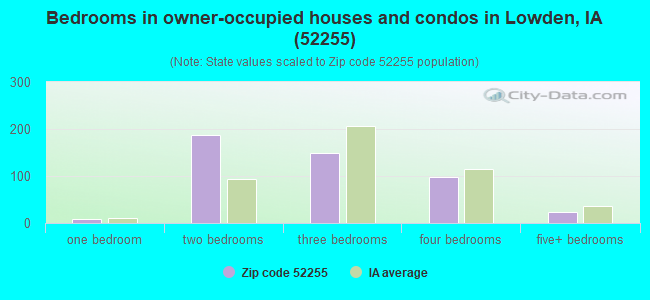
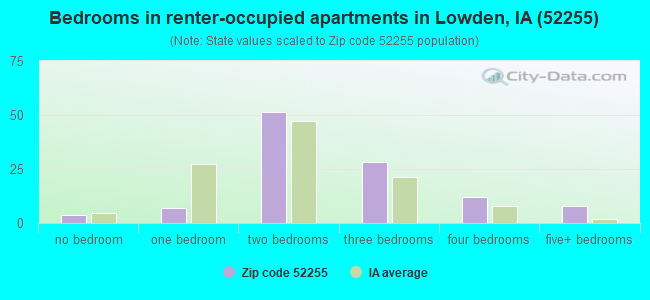
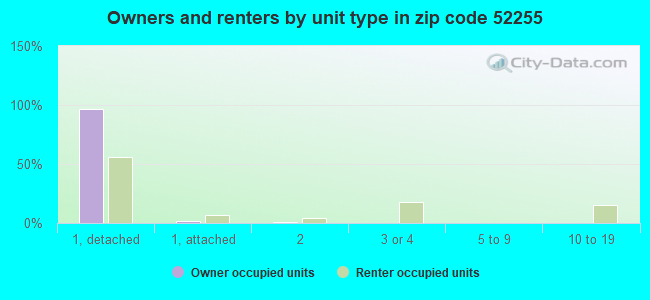
Houses and condos: 603 Renter-occupied apartments: 110
% of renters here:
19%
State:
28%
March 2022 cost of living index in zip code 52255: 83.2 (low, U.S. average is 100)
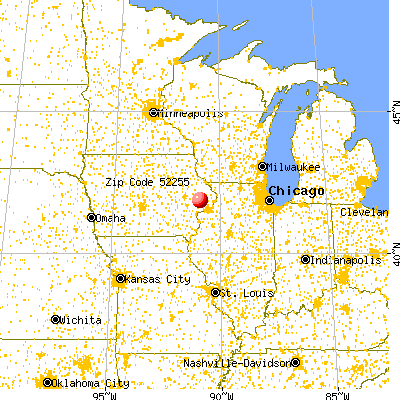
Land area: 43.4 sq. mi. Water area: 0.0 sq. mi.
Population density: 27 people per square mile
(very low).
OSM Map
General Map
Google Map
MSN Map
OSM Map
General Map
Google Map
MSN Map
OSM Map
General Map
Google Map
MSN Map
OSM Map
General Map
Google Map
MSN Map
Please wait while loading the map...
Real estate property taxes paid for housing units in 2022:
This zip code:
1.4% ($2,064)
Iowa:
1.4% ($2,724)
Median real estate property taxes paid for housing units with mortgages in 2022: $1,701 (1.4%) Median real estate property taxes paid for housing units with no mortgage in 2022: $2,301 (1.4%)
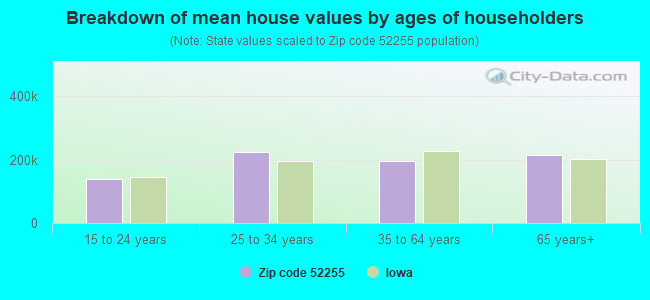
Estimated median house/condo value in 2022: $147,772
52255:
$147,772
Iowa:
$194,600
According to our research of Iowa and other state lists, there were 3 registered sex offenders living in 52255 zip code as of May 29, 2024. The ratio of all residents to sex offenders in zip code 52255 is 452 to 1. The ratio of registered sex offenders to all residents in this zip code is near the state average.
Median resident age:
This zip code:
41.8 years
Iowa median age:
38.9 years
Average household size:
This zip code:
2.0 people
Iowa:
2.3 people
Averages for the 2020 tax year for zip code 52255, filed in 2021:
Average Adjusted Gross Income (AGI) in 2020: $61,184 (Individual Income Tax Returns)
Here:
$61,184
State:
$71,087
Salary/wage: $48,755 (reported on 82.5% of returns)
Here:
$48,755
State:
$57,361
(% of AGI for various income ranges: 1185.8% for AGIs below $25k, 3619.0% for AGIs $25k-50k, 6711.4% for AGIs $50k-75k, 9520.0% for AGIs $75k-100k, 16830.0% for AGIs $100k-200k)
Taxable interest for individuals: $1,291 (reported on 38.6% of returns)
This zip code:
$1,291
Iowa:
$1,633
(% of AGI for various income ranges: 16.7% for AGIs below $25k, 92.0% for AGIs $25k-50k, 62.9% for AGIs $50k-75k, 76.0% for AGIs $75k-100k, 180.0% for AGIs $100k-200k)
Ordinary dividends: $3,182 (reported on 19.3% of returns)
Here:
$3,182
State:
$5,432
(% of AGI for various income ranges: 66.0% for AGIs $25k-50k, 161.4% for AGIs $50k-75k, 342.0% for AGIs $100k-200k)
Net capital gain/loss in AGI: +$6,570 (reported on 17.5% of returns)
Here:
+$6,570
State:
+$15,243
(% of AGI for various income ranges: 60.8% for AGIs below $25k, 278.6% for AGIs $50k-75k, 778.0% for AGIs $100k-200k)
Profit/loss from business: +$8,757 (reported on 12.3% of returns)
Here:
+$8,757
State:
+$11,763
(% of AGI for various income ranges: 357.0% for AGIs $25k-50k, 512.0% for AGIs $75k-100k)
Taxable individual retirement arrangement distribution: $9,800 (reported on 12.3% of returns)
52255:
$9,800
Iowa:
$17,324
(% of AGI for various income ranges: 181.7% for AGIs below $25k, 668.6% for AGIs $50k-75k)
Total itemized deductions: $28,333 (reported on 5.3% of returns)
Here:
$28,333
State:
$33,775
(% of AGI for various income ranges: 1214.3% for AGIs $50k-75k)
Earned income credit: $2,257 (reported on 12.3% of returns)
Here:
$2,257
State:
$2,195
(% of AGI for various income ranges: 80.0% for AGIs below $25k, 62.0% for AGIs $25k-50k)
Percentage of individuals using paid preparers for their 2020 taxes: 98.2%
Here:
98%
State:
95%
(% for various income ranges: 100.0% for AGIs below $25k, 100.0% for AGIs $25k-50k, 100.0% for AGIs $50k-75k, 100.0% for AGIs $75k-100k, 90.0% for AGIs $100k-200k)
Averages for the 2012 tax year for zip code 52255, filed in 2013:
Average Adjusted Gross Income (AGI) in 2012: $53,753 (Individual Income Tax Returns)
Here:
$53,753
State:
$58,860
Salary/wage: $42,464 (reported on 80.0% of returns)
Here:
$42,464
State:
$46,659
(% of AGI for various income ranges: 72.7% for AGIs below $25k, 70.2% for AGIs $25k-50k, 70.8% for AGIs $50k-75k, 77.9% for AGIs $75k-100k, 46.0% for AGIs $100k-200k)
Taxable interest for individuals: $1,271 (reported on 50.9% of returns)
This zip code:
$1,271
Iowa:
$1,537
(% of AGI for various income ranges: 2.6% for AGIs below $25k, 1.5% for AGIs $25k-50k, 2.1% for AGIs $50k-75k, 0.4% for AGIs $75k-100k, 0.8% for AGIs $100k-200k)
Ordinary dividends: $1,858 (reported on 21.8% of returns)
Here:
$1,858
State:
$4,542
(% of AGI for various income ranges: 1.4% for AGIs below $25k, 1.4% for AGIs $25k-50k, 0.8% for AGIs $50k-75k, 0.7% for AGIs $100k-200k)
Net capital gain/loss in AGI: +$10,688 (reported on 14.5% of returns)
Here:
+$10,688
State:
+$11,802
(% of AGI for various income ranges: 0.4% for AGIs $25k-50k, 1.2% for AGIs $50k-75k, 7.2% for AGIs $100k-200k)
Profit/loss from business: +$6,757 (reported on 12.7% of returns)
Here:
+$6,757
State:
+$10,509
(% of AGI for various income ranges: 5.8% for AGIs below $25k, 3.5% for AGIs $25k-50k, 2.8% for AGIs $50k-75k)
Taxable individual retirement arrangement distribution: $8,614 (reported on 12.7% of returns)
52255:
$8,614
Iowa:
$11,773
Total itemized deductions: $20,492 (21% of AGI, reported on 23.6% of returns)
Here:
$20,492
State:
$21,278
Here:
21.1% of AGI
State:
18.9% of AGI
(% of AGI for various income ranges: 12.3% for AGIs $25k-50k, 10.9% for AGIs $50k-75k, 7.6% for AGIs $75k-100k, 9.0% for AGIs $100k-200k)
Charity contributions: $2,300 (reported on 18.2% of returns)
Here:
$2,300
State:
$4,044
(% of AGI for various income ranges: 0.6% for AGIs $25k-50k, 1.2% for AGIs $50k-75k, 0.7% for AGIs $75k-100k, 0.9% for AGIs $100k-200k)
Taxes paid: $7,885 (reported on 23.6% of returns)
52255:
$7,885
State:
$8,846
(% of AGI for various income ranges: 2.0% for AGIs $25k-50k, 3.1% for AGIs $50k-75k, 2.6% for AGIs $75k-100k, 5.6% for AGIs $100k-200k)
Earned income credit: $2,300 (reported on 14.5% of returns)
Here:
$2,300
State:
$2,098
(% of AGI for various income ranges: 6.1% for AGIs below $25k, 0.8% for AGIs $25k-50k)
Percentage of individuals using paid preparers for their 2012 taxes: 69.1%
Here:
69%
State:
65%
(% for various income ranges: 61.1% for AGIs below $25k, 73.3% for AGIs $25k-50k, 75.0% for AGIs $50k-75k, 71.4% for AGIs $75k-100k, 71.4% for AGIs $100k-200k)
Averages for the 2004 tax year for zip code 52255, filed in 2005:
Average Adjusted Gross Income (AGI) in 2004: $36,821 (Individual Income Tax Returns)
Here:
$36,821
State:
$43,875
Salary/wage: $33,662 (reported on 81.0% of returns)
Here:
$33,662
State:
$38,265
(% of AGI for various income ranges: 185.3% for AGIs below $10k, 68.9% for AGIs $10k-25k, 71.6% for AGIs $25k-50k, 84.3% for AGIs $50k-75k, 81.6% for AGIs $75k-100k, 45.0% for AGIs over 100k)
Taxable interest for individuals: $2,209 (reported on 54.7% of returns)
This zip code:
$2,209
Iowa:
$1,768
(% of AGI for various income ranges: 22.7% for AGIs below $10k, 10.3% for AGIs $10k-25k, 2.9% for AGIs $25k-50k, 0.7% for AGIs $50k-75k, 1.0% for AGIs $75k-100k, 3.9% for AGIs over 100k)
Taxable dividends: $1,255 (reported on 28.8% of returns)
Here:
$1,255
State:
$2,510
(% of AGI for various income ranges: 4.0% for AGIs below $10k, 1.6% for AGIs $10k-25k, 1.3% for AGIs $25k-50k, 0.1% for AGIs $50k-75k, 0.4% for AGIs $75k-100k, 1.9% for AGIs over 100k)
Net capital gain/loss: +$2,483 (reported on 25.6% of returns)
Here:
+$2,483
State:
+$6,139
(% of AGI for various income ranges: 5.8% for AGIs below $10k, 1.3% for AGIs $10k-25k, 1.5% for AGIs $25k-50k, 0.1% for AGIs $50k-75k, 5.5% for AGIs $75k-100k)
Profit/loss from business: +$2,489 (reported on 16.8% of returns)
Here:
+$2,489
State:
+$8,574
(% of AGI for various income ranges: -5.8% for AGIs below $10k, 1.7% for AGIs $10k-25k, 3.0% for AGIs $25k-50k, 0.4% for AGIs $50k-75k, 0.3% for AGIs $75k-100k)
Total itemized deductions: $13,500 (24% of AGI, reported on 27.2% of returns)
Here:
$13,500
State:
$16,976
Here:
23.6% of AGI
State:
20.8% of AGI
(% of AGI for various income ranges: 13.5% for AGIs $10k-25k, 10.1% for AGIs $25k-50k, 9.2% for AGIs $50k-75k, 10.2% for AGIs $75k-100k, 8.4% for AGIs over 100k)
Charity contributions deductions: $1,650 (3% of AGI, reported on 21.5% of returns)
Here:
$1,650
State:
$3,089
Here:
2.7% of AGI
State:
3.6% of AGI
(% of AGI for various income ranges: 1.0% for AGIs $10k-25k, 0.6% for AGIs $25k-50k, 0.8% for AGIs $50k-75k, 1.6% for AGIs $75k-100k, 1.2% for AGIs over 100k)
Total tax: $4,200 (reported on 74.4% of returns)
52255:
$4,200
State:
$6,177
(% of AGI for various income ranges: 5.3% for AGIs below $10k, 4.1% for AGIs $10k-25k, 6.8% for AGIs $25k-50k, 8.3% for AGIs $50k-75k, 10.5% for AGIs $75k-100k, 13.8% for AGIs over 100k)
Earned income credit: $1,583 (reported on 10.7% of returns)
Here:
$1,583
State:
$1,540
Percentage of individuals using paid preparers for their 2004 taxes: 77.3%
Here:
77%
State:
70%
(% for various income ranges: 67.3% for AGIs below $10k, 77.4% for AGIs $10k-25k, 79.6% for AGIs $25k-50k, 82.6% for AGIs $50k-75k, 75.0% for AGIs $75k-100k, 94.1% for AGIs over 100k)
Household received Food Stamps/SNAP in the past 12 months: 23 Household did not receive Food Stamps/SNAP in the past 12 months: 551
Women who had a birth in the past 12 months: 6 (0 now married, 5 unmarried) Women who did not have a birth in the past 12 months: 251 (132 now married, 119 unmarried)
Housing units in zip code 52255 with a mortgage: 237 (6 second mortgage, 1 both second mortgage and home equity loan) Houses without a mortgage: 7
Median monthly owner costs for units with a mortgage: $1,258 Median monthly owner costs for units without a mortgage: $508
Residents with income below the poverty level in 2022:
This zip code:
14.7%
Whole state:
11.0%
Residents with income below 50% of the poverty level in 2022:
This zip code:
11.9%
Whole state:
5.5%
Median number of rooms in houses and condos:
Here:
6.0
State:
6.8
Median number of rooms in apartments:
Here:
4.8
State:
4.2
Notable locations in this zip code not listed on our city pages
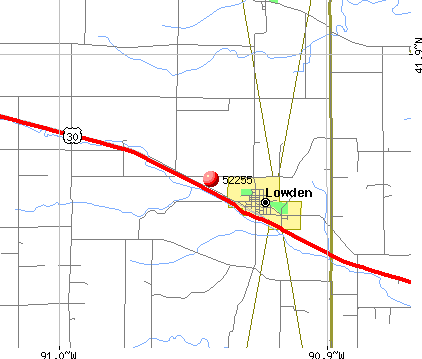
Notable locations in zip code 52255: Lowden (A), Three-Thirty Golf and Country Club (B), Lowden Fire Department (C), Lowden Public Library (D), Lowden Emergency Rescue (E), First Brick House (F). Display/hide their locations on the map
Churches in zip code 52255 include: Trinity Lutheran Church (A), Zion United Church of Christ (B), Diamond Community Church (C). Display/hide their locations on the map
Cemeteries: Saint Johns Cemetery (1), Center Cemetery (2), Zion Church Cemetery (3), Fairview Cemetery (4), Van Horn Cemetery (5), Lowden Cemetery (6), Elliott Parr Grave (7). Display/hide their locations on the map
Size of family households: 169 2-persons, 89 3-persons, 43 4-persons, 12 5-persons, 12 6-persons, 2 7-or-more-persons
Size of nonfamily households: 228 1-person, 16 2-persons
154 married couples with children.
87 single-parent households (14 men, 73 women).
99.7% of residents of 52255 zip code speak English at home.
0.2% of residents speak other Indo-European language at home (100% very well).
Foreign born population: 0 (0.0%)
:
0.0%
Whole state:
6.0%
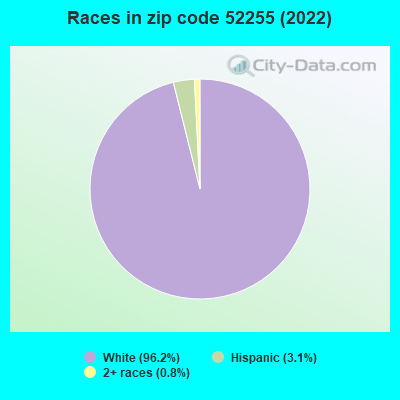
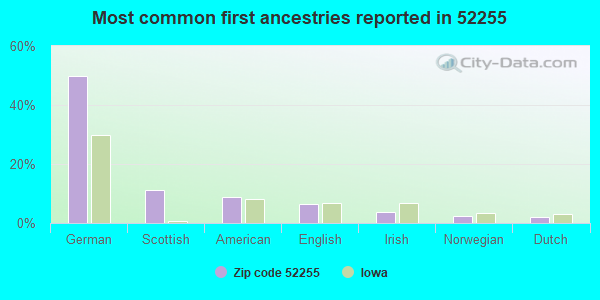
50%German
11%Scottish
9%American
6%English
4%Irish
2%Norwegian
2%Dutch
Year of entry for the foreign-born population
02010 or later
02000 to 2009
11990 to 1999
0Before 1990
Facilities with environmental interests located in this zip code:
NORTH CEDAR LOWDEN ELEMENTARY CENTER (703 PARK AVENUE in LOWDEN, IA)
(National Center for Education Statistics) - STATE ID-163691 405 Organizations: NORTH CEDAR COMM SCHOOL DISTRICT (SCHOOL DISTRICT)
AT&T (RR in LOWDEN, IA)
(Resource Conservation and Recovery Act (tracking hazardous waste))
STRACKBEINS INC (2157 OLD LINCOLN HWY in LOWDEN, IA)
Conditionally Exempt Small Quantity Generators, less than 100 kg/month of hazardous waste (Resource Conservation and Recovery Act (tracking hazardous waste))
Housing units lacking complete kitchen facilities: 1.4%
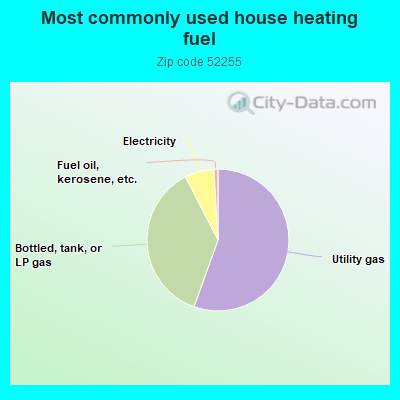
55.6%Utility gas
37.0%Bottled, tank, or LP gas
6.7%Electricity
0.9%Fuel oil, kerosene, etc.
Population in 1990: 1,488.
Place of birth for U.S.-born residents:
This state: 968
Northeast: 20
Midwest: 117
South: 24
West: 36
68% of the 52255 zip code residents lived in the same house 5 years ago. Out of people who lived in different houses, 38% lived in this county. Out of people who lived in different counties, 50% lived in Iowa.
98% of the 52255 zip code residents lived in the same house 1 year ago. Out of people who lived in different houses, 86% moved from this county. Out of people who lived in different houses, 24% moved from different county within same state.
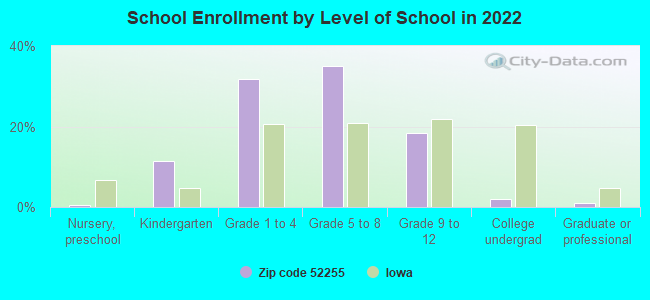
Private vs. public school enrollment:
Students in private schools in grades 1 to 8 (elementary and middle school): 4
Here:
3.1%
Iowa:
10.6%
Students in private schools in grades 9 to 12 (high school): 2
Here:
5.1%
Iowa:
7.9%
Students in private undergraduate colleges:
Here:
0.0%
Iowa:
23.9%
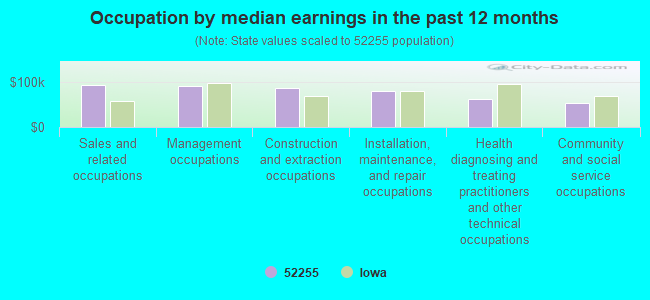
Occupation by median earnings in the past 12 months ($)
93,945Sales and related occupations
91,975Management occupations
86,009Construction and extraction occupations
80,132Installation, maintenance, and repair occupations
62,694Health diagnosing and treating practitioners and other technical occupations
52,488Community and social service occupations
Top industries in this zip code by the number of employees in 2005:
Professional, Scientific, and Technical Services: Offices of Lawyers (10-19: 1)
Wholesale Trade: Farm and Garden Machinery and Equipment Merchant Wholesalers (10-19: 1)
Finance and Insurance: Commercial Banking (10-19: 1)
Construction: Plumbing, Heating, and Air-Conditioning Contractors (5-9: 1)
Other Services (except Public Administration): Civic and Social Organizations (5-9: 1)
Health Care and Social Assistance: Child Day Care Services (5-9: 1)
Other Services (except Public Administration): Religious Organizations (5-9: 1)
Fatal accident statistics in 2013:
Fatal accident count: 1
Vehicles involved in fatal accidents: 2
Fatal accidents caused by drunken drivers: 0
Fatalities: 1
Persons involved in fatal accidents: 2
Pedestrians involved in fatal accidents: 0
Fatal accident statistics in 2011:
Fatal accident count: 1
Vehicles involved in fatal accidents: 1
Fatal accidents caused by drunken drivers: 0
Fatalities: 1
Persons involved in fatal accidents: 2
Pedestrians involved in fatal accidents: 0
2003 - 2018 National Fire Incident Reporting System (NFIRS) incidents
Based on the data from the years 2003 - 2018 the average number of fire incidents per year is 11. The highest number of fire incidents - 31 took place in 2009, and the least - 0 in 2015. The data has a decreasing trend.
When looking into fire subcategories, the most reports belonged to: Outside Fires (56.3%), and Structure Fires (27.3%).
Fire incident types reported to NFIRS in Zip Code 52255


 Nearest zip codes: 52216, 52777, 52721, 52323, 52765, 52337.
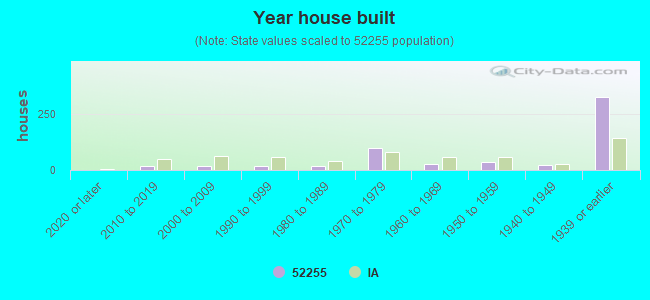


 Based on the data from the years 2003 - 2018 the average number of fire incidents per year is 11. The highest number of fire incidents - 31 took place in 2009, and the least - 0 in 2015. The data has a decreasing trend.
 When looking into fire subcategories, the most reports belonged to: Outside Fires (56.3%), and Structure Fires (27.3%).