Estimated zip code population in 2022: 2,972 Zip code population in 2010: 2,826 Zip code population in 2000: 1,281
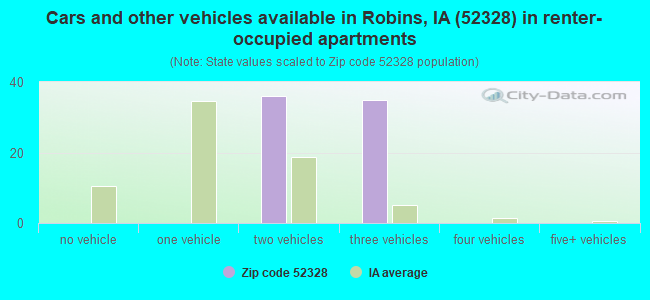
Houses and condos: 1,031 Renter-occupied apartments: 72
% of renters here:
7%
State:
28%
March 2022 cost of living index in zip code 52328: 87.4 (less than average, U.S. average is 100)
Land area: 3.1 sq. mi. Water area: 0.0 sq. mi.
Population density: 963 people per square mile
(low).
OSM Map
General Map
Google Map
MSN Map
OSM Map
General Map
Google Map
MSN Map
OSM Map
General Map
Google Map
MSN Map
OSM Map
General Map
Google Map
MSN Map
Please wait while loading the map...
Real estate property taxes paid for housing units in 2022:
This zip code:
1.4% ($4,730)
Iowa:
1.4% ($2,724)
Median real estate property taxes paid for housing units with mortgages in 2022: $4,910 (1.3%) Median real estate property taxes paid for housing units with no mortgage in 2022: $4,409 (1.4%)
Business Search- 14 Million verified businesses
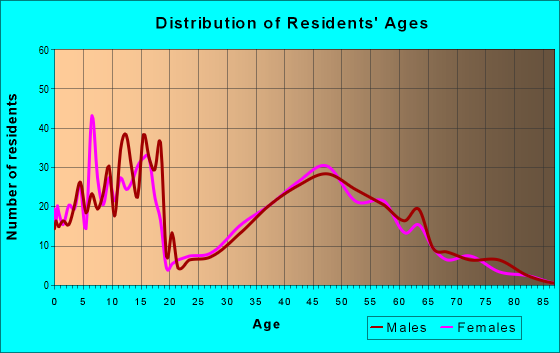
Males: 1,494
(50.3%)
Females: 1,478
(49.7%)
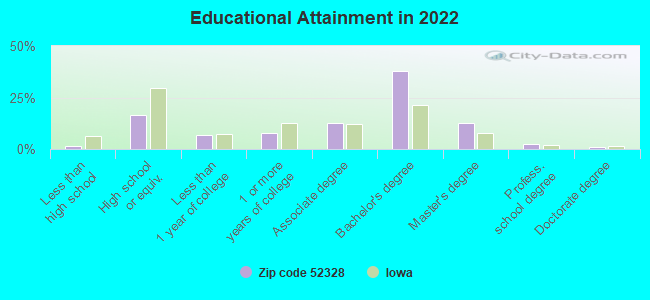
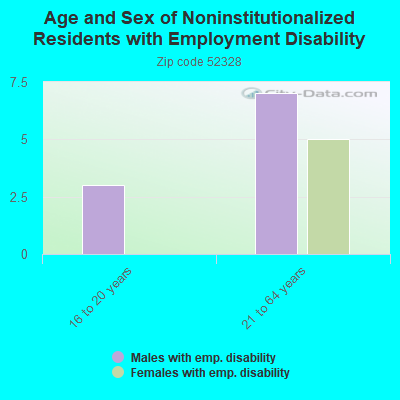
For population 25 years and over in 52328:
High school or higher: 101.4%
Bachelor's degree or higher: 55.9%
Graduate or professional degree: 17.0%
Unemployed: 6.0%
Mean travel time to work (commute): 18.6 minutes
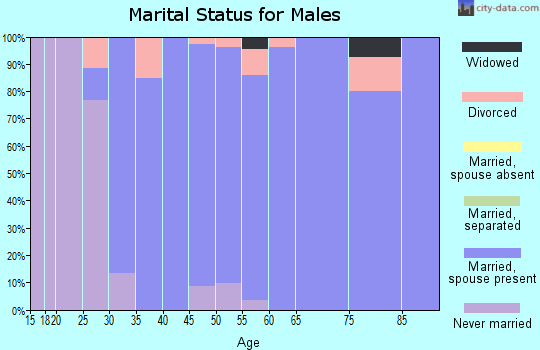
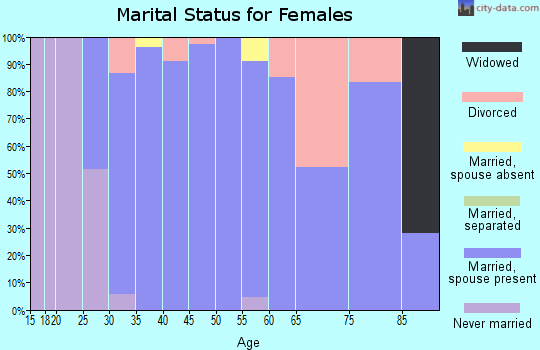
For population 15 years and over in 52328:
Never married: 21.1%
Now married: 67.1%
Separated: 1.6%
Widowed: 2.6%
Divorced: 7.5%
Zip code 52328 compared to state average:
Median household income above state average.
Median house value above state average.
Unemployed percentage above state average.
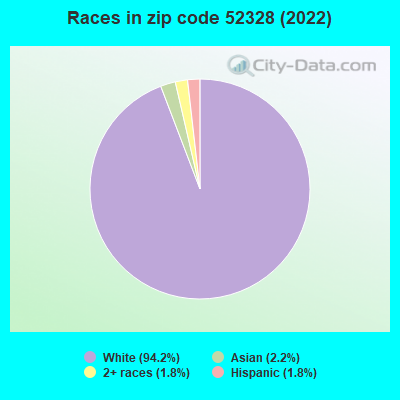
Black race population percentage significantly below state average.
Hispanic race population percentage significantly below state average.
Median age above state average.
Foreign-born population percentage significantly below state average.
Renting percentage significantly below state average.
Length of stay since moving in significantly above state average.
Number of rooms per house above state average.
House age significantly below state average.
Percentage of population with a bachelor's degree or higher above state average.
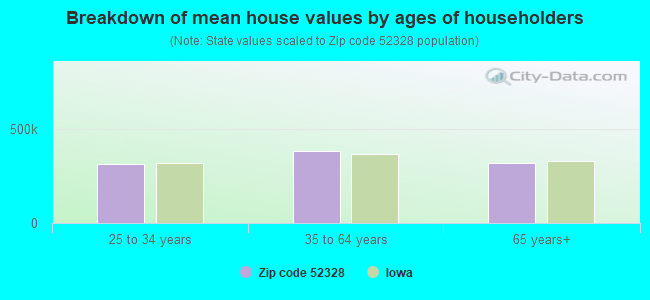
Estimated median house/condo value in 2022: $348,694
52328:
$348,694
Iowa:
$194,600
According to our research of Iowa and other state lists, there was 1 registered sex offender living in 52328 zip code as of May 13, 2024. The ratio of all residents to sex offenders in zip code 52328 is 2,936 to 1. The ratio of registered sex offenders to all residents in this zip code is much lower than the state average.
Median resident age:
This zip code:
44.5 years
Iowa median age:
38.9 years
Average household size:
This zip code:
2.8 people
Iowa:
2.3 people
Averages for the 2020 tax year for zip code 52328, filed in 2021:
Average Adjusted Gross Income (AGI) in 2020: $125,905 (Individual Income Tax Returns)
Here:
$125,905
State:
$71,087
Salary/wage: $102,743 (reported on 81.6% of returns)
Here:
$102,743
State:
$57,361
(% of AGI for various income ranges: 1172.0% for AGIs below $25k, 2746.7% for AGIs $25k-50k, 4895.0% for AGIs $50k-75k, 7867.0% for AGIs $75k-100k, 18995.0% for AGIs $100k-200k, 58323.0% for AGIs over 200k)
Taxable interest for individuals: $2,054 (reported on 64.6% of returns)
This zip code:
$2,054
Iowa:
$1,633
(% of AGI for various income ranges: 15.0% for AGIs below $25k, 120.0% for AGIs $25k-50k, 190.0% for AGIs $50k-75k, 149.0% for AGIs $75k-100k, 271.2% for AGIs $100k-200k, 749.0% for AGIs over 200k)
Ordinary dividends: $6,897 (reported on 41.5% of returns)
Here:
$6,897
State:
$5,432
(% of AGI for various income ranges: 44.5% for AGIs below $25k, 123.3% for AGIs $25k-50k, 155.0% for AGIs $50k-75k, 300.0% for AGIs $75k-100k, 385.0% for AGIs $100k-200k, 2560.0% for AGIs over 200k)
Net capital gain/loss in AGI: +$15,305 (reported on 40.1% of returns)
Here:
+$15,305
State:
+$15,243
(% of AGI for various income ranges: 21.0% for AGIs below $25k, 52.5% for AGIs $25k-50k, 249.2% for AGIs $50k-75k, 282.0% for AGIs $75k-100k, 476.7% for AGIs $100k-200k, 7200.0% for AGIs over 200k)
Profit/loss from business: +$14,787 (reported on 15.6% of returns)
Here:
+$14,787
State:
+$11,763
(% of AGI for various income ranges: 43.0% for AGIs below $25k, 170.8% for AGIs $50k-75k, 543.0% for AGIs $75k-100k, 469.2% for AGIs $100k-200k, 1441.0% for AGIs over 200k)
Taxable individual retirement arrangement distribution: $26,830 (reported on 18.4% of returns)
52328:
$26,830
Iowa:
$17,324
(% of AGI for various income ranges: 434.2% for AGIs $25k-50k, 472.5% for AGIs $50k-75k, 1061.0% for AGIs $75k-100k, 1208.3% for AGIs $100k-200k, 2195.0% for AGIs over 200k)
Self-employed (Keogh) retirement plans: $21,800 (reported on 1.4% of returns)
52328:
$21,800
Iowa:
$22,144
(% of AGI for various income ranges: 181.7% for AGIs $100k-200k)
Total itemized deductions: $33,018 (reported on 23.1% of returns)
Here:
$33,018
State:
$33,775
(% of AGI for various income ranges: 497.5% for AGIs below $25k, 1151.7% for AGIs $50k-75k, 1170.0% for AGIs $75k-100k, 1572.9% for AGIs $100k-200k, 3904.0% for AGIs over 200k)
Charity contributions: $12,567 (reported on 12.2% of returns)
Here:
$12,567
State:
$13,075
(% of AGI for various income ranges: 220.8% for AGIs $50k-75k, 197.1% for AGIs $100k-200k, 1524.0% for AGIs over 200k)
Taxes paid: $8,405 (reported on 13.6% of returns)
52328:
$8,405
State:
$7,704
(% of AGI for various income ranges: 175.8% for AGIs $50k-75k, 131.0% for AGIs $75k-100k, 241.7% for AGIs $100k-200k, 759.0% for AGIs over 200k)
Earned income credit: $1,600 (reported on 3.4% of returns)
Here:
$1,600
State:
$2,195
(% of AGI for various income ranges: 40.0% for AGIs below $25k)
Percentage of individuals using paid preparers for their 2020 taxes: 93.2%
Here:
93%
State:
95%
(% for various income ranges: 87.1% for AGIs below $25k, 93.8% for AGIs $25k-50k, 93.8% for AGIs $50k-75k, 93.8% for AGIs $75k-100k, 95.3% for AGIs $100k-200k, 96.0% for AGIs over 200k)
Averages for the 2012 tax year for zip code 52328, filed in 2013:
Average Adjusted Gross Income (AGI) in 2012: $112,466 (Individual Income Tax Returns)
Here:
$112,466
State:
$58,860
Salary/wage: $86,311 (reported on 86.4% of returns)
Here:
$86,311
State:
$46,659
(% of AGI for various income ranges: 80.9% for AGIs below $25k, 65.8% for AGIs $25k-50k, 68.6% for AGIs $50k-75k, 68.6% for AGIs $75k-100k, 84.0% for AGIs $100k-200k, 48.4% for AGIs over 200k)
Taxable interest for individuals: $1,512 (reported on 65.2% of returns)
This zip code:
$1,512
Iowa:
$1,537
(% of AGI for various income ranges: 2.9% for AGIs below $25k, 1.3% for AGIs $25k-50k, 1.2% for AGIs $50k-75k, 0.9% for AGIs $75k-100k, 0.7% for AGIs $100k-200k, 0.9% for AGIs over 200k)
Ordinary dividends: $3,211 (reported on 42.4% of returns)
Here:
$3,211
State:
$4,542
(% of AGI for various income ranges: 1.8% for AGIs below $25k, 1.5% for AGIs $25k-50k, 1.5% for AGIs $50k-75k, 1.7% for AGIs $75k-100k, 1.1% for AGIs $100k-200k, 1.1% for AGIs over 200k)
Net capital gain/loss in AGI: +$19,734 (reported on 31.1% of returns)
Here:
+$19,734
State:
+$11,802
(% of AGI for various income ranges: 0.2% for AGIs $75k-100k, 1.8% for AGIs $100k-200k, 11.6% for AGIs over 200k)
Profit/loss from business: +$14,500 (reported on 13.6% of returns)
Here:
+$14,500
State:
+$10,509
(% of AGI for various income ranges: 12.4% for AGIs below $25k, 2.7% for AGIs $50k-75k, 2.4% for AGIs $75k-100k, 2.9% for AGIs $100k-200k)
Taxable individual retirement arrangement distribution: $14,553 (reported on 12.9% of returns)
52328:
$14,553
Iowa:
$11,773
(% of AGI for various income ranges: 6.3% for AGIs $25k-50k, 4.2% for AGIs $50k-75k, 5.3% for AGIs $75k-100k, 1.9% for AGIs $100k-200k)
Self-employment retirement plans: $17,000 (reported on 1.5% of returns)
52328:
$17,000
Iowa:
$18,614
(% of AGI for various income ranges: 6.6% for AGIs $25k-50k)
Total itemized deductions: $26,850 (16% of AGI, reported on 57.6% of returns)
Here:
$26,850
State:
$21,278
Here:
15.9% of AGI
State:
18.9% of AGI
(% of AGI for various income ranges: 13.9% for AGIs below $25k, 10.9% for AGIs $25k-50k, 15.5% for AGIs $50k-75k, 14.7% for AGIs $75k-100k, 16.2% for AGIs $100k-200k, 11.2% for AGIs over 200k)
Charity contributions: $4,525 (reported on 51.5% of returns)
Here:
$4,525
State:
$4,044
(% of AGI for various income ranges: 1.4% for AGIs $25k-50k, 1.8% for AGIs $50k-75k, 1.9% for AGIs $75k-100k, 2.6% for AGIs $100k-200k, 1.8% for AGIs over 200k)
Taxes paid: $13,813 (reported on 57.6% of returns)
52328:
$13,813
State:
$8,846
(% of AGI for various income ranges: 2.7% for AGIs below $25k, 3.2% for AGIs $25k-50k, 5.8% for AGIs $50k-75k, 5.8% for AGIs $75k-100k, 8.2% for AGIs $100k-200k, 7.1% for AGIs over 200k)
Earned income credit: $1,625 (reported on 3.0% of returns)
Here:
$1,625
State:
$2,098
(% of AGI for various income ranges: 2.1% for AGIs below $25k)
Percentage of individuals using paid preparers for their 2012 taxes: 50.0%
Here:
50%
State:
65%
(% for various income ranges: 38.2% for AGIs below $25k, 42.9% for AGIs $25k-50k, 64.3% for AGIs $50k-75k, 62.5% for AGIs $75k-100k, 48.8% for AGIs $100k-200k, 61.5% for AGIs over 200k)
Averages for the 2004 tax year for zip code 52328, filed in 2005:
Average Adjusted Gross Income (AGI) in 2004: $78,196 (Individual Income Tax Returns)
Here:
$78,196
State:
$43,875
Salary/wage: $66,853 (reported on 88.7% of returns)
Here:
$66,853
State:
$38,265
(% of AGI for various income ranges: 92.4% for AGIs below $10k, 64.6% for AGIs $10k-25k, 70.8% for AGIs $25k-50k, 81.4% for AGIs $50k-75k, 84.2% for AGIs $75k-100k, 72.5% for AGIs over 100k)
Taxable interest for individuals: $1,622 (reported on 72.9% of returns)
This zip code:
$1,622
Iowa:
$1,768
(% of AGI for various income ranges: 3.5% for AGIs below $10k, 4.4% for AGIs $10k-25k, 3.1% for AGIs $25k-50k, 2.1% for AGIs $50k-75k, 1.0% for AGIs $75k-100k, 1.2% for AGIs over 100k)
Taxable dividends: $1,163 (reported on 45.2% of returns)
Here:
$1,163
State:
$2,510
(% of AGI for various income ranges: 1.9% for AGIs below $10k, 1.3% for AGIs $10k-25k, 1.2% for AGIs $25k-50k, 1.0% for AGIs $50k-75k, 0.5% for AGIs $75k-100k, 0.5% for AGIs over 100k)
Net capital gain/loss: +$5,837 (reported on 36.4% of returns)
Here:
+$5,837
State:
+$6,139
(% of AGI for various income ranges: 1.3% for AGIs below $10k, 0.1% for AGIs $10k-25k, 1.0% for AGIs $25k-50k, -0.1% for AGIs $50k-75k, 0.3% for AGIs $75k-100k, 4.5% for AGIs over 100k)
Profit/loss from business: +$16,619 (reported on 15.1% of returns)
Here:
+$16,619
State:
+$8,574
(% of AGI for various income ranges: 4.6% for AGIs below $10k, 1.6% for AGIs $10k-25k, 0.8% for AGIs $25k-50k, 5.6% for AGIs $50k-75k, 1.9% for AGIs $75k-100k, 3.4% for AGIs over 100k)
IRA payment deduction: $2,000 (reported on 1.9% of returns)
52328:
$2,000
Iowa:
$2,970
Self-employed pension: $14,000 (reported on 1.0% of returns)
Here:
$14,000
Iowa:
$11,928
Total itemized deductions: $20,627 (19% of AGI, reported on 60.5% of returns)
Here:
$20,627
State:
$16,976
Here:
18.6% of AGI
State:
20.8% of AGI
(% of AGI for various income ranges: 23.8% for AGIs below $10k, 10.2% for AGIs $10k-25k, 19.4% for AGIs $25k-50k, 17.2% for AGIs $50k-75k, 17.2% for AGIs $75k-100k, 14.9% for AGIs over 100k)
Charity contributions deductions: $2,996 (3% of AGI, reported on 55.8% of returns)
Here:
$2,996
State:
$3,089
Here:
2.6% of AGI
State:
3.6% of AGI
(% of AGI for various income ranges: 2.2% for AGIs $25k-50k, 1.3% for AGIs $50k-75k, 2.5% for AGIs $75k-100k, 2.3% for AGIs over 100k)
Total tax: $12,043 (reported on 85.7% of returns)
52328:
$12,043
State:
$6,177
(% of AGI for various income ranges: 2.7% for AGIs below $10k, 4.5% for AGIs $10k-25k, 7.1% for AGIs $25k-50k, 8.1% for AGIs $50k-75k, 9.4% for AGIs $75k-100k, 16.8% for AGIs over 100k)
Earned income credit: $1,519 (reported on 2.8% of returns)
Here:
$1,519
State:
$1,540
Percentage of individuals using paid preparers for their 2004 taxes: 51.1%
Here:
51%
State:
70%
(% for various income ranges: 33.5% for AGIs below $10k, 50.5% for AGIs $10k-25k, 60.3% for AGIs $25k-50k, 57.0% for AGIs $50k-75k, 53.8% for AGIs $75k-100k, 52.8% for AGIs over 100k)
Likely homosexual households (counted as self-reported same-sex unmarried-partner households)
Lesbian couples: 0.0% of all households
Gay men: 0.3% of all households
Household received Food Stamps/SNAP in the past 12 months: 15 Household did not receive Food Stamps/SNAP in the past 12 months: 1,040
Women who had a birth in the past 12 months: 50 (30 now married, 19 unmarried) Women who did not have a birth in the past 12 months: 543 (238 now married, 304 unmarried)
Housing units in zip code 52328 with a mortgage: 642 (225 second mortgage, 183 both second mortgage and home equity loan) Houses without a mortgage: 15
Median monthly owner costs for units with a mortgage: $2,022 Median monthly owner costs for units without a mortgage: $685
Residents with income below the poverty level in 2022:
This zip code:
5.8%
Whole state:
11.0%
Residents with income below 50% of the poverty level in 2022:
This zip code:
4.4%
Whole state:
5.5%
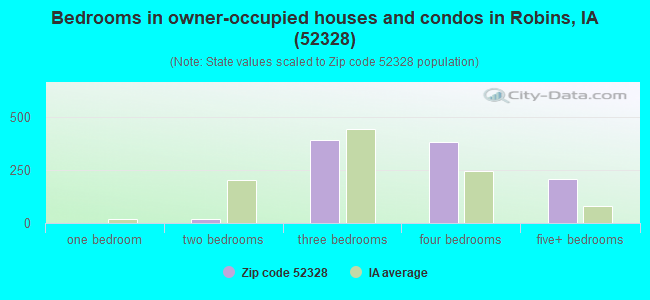
Median number of rooms in houses and condos:
Here:
8.1
State:
6.8
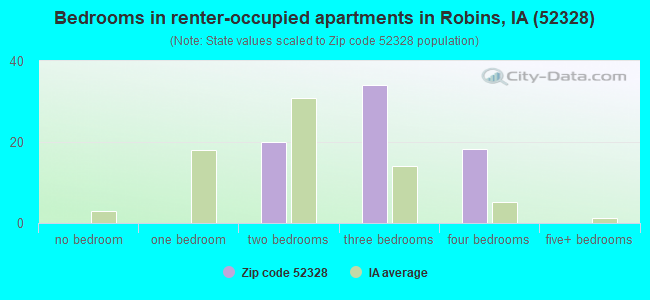
Median number of rooms in apartments:
Here:
6.0
State:
4.2
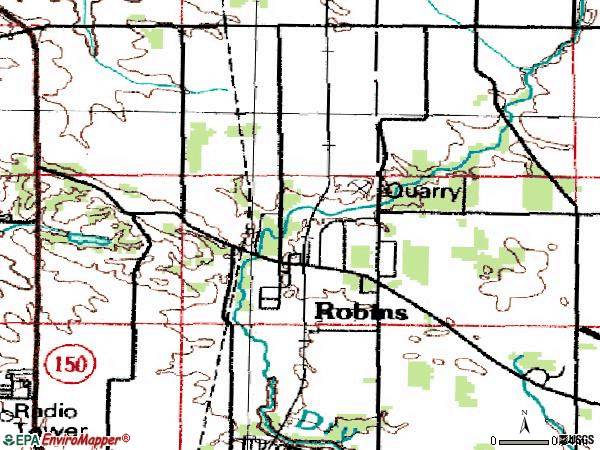
Notable locations in this zip code not listed on our city pages
Notable locations in zip code 52328: Robins Police Dapartment (A), Robins Fire Department (B), Robins Town Hall (C). Display/hide their locations on the map
Size of family households: 499 2-persons, 169 3-persons, 143 4-persons, 108 5-persons, 26 6-persons
Size of nonfamily households: 60 1-person, 13 2-persons, 18 3-persons
524 married couples with children.
251 single-parent households (146 men, 105 women).
98.3% of residents of 52328 zip code speak English at home.
0.2% of residents speak Spanish at home (86% very well, 14% not well).
0.1% of residents speak other Indo-European language at home (100% very well).
0.8% of residents speak Asian or Pacific Island language at home (77% very well, 23% well).
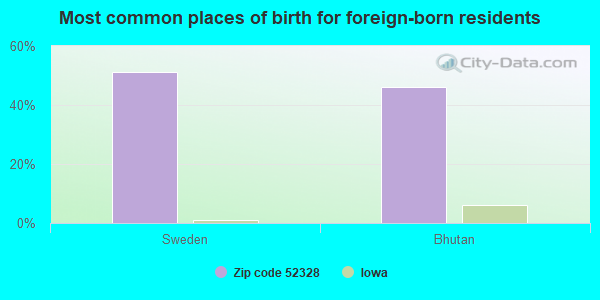
Foreign born population: 38 (1.3%) (0.0% of them are naturalized citizens)
:
1.3%
Whole state:
6.0%
51%Sweden
46%Bhutan
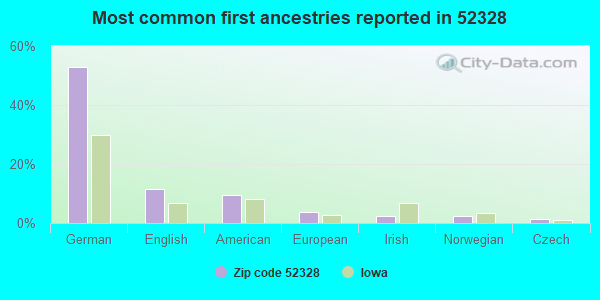
53%German
12%English
10%American
4%European
2%Irish
2%Norwegian
2%Czech
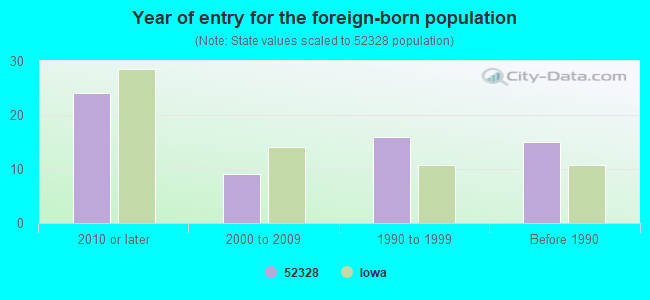
Year of entry for the foreign-born population
242010 or later
92000 to 2009
161990 to 1999
15Before 1990
Facilities with environmental interests located in this zip code:
ROBINS QUARRY (605 N. MENTZER ROAD in ROBINS, IA)
National Pollutant Discharge Elimination System NON-MAJOR (Tracking pollutant discharge elimination systems) - permit Business SIC classification: CRUSHED AND BROKEN LIMESTONE Organizations: WENDLING QUARRIES, INC. (CONTACT/OWNER)
Alternative names: WENDLING QUARRIES INC
ROBINS, CITY OF MS4 (265 SOUTH 2ND ST. in ROBINS, IA)
National Pollutant Discharge Elimination System NON-MAJOR (Tracking pollutant discharge elimination systems) - permit Alternative names: PALOMA OFFSHORE, LLC
Housing units lacking complete plumbing facilities: 0.6% Housing units lacking complete kitchen facilities: 0.6%
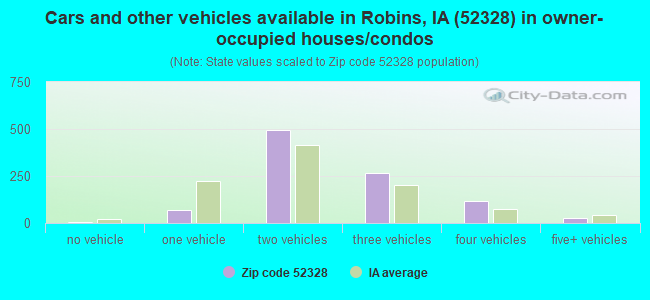
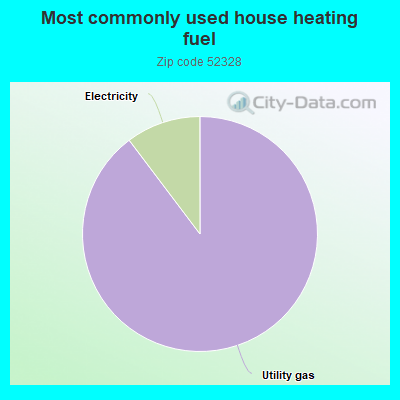
89.8%Utility gas
10.3%Electricity
Population in 1990: 877. Population change in the 1990s: +404 (+46.1%).
Place of birth for U.S.-born residents:
This state: 2,237
Northeast: 4
Midwest: 377
South: 158
West: 123
67% of the 52328 zip code residents lived in the same house 5 years ago. Out of people who lived in different houses, 81% lived in this county. Out of people who lived in different counties, 50% lived in Iowa.
95% of the 52328 zip code residents lived in the same house 1 year ago. Out of people who lived in different houses, 97% moved from this county. Out of people who lived in different houses, 2% moved from different state.
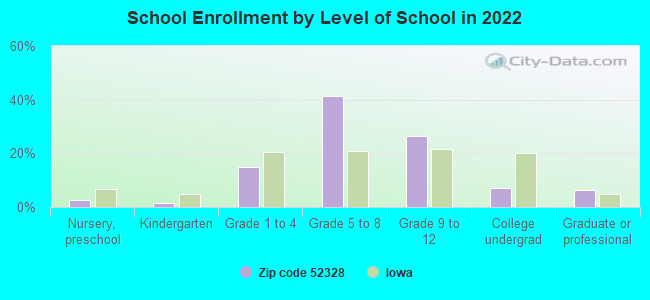
Private vs. public school enrollment:
Students in private schools in grades 1 to 8 (elementary and middle school): 75
Here:
16.5%
Iowa:
10.6%
Students in private schools in grades 9 to 12 (high school): 62
Here:
29.0%
Iowa:
7.9%
Students in private undergraduate colleges: 34
Here:
65.3%
Iowa:
23.9%
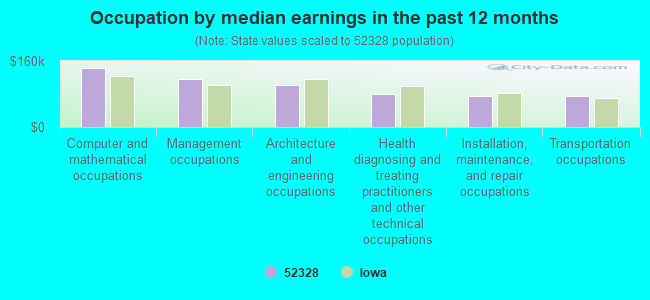
Occupation by median earnings in the past 12 months ($)
143,432Computer and mathematical occupations
116,259Management occupations
102,159Architecture and engineering occupations
79,583Health diagnosing and treating practitioners and other technical occupations
76,319Installation, maintenance, and repair occupations
76,319Transportation occupations
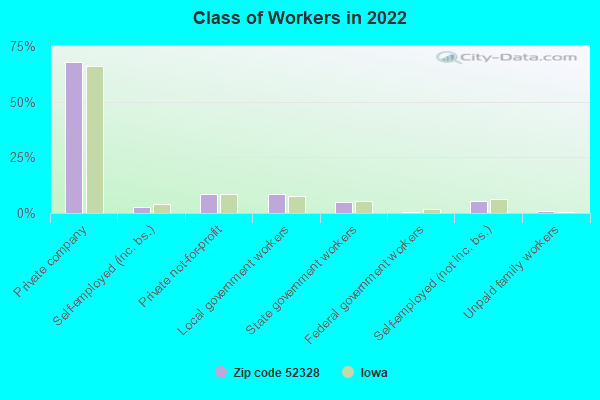
Top industries in this zip code by the number of employees in 2005:
Other Services (except Public Administration): Car Washes (50-99 employees: 1 establishment)
Health Care and Social Assistance: Child Day Care Services (20-49: 1)
Finance and Insurance: Commercial Banking (20-49: 1)
Other Services (except Public Administration): Labor Unions and Similar Labor Organizations (10-19: 1, 1-4: 1)
Construction: Plumbing, Heating, and Air-Conditioning Contractors (5-9: 1, 1-4: 1)
Administrative and Support and Waste Management and Remediation Services: Temporary Help Services (5-9: 1)
Real Estate and Rental and Leasing: Lessors of Residential Buildings and Dwellings (5-9: 1)
Accommodation and Food Services: Full-Service Restaurants (5-9: 1)
Home Mortgage Disclosure Act Aggregated Statistics For Year 2009 (Based on 2 partial tracts)
A) FHA, FSA/RHS & VA Home Purchase Loans
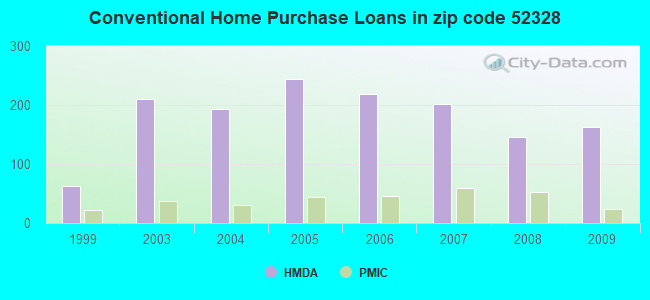
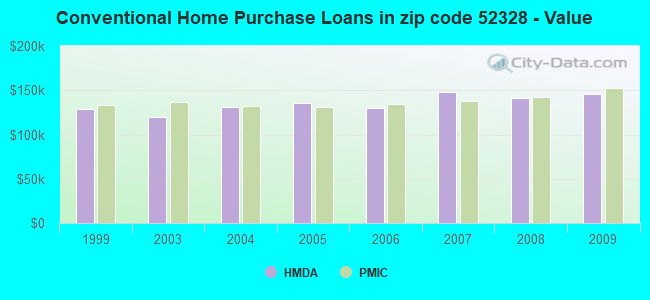
B) Conventional Home Purchase Loans
C) Refinancings
D) Home Improvement Loans
E) Loans on Dwellings For 5+ Families
F) Non-occupant Loans on < 5 Family Dwellings (A B C & D)
Number
Average Value
Number
Average Value
Number
Average Value
Number
Average Value
Number
Average Value
Number
Average Value
LOANS ORIGINATED
40
$150,865
162
$145,991
345
$172,121
10
$47,889
1
$285,400
8
$102,929
APPLICATIONS APPROVED, NOT ACCEPTED
3
$127,703
11
$179,516
29
$180,627
1
$145,920
0
$0
1
$59,780
APPLICATIONS DENIED
3
$144,843
6
$110,562
42
$182,601
2
$13,175
0
$0
1
$212,770
APPLICATIONS WITHDRAWN
3
$158,343
11
$145,390
42
$148,732
1
$77,140
0
$0
1
$50,780
FILES CLOSED FOR INCOMPLETENESS
0
$0
1
$118,280
10
$197,532
0
$0
0
$0
0
$0
Aggregated Statistics For Year 2008 (Based on 2 partial tracts)
A) FHA, FSA/RHS & VA Home Purchase Loans
B) Conventional Home Purchase Loans
C) Refinancings
D) Home Improvement Loans
E) Loans on Dwellings For 5+ Families
F) Non-occupant Loans on < 5 Family Dwellings (A B C & D)
G) Loans On Manufactured Home Dwelling (A B C & D)
Number
Average Value
Number
Average Value
Number
Average Value
Number
Average Value
Number
Average Value
Number
Average Value
Number
Average Value
LOANS ORIGINATED
17
$162,099
146
$141,302
129
$163,625
21
$35,997
1
$874,210
13
$115,408
2
$56,245
APPLICATIONS APPROVED, NOT ACCEPTED
1
$82,920
17
$161,608
15
$184,569
1
$9,640
1
$874,210
2
$116,670
0
$0
APPLICATIONS DENIED
3
$115,060
6
$180,627
37
$176,944
6
$92,670
0
$0
1
$86,140
1
$202,480
APPLICATIONS WITHDRAWN
2
$98,350
13
$159,711
22
$163,710
3
$217,693
0
$0
2
$134,345
0
$0
FILES CLOSED FOR INCOMPLETENESS
0
$0
1
$184,480
1
$154,270
0
$0
0
$0
0
$0
0
$0
Aggregated Statistics For Year 2007 (Based on 2 partial tracts)
A) FHA, FSA/RHS & VA Home Purchase Loans
B) Conventional Home Purchase Loans
C) Refinancings
D) Home Improvement Loans
E) Loans on Dwellings For 5+ Families
F) Non-occupant Loans on < 5 Family Dwellings (A B C & D)
G) Loans On Manufactured Home Dwelling (A B C & D)
Number
Average Value
Number
Average Value
Number
Average Value
Number
Average Value
Number
Average Value
Number
Average Value
Number
Average Value
LOANS ORIGINATED
8
$159,976
202
$147,685
103
$158,959
29
$43,489
1
$8,360
13
$125,890
0
$0
APPLICATIONS APPROVED, NOT ACCEPTED
1
$88,710
23
$141,332
24
$147,496
4
$39,372
0
$0
3
$93,850
1
$43,710
APPLICATIONS DENIED
1
$47,570
10
$101,370
49
$144,276
9
$33,569
0
$0
1
$68,140
1
$38,570
APPLICATIONS WITHDRAWN
0
$0
8
$157,406
26
$166,139
3
$76,280
0
$0
0
$0
0
$0
FILES CLOSED FOR INCOMPLETENESS
0
$0
0
$0
12
$137,827
1
$115,060
0
$0
0
$0
0
$0
Aggregated Statistics For Year 2006 (Based on 2 partial tracts)
A) FHA, FSA/RHS & VA Home Purchase Loans
B) Conventional Home Purchase Loans
C) Refinancings
D) Home Improvement Loans
E) Loans on Dwellings For 5+ Families
F) Non-occupant Loans on < 5 Family Dwellings (A B C & D)
Number
Average Value
Number
Average Value
Number
Average Value
Number
Average Value
Number
Average Value
Number
Average Value
LOANS ORIGINATED
8
$153,710
219
$130,480
120
$132,336
26
$32,511
1
$73,920
21
$78,728
APPLICATIONS APPROVED, NOT ACCEPTED
1
$70,710
17
$111,696
21
$166,852
4
$21,695
0
$0
1
$131,130
APPLICATIONS DENIED
0
$0
12
$154,218
49
$138,609
6
$24,105
0
$0
1
$98,990
APPLICATIONS WITHDRAWN
0
$0
12
$135,042
33
$140,676
3
$72,423
1
$797,070
1
$51,420
FILES CLOSED FOR INCOMPLETENESS
0
$0
1
$56,570
14
$162,629
0
$0
0
$0
1
$76,490
Aggregated Statistics For Year 2005 (Based on 2 partial tracts)
A) FHA, FSA/RHS & VA Home Purchase Loans
B) Conventional Home Purchase Loans
C) Refinancings
D) Home Improvement Loans
F) Non-occupant Loans on < 5 Family Dwellings (A B C & D)
G) Loans On Manufactured Home Dwelling (A B C & D)
Number
Average Value
Number
Average Value
Number
Average Value
Number
Average Value
Number
Average Value
Number
Average Value
LOANS ORIGINATED
9
$143,416
244
$135,441
153
$124,136
30
$46,882
15
$107,391
0
$0
APPLICATIONS APPROVED, NOT ACCEPTED
1
$277,690
18
$124,274
23
$118,890
1
$19,280
1
$48,210
0
$0
APPLICATIONS DENIED
1
$173,560
21
$105,756
60
$134,849
6
$33,853
3
$119,777
1
$31,500
APPLICATIONS WITHDRAWN
3
$113,560
43
$102,235
46
$129,538
3
$24,213
1
$128,560
0
$0
FILES CLOSED FOR INCOMPLETENESS
0
$0
3
$129,630
18
$169,485
0
$0
1
$100,280
0
$0
Aggregated Statistics For Year 2004 (Based on 2 partial tracts)
A) FHA, FSA/RHS & VA Home Purchase Loans
B) Conventional Home Purchase Loans
C) Refinancings
D) Home Improvement Loans
E) Loans on Dwellings For 5+ Families
F) Non-occupant Loans on < 5 Family Dwellings (A B C & D)
G) Loans On Manufactured Home Dwelling (A B C & D)
Number
Average Value
Number
Average Value
Number
Average Value
Number
Average Value
Number
Average Value
Number
Average Value
Number
Average Value
LOANS ORIGINATED
6
$141,417
194
$131,585
164
$134,627
28
$23,439
1
$192,840
13
$99,733
0
$0
APPLICATIONS APPROVED, NOT ACCEPTED
0
$0
13
$162,282
20
$124,960
2
$22,500
0
$0
0
$0
1
$36,640
APPLICATIONS DENIED
1
$71,990
9
$99,920
55
$113,904
4
$42,265
0
$0
2
$146,235
1
$85,490
APPLICATIONS WITHDRAWN
0
$0
6
$124,060
35
$150,654
2
$47,245
0
$0
0
$0
0
$0
FILES CLOSED FOR INCOMPLETENESS
0
$0
6
$139,917
17
$132,908
3
$15,640
0
$0
1
$118,280
0
$0
Aggregated Statistics For Year 2003 (Based on 2 partial tracts)
A) FHA, FSA/RHS & VA Home Purchase Loans
B) Conventional Home Purchase Loans
C) Refinancings
D) Home Improvement Loans
E) Loans on Dwellings For 5+ Families
F) Non-occupant Loans on < 5 Family Dwellings (A B C & D)
Number
Average Value
Number
Average Value
Number
Average Value
Number
Average Value
Number
Average Value
Number
Average Value
LOANS ORIGINATED
13
$131,576
210
$119,800
541
$129,625
34
$18,679
1
$4,936,700
13
$105,271
APPLICATIONS APPROVED, NOT ACCEPTED
0
$0
13
$117,237
40
$136,820
3
$46,280
0
$0
1
$39,850
APPLICATIONS DENIED
2
$100,920
15
$86,907
59
$128,266
3
$19,070
0
$0
1
$73,920
APPLICATIONS WITHDRAWN
1
$158,130
21
$131,958
67
$120,904
1
$32,140
0
$0
1
$225,620
FILES CLOSED FOR INCOMPLETENESS
0
$0
3
$132,630
13
$166,732
0
$0
0
$0
0
$0
Aggregated Statistics For Year 1999 (Based on 1 partial tract)
A) FHA, FSA/RHS & VA Home Purchase Loans
B) Conventional Home Purchase Loans
C) Refinancings
D) Home Improvement Loans
F) Non-occupant Loans on < 5 Family Dwellings (A B C & D)
Detailed PMIC statistics for the following Tracts:0002.04
2002 - 2018 National Fire Incident Reporting System (NFIRS) incidents
Based on the data from the years 2002 - 2018 the average number of fire incidents per year is 7. The highest number of fire incidents - 18 took place in 2003, and the least - 0 in 2011. The data has a decreasing trend.
When looking into fire subcategories, the most reports belonged to: Outside Fires (53.4%), and Structure Fires (39.7%).
Fire incident types reported to NFIRS in Zip Code 52328
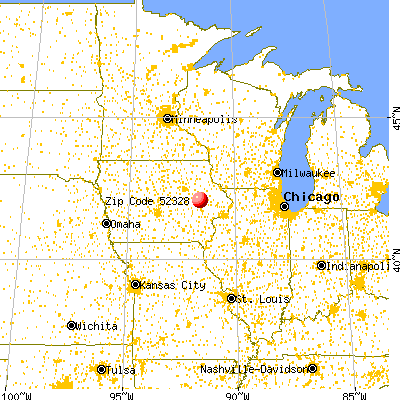


 Nearest zip codes: 52233, 52402, 52411, 52341, 52202, 52401.
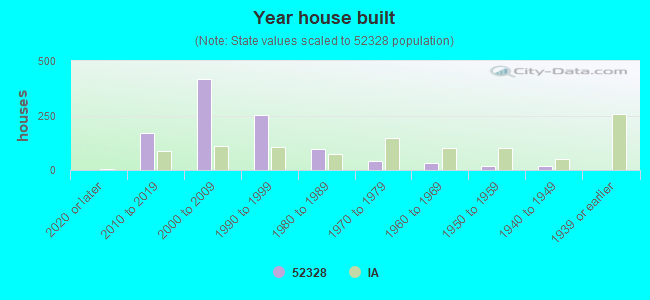


 Based on the data from the years 2002 - 2018 the average number of fire incidents per year is 7. The highest number of fire incidents - 18 took place in 2003, and the least - 0 in 2011. The data has a decreasing trend.
 When looking into fire subcategories, the most reports belonged to: Outside Fires (53.4%), and Structure Fires (39.7%).