Estimated zip code population in 2022: 1,240 Zip code population in 2010: 967 Zip code population in 2000: 934
Houses and condos: 430 Renter-occupied apartments: 85
% of renters here:
20%
State:
28%
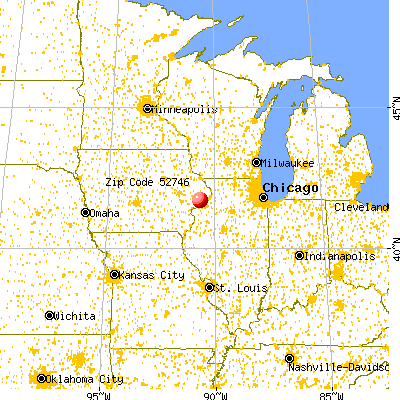
March 2022 cost of living index in zip code 52746: 80.6 (low, U.S. average is 100)
Land area: 26.5 sq. mi. Water area: 0.1 sq. mi.
Population density: 47 people per square mile
(very low).
OSM Map
General Map
Google Map
MSN Map
OSM Map
General Map
Google Map
MSN Map
OSM Map
General Map
Google Map
MSN Map
OSM Map
General Map
Google Map
MSN Map
Please wait while loading the map...
Real estate property taxes paid for housing units in 2022:
This zip code:
1.0% ($3,009)
Iowa:
1.4% ($2,724)
Median real estate property taxes paid for housing units with mortgages in 2022: $2,772 (1.1%) Median real estate property taxes paid for housing units with no mortgage in 2022: $4,109 (1.2%)
Business Search- 14 Million verified businesses
Males: 735
(59.2%)
Females: 505
(40.8%)
For population 25 years and over in 52746:
High school or higher: 98.3%
Bachelor's degree or higher: 22.3%
Graduate or professional degree: 6.0%
Unemployed: 2.9%
Mean travel time to work (commute): 30.3 minutes
For population 15 years and over in 52746:
Never married: 22.3%
Now married: 62.9%
Separated: 0.0%
Widowed: 1.0%
Divorced: 13.8%
Zip code 52746 compared to state average:
Median household income above state average.
Median house value above state average.
Black race population percentage significantly below state average.
Hispanic race population percentage above state average.
Foreign-born population percentage significantly below state average.
Length of stay since moving in significantly above state average.
Averages for the 2020 tax year for zip code 52746, filed in 2021:
Average Adjusted Gross Income (AGI) in 2020: $72,245 (Individual Income Tax Returns)
Here:
$72,245
State:
$71,087
Salary/wage: $62,981 (reported on 81.8% of returns)
Here:
$62,981
State:
$57,361
(% of AGI for various income ranges: 1237.1% for AGIs below $25k, 3060.0% for AGIs $25k-50k, 5710.0% for AGIs $50k-75k, 7912.0% for AGIs $75k-100k, 16067.5% for AGIs $100k-200k)
Taxable interest for individuals: $1,056 (reported on 40.9% of returns)
This zip code:
$1,056
Iowa:
$1,633
(% of AGI for various income ranges: 8.6% for AGIs below $25k, 60.0% for AGIs $25k-50k, 72.0% for AGIs $50k-75k, 80.0% for AGIs $75k-100k, 82.5% for AGIs $100k-200k)
Ordinary dividends: $2,867 (reported on 27.3% of returns)
Here:
$2,867
State:
$5,432
(% of AGI for various income ranges: 30.0% for AGIs below $25k, 95.7% for AGIs $25k-50k, 158.0% for AGIs $75k-100k, 221.2% for AGIs $100k-200k)
Net capital gain/loss in AGI: +$2,120 (reported on 22.7% of returns)
Here:
+$2,120
State:
+$15,243
(% of AGI for various income ranges: 40.0% for AGIs $25k-50k, 230.0% for AGIs $100k-200k)
Profit/loss from business: +$2,700 (reported on 15.9% of returns)
Here:
+$2,700
State:
+$11,763
(% of AGI for various income ranges: 148.6% for AGIs $25k-50k, 170.0% for AGIs $75k-100k)
Taxable individual retirement arrangement distribution: $10,471 (reported on 15.9% of returns)
52746:
$10,471
Iowa:
$17,324
(% of AGI for various income ranges: 442.9% for AGIs $25k-50k, 846.0% for AGIs $75k-100k)
Total itemized deductions: $20,867 (reported on 6.8% of returns)
Here:
$20,867
State:
$33,775
(% of AGI for various income ranges: 1252.0% for AGIs $50k-75k)
Taxes paid: $7,233 (reported on 6.8% of returns)
52746:
$7,233
State:
$7,704
(% of AGI for various income ranges: 434.0% for AGIs $50k-75k)
Earned income credit: $1,625 (reported on 9.1% of returns)
Here:
$1,625
State:
$2,195
(% of AGI for various income ranges: 92.9% for AGIs below $25k)
Percentage of individuals using paid preparers for their 2020 taxes: 100.0%
Here:
100%
State:
95%
(% for various income ranges: 100.0% for AGIs below $25k, 100.0% for AGIs $25k-50k, 100.0% for AGIs $50k-75k, 100.0% for AGIs $75k-100k, 100.0% for AGIs $100k-200k)
Averages for the 2012 tax year for zip code 52746, filed in 2013:
Average Adjusted Gross Income (AGI) in 2012: $63,527 (Individual Income Tax Returns)
Here:
$63,527
State:
$58,860
Salary/wage: $52,592 (reported on 84.4% of returns)
Here:
$52,592
State:
$46,659
(% of AGI for various income ranges: 69.9% for AGIs below $25k, 63.4% for AGIs $25k-50k, 75.5% for AGIs $50k-75k, 71.9% for AGIs $75k-100k, 68.8% for AGIs $100k-200k)
Taxable interest for individuals: $941 (reported on 48.9% of returns)
This zip code:
$941
Iowa:
$1,537
(% of AGI for various income ranges: 1.7% for AGIs below $25k, 1.2% for AGIs $25k-50k, 0.3% for AGIs $50k-75k, 0.5% for AGIs $75k-100k, 0.7% for AGIs $100k-200k)
Ordinary dividends: $1,408 (reported on 26.7% of returns)
Here:
$1,408
State:
$4,542
(% of AGI for various income ranges: 0.8% for AGIs below $25k, 1.4% for AGIs $25k-50k, 0.6% for AGIs $75k-100k, 0.6% for AGIs $100k-200k)
Net capital gain/loss in AGI: +$1,300 (reported on 17.8% of returns)
Here:
+$1,300
State:
+$11,802
Profit/loss from business: +$10,643 (reported on 15.6% of returns)
Here:
+$10,643
State:
+$10,509
Taxable individual retirement arrangement distribution: $8,725 (reported on 8.9% of returns)
52746:
$8,725
Iowa:
$11,773
Total itemized deductions: $19,125 (17% of AGI, reported on 35.6% of returns)
Here:
$19,125
State:
$21,278
Here:
17.3% of AGI
State:
18.9% of AGI
(% of AGI for various income ranges: 32.4% for AGIs below $25k, 8.9% for AGIs $50k-75k, 8.9% for AGIs $75k-100k, 11.9% for AGIs $100k-200k)
Charity contributions: $2,408 (reported on 26.7% of returns)
Here:
$2,408
State:
$4,044
(% of AGI for various income ranges: 0.9% for AGIs $50k-75k, 0.6% for AGIs $75k-100k, 1.6% for AGIs $100k-200k)
Taxes paid: $8,244 (reported on 35.6% of returns)
52746:
$8,244
State:
$8,846
(% of AGI for various income ranges: 4.1% for AGIs below $25k, 3.6% for AGIs $50k-75k, 4.0% for AGIs $75k-100k, 6.3% for AGIs $100k-200k)
Earned income credit: $2,800 (reported on 6.7% of returns)
Here:
$2,800
State:
$2,098
(% of AGI for various income ranges: 5.1% for AGIs below $25k)
Percentage of individuals using paid preparers for their 2012 taxes: 64.4%
Here:
64%
State:
65%
(% for various income ranges: 50.0% for AGIs below $25k, 66.7% for AGIs $25k-50k, 71.4% for AGIs $50k-75k, 57.1% for AGIs $75k-100k, 87.5% for AGIs $100k-200k)
Averages for the 2004 tax year for zip code 52746, filed in 2005:
Average Adjusted Gross Income (AGI) in 2004: $45,591 (Individual Income Tax Returns)
Here:
$45,591
State:
$43,875
Salary/wage: $40,513 (reported on 89.3% of returns)
Here:
$40,513
State:
$38,265
(% of AGI for various income ranges: 78.7% for AGIs below $10k, 80.6% for AGIs $10k-25k, 77.1% for AGIs $25k-50k, 77.4% for AGIs $50k-75k, 84.8% for AGIs $75k-100k, 78.4% for AGIs over 100k)
Taxable interest for individuals: $1,303 (reported on 58.6% of returns)
This zip code:
$1,303
Iowa:
$1,768
(% of AGI for various income ranges: 10.9% for AGIs below $10k, 2.4% for AGIs $10k-25k, 1.7% for AGIs $25k-50k, 1.4% for AGIs $50k-75k, 1.6% for AGIs $75k-100k, 1.0% for AGIs over 100k)
Taxable dividends: $976 (reported on 29.0% of returns)
Here:
$976
State:
$2,510
(% of AGI for various income ranges: 1.0% for AGIs below $10k, 0.4% for AGIs $10k-25k, 0.5% for AGIs $25k-50k, 1.2% for AGIs $50k-75k, 0.4% for AGIs $75k-100k, 0.3% for AGIs over 100k)
Net capital gain/loss: +$849 (reported on 21.7% of returns)
Here:
+$849
State:
+$6,139
(% of AGI for various income ranges: 4.8% for AGIs below $10k, 0.1% for AGIs $25k-50k, 0.7% for AGIs $50k-75k, 0.5% for AGIs $75k-100k)
Profit/loss from business: +$6,575 (reported on 17.1% of returns)
Here:
+$6,575
State:
+$8,574
(% of AGI for various income ranges: 8.6% for AGIs below $10k, 0.9% for AGIs $25k-50k, 5.8% for AGIs $50k-75k, 2.9% for AGIs $75k-100k)
Total itemized deductions: $14,605 (19% of AGI, reported on 34.3% of returns)
Here:
$14,605
State:
$16,976
Here:
18.7% of AGI
State:
20.8% of AGI
(% of AGI for various income ranges: 8.0% for AGIs $10k-25k, 9.0% for AGIs $25k-50k, 11.8% for AGIs $50k-75k, 12.6% for AGIs $75k-100k, 12.4% for AGIs over 100k)
Charity contributions deductions: $2,183 (3% of AGI, reported on 29.4% of returns)
Here:
$2,183
State:
$3,089
Here:
2.7% of AGI
State:
3.6% of AGI
(% of AGI for various income ranges: 1.5% for AGIs $25k-50k, 1.0% for AGIs $50k-75k, 1.2% for AGIs $75k-100k, 2.5% for AGIs over 100k)
Total tax: $5,822 (reported on 81.3% of returns)
52746:
$5,822
State:
$6,177
(% of AGI for various income ranges: 2.0% for AGIs below $10k, 3.5% for AGIs $10k-25k, 6.4% for AGIs $25k-50k, 8.9% for AGIs $50k-75k, 10.8% for AGIs $75k-100k, 18.2% for AGIs over 100k)
Earned income credit: $1,364 (reported on 10.3% of returns)
Here:
$1,364
State:
$1,540
Percentage of individuals using paid preparers for their 2004 taxes: 71.3%
Here:
71%
State:
70%
(% for various income ranges: 63.9% for AGIs below $10k, 73.3% for AGIs $10k-25k, 71.6% for AGIs $25k-50k, 71.2% for AGIs $50k-75k, 82.6% for AGIs $75k-100k, 67.9% for AGIs over 100k)
Household received Food Stamps/SNAP in the past 12 months: 9 Household did not receive Food Stamps/SNAP in the past 12 months: 429
Women who had a birth in the past 12 months: 9 (7 now married, 1 unmarried) Women who did not have a birth in the past 12 months: 220 (143 now married, 76 unmarried)
Housing units in zip code 52746 with a mortgage: 228 (40 second mortgage, 13 home equity loan, 27 both second mortgage and home equity loan) Houses without a mortgage: 3
Median monthly owner costs for units with a mortgage: $1,758 Median monthly owner costs for units without a mortgage: $754
Residents with income below the poverty level in 2022:
This zip code:
15.3%
Whole state:
11.0%
Residents with income below 50% of the poverty level in 2022:
This zip code:
10.6%
Whole state:
5.5%
Median number of rooms in houses and condos:
Here:
7.4
State:
6.8
Median number of rooms in apartments:
Here:
7.9
State:
4.2
Notable locations in this zip code not listed on our city pages
Size of family households: 206 2-persons, 48 3-persons, 63 4-persons, 65 5-persons, 1 7-or-more-persons
Size of nonfamily households: 43 1-person, 4 2-persons
289 married couples with children.
24 single-parent households (4 men, 20 women).
98.9% of residents of 52746 zip code speak English at home.
0.3% of residents speak other Indo-European language at home (25% very well, 25% well, 50% not well).
Foreign born population: 0 (0.0%)
:
0.0%
Whole state:
6.0%
48%German
17%American
15%Irish
7%Italian
2%Eastern European
2%English
1%Swedish
Facilities with environmental interests located in this zip code:
DONAHUE CITY OF STP (CITY CLERK in DONAHUE, IA)
National Pollutant Discharge Elimination System NON-MAJOR (Tracking pollutant discharge elimination systems) - permit Business SIC classification: SEWERAGE SYSTEMS Organizations: CITY OF DONAHUE (CONTACT/OWNER)
COUNTRY CUPBOARDS & WOODWORKS-FORMER SIT (105 SOUTH MAIN in DONAHUE, IA)
(Resource Conservation and Recovery Act (tracking hazardous waste))
RIVER VALLEY COOPERATIVE (106 EAST 1ST AVENUE in DONAHUE, IA)
AIR MINOR (AIRS/AFS) Business SIC classification: GRAIN AND FIELD BEANS Alternative names: ELDRIDGE CO-OP
59.6%Bottled, tank, or LP gas
36.7%Electricity
2.6%Other fuel
1.2%Utility gas
Population in 1990: 685. Population change in the 1990s: +249 (+36.4%).
Place of birth for U.S.-born residents:
This state: 975
Northeast: 6
Midwest: 118
South: 112
West: 26
52% of the 52746 zip code residents lived in the same house 5 years ago. Out of people who lived in different houses, 72% lived in this county. Out of people who lived in different counties, 50% lived in Iowa.
83% of the 52746 zip code residents lived in the same house 1 year ago. Out of people who lived in different houses, 88% moved from this county. Out of people who lived in different houses, 6% moved from different state.
Private vs. public school enrollment:
Students in private schools in grades 1 to 8 (elementary and middle school):
Here:
0.0%
Iowa:
10.6%
Students in private schools in grades 9 to 12 (high school): 2
Here:
3.6%
Iowa:
7.9%
Students in private undergraduate colleges: 10
Here:
21.2%
Iowa:
23.9%
Occupation by median earnings in the past 12 months ($)
251,269Computer and mathematical occupations
95,192Business and financial operations occupations
90,518Health diagnosing and treating practitioners and other technical occupations
89,999Sales and related occupations
79,697Management occupations
76,341Material moving occupations
Top industries in this zip code by the number of employees in 2005:
Accommodation and Food Services: Limited-Service Restaurants (20-49 employees: 1 establishment)
Finance and Insurance: Commercial Banking (5-9: 1)
Construction: Painting and Wall Covering Contractors (5-9: 1)
Construction: Electrical Contractors (5-9: 1)
Construction: Other Foundation, Structure, and Building Exterior Contractors (1-4: 1)
Educational Services: Fine Arts Schools (1-4: 1)
Construction: All Other Specialty Trade Contractors (1-4: 1)
Construction: Poured Concrete Foundation and Structure Contractors (1-4: 1)
Accommodation and Food Services: Caterers (1-4: 1)
Home Mortgage Disclosure Act Aggregated Statistics For Year 2009 (Based on 4 partial tracts)
A) FHA, FSA/RHS & VA Home Purchase Loans
B) Conventional Home Purchase Loans
C) Refinancings
D) Home Improvement Loans
F) Non-occupant Loans on < 5 Family Dwellings (A B C & D)
Number
Average Value
Number
Average Value
Number
Average Value
Number
Average Value
Number
Average Value
LOANS ORIGINATED
13
$165,448
17
$162,491
113
$155,606
11
$55,543
4
$221,272
APPLICATIONS APPROVED, NOT ACCEPTED
1
$51,540
2
$109,105
6
$167,337
0
$0
0
$0
APPLICATIONS DENIED
2
$165,490
1
$525,910
13
$153,876
1
$55,470
1
$370,420
APPLICATIONS WITHDRAWN
1
$162,090
2
$102,745
13
$182,838
2
$35,670
0
$0
FILES CLOSED FOR INCOMPLETENESS
0
$0
0
$0
3
$184,203
0
$0
0
$0
Aggregated Statistics For Year 2008 (Based on 4 partial tracts)
A) FHA, FSA/RHS & VA Home Purchase Loans
B) Conventional Home Purchase Loans
C) Refinancings
D) Home Improvement Loans
E) Loans on Dwellings For 5+ Families
F) Non-occupant Loans on < 5 Family Dwellings (A B C & D)
G) Loans On Manufactured Home Dwelling (A B C & D)
Number
Average Value
Number
Average Value
Number
Average Value
Number
Average Value
Number
Average Value
Number
Average Value
Number
Average Value
LOANS ORIGINATED
5
$192,624
22
$156,147
50
$144,362
10
$39,175
2
$230,795
5
$130,538
0
$0
APPLICATIONS APPROVED, NOT ACCEPTED
1
$41,820
2
$103,305
5
$138,008
0
$0
0
$0
0
$0
0
$0
APPLICATIONS DENIED
0
$0
2
$82,320
16
$133,705
2
$93,200
0
$0
0
$0
1
$23,210
APPLICATIONS WITHDRAWN
1
$196,310
1
$95,500
11
$183,908
1
$186,580
0
$0
0
$0
0
$0
FILES CLOSED FOR INCOMPLETENESS
0
$0
0
$0
3
$133,813
0
$0
0
$0
0
$0
0
$0
Aggregated Statistics For Year 2007 (Based on 4 partial tracts)
A) FHA, FSA/RHS & VA Home Purchase Loans
B) Conventional Home Purchase Loans
C) Refinancings
D) Home Improvement Loans
E) Loans on Dwellings For 5+ Families
F) Non-occupant Loans on < 5 Family Dwellings (A B C & D)
G) Loans On Manufactured Home Dwelling (A B C & D)
Number
Average Value
Number
Average Value
Number
Average Value
Number
Average Value
Number
Average Value
Number
Average Value
Number
Average Value
LOANS ORIGINATED
4
$148,922
44
$132,632
41
$113,509
14
$38,127
1
$146,240
7
$122,250
1
$2,650
APPLICATIONS APPROVED, NOT ACCEPTED
0
$0
3
$163,067
10
$119,744
2
$46,650
0
$0
1
$168,090
0
$0
APPLICATIONS DENIED
0
$0
3
$114,593
15
$144,565
8
$69,760
0
$0
0
$0
0
$0
APPLICATIONS WITHDRAWN
0
$0
3
$104,617
6
$161,258
1
$19,230
0
$0
1
$114,850
0
$0
FILES CLOSED FOR INCOMPLETENESS
0
$0
1
$106,110
1
$122,530
0
$0
0
$0
0
$0
0
$0
Aggregated Statistics For Year 2006 (Based on 4 partial tracts)
A) FHA, FSA/RHS & VA Home Purchase Loans
B) Conventional Home Purchase Loans
C) Refinancings
D) Home Improvement Loans
E) Loans on Dwellings For 5+ Families
F) Non-occupant Loans on < 5 Family Dwellings (A B C & D)
G) Loans On Manufactured Home Dwelling (A B C & D)
Number
Average Value
Number
Average Value
Number
Average Value
Number
Average Value
Number
Average Value
Number
Average Value
Number
Average Value
LOANS ORIGINATED
3
$131,143
41
$129,919
43
$114,622
16
$33,199
2
$398,915
5
$100,778
2
$45,835
APPLICATIONS APPROVED, NOT ACCEPTED
0
$0
3
$140,873
10
$112,402
1
$38,470
0
$0
0
$0
0
$0
APPLICATIONS DENIED
1
$140,850
6
$85,913
20
$131,853
7
$35,153
0
$0
1
$69,810
1
$39,280
APPLICATIONS WITHDRAWN
0
$0
5
$127,812
9
$146,402
1
$108,940
0
$0
1
$97,620
0
$0
FILES CLOSED FOR INCOMPLETENESS
0
$0
1
$138,370
3
$187,317
0
$0
0
$0
0
$0
0
$0
Aggregated Statistics For Year 2005 (Based on 4 partial tracts)
A) FHA, FSA/RHS & VA Home Purchase Loans
B) Conventional Home Purchase Loans
C) Refinancings
D) Home Improvement Loans
F) Non-occupant Loans on < 5 Family Dwellings (A B C & D)
G) Loans On Manufactured Home Dwelling (A B C & D)
Number
Average Value
Number
Average Value
Number
Average Value
Number
Average Value
Number
Average Value
Number
Average Value
LOANS ORIGINATED
3
$136,183
43
$127,223
50
$115,014
15
$39,926
3
$159,177
2
$18,100
APPLICATIONS APPROVED, NOT ACCEPTED
0
$0
7
$177,600
8
$85,774
1
$17,570
0
$0
0
$0
APPLICATIONS DENIED
0
$0
9
$138,247
26
$143,553
4
$29,040
0
$0
3
$28,000
APPLICATIONS WITHDRAWN
0
$0
5
$184,852
15
$134,891
1
$48,730
0
$0
1
$70,240
FILES CLOSED FOR INCOMPLETENESS
0
$0
1
$163,480
6
$114,267
1
$26,650
0
$0
0
$0
Aggregated Statistics For Year 2004 (Based on 4 partial tracts)
A) FHA, FSA/RHS & VA Home Purchase Loans
B) Conventional Home Purchase Loans
C) Refinancings
D) Home Improvement Loans
E) Loans on Dwellings For 5+ Families
F) Non-occupant Loans on < 5 Family Dwellings (A B C & D)
G) Loans On Manufactured Home Dwelling (A B C & D)
Number
Average Value
Number
Average Value
Number
Average Value
Number
Average Value
Number
Average Value
Number
Average Value
Number
Average Value
LOANS ORIGINATED
2
$171,380
39
$121,148
64
$116,676
11
$27,521
1
$111,090
4
$78,472
1
$5,640
APPLICATIONS APPROVED, NOT ACCEPTED
0
$0
2
$58,330
10
$104,984
2
$15,055
0
$0
0
$0
0
$0
APPLICATIONS DENIED
0
$0
4
$86,722
22
$126,203
3
$36,303
0
$0
1
$30,570
2
$14,295
APPLICATIONS WITHDRAWN
0
$0
4
$172,082
14
$126,428
2
$44,975
0
$0
1
$123,590
0
$0
FILES CLOSED FOR INCOMPLETENESS
0
$0
0
$0
5
$153,048
0
$0
0
$0
0
$0
0
$0
Aggregated Statistics For Year 2003 (Based on 4 partial tracts)
A) FHA, FSA/RHS & VA Home Purchase Loans
B) Conventional Home Purchase Loans
C) Refinancings
D) Home Improvement Loans
E) Loans on Dwellings For 5+ Families
F) Non-occupant Loans on < 5 Family Dwellings (A B C & D)
Number
Average Value
Number
Average Value
Number
Average Value
Number
Average Value
Number
Average Value
Number
Average Value
LOANS ORIGINATED
3
$141,803
23
$121,959
152
$109,230
7
$20,510
2
$584,600
2
$78,150
APPLICATIONS APPROVED, NOT ACCEPTED
1
$32,100
4
$131,652
11
$94,079
1
$24,880
0
$0
1
$52,930
APPLICATIONS DENIED
0
$0
9
$62,154
29
$110,037
4
$20,160
0
$0
1
$86,410
APPLICATIONS WITHDRAWN
1
$38,970
4
$106,532
22
$112,947
1
$18,870
0
$0
1
$48,650
FILES CLOSED FOR INCOMPLETENESS
0
$0
2
$118,905
3
$114,133
0
$0
0
$0
0
$0
Aggregated Statistics For Year 2002 (Based on 2 partial tracts)
B) Conventional Home Purchase Loans
C) Refinancings
D) Home Improvement Loans
F) Non-occupant Loans on < 5 Family Dwellings (A B C & D)
Number
Average Value
Number
Average Value
Number
Average Value
Number
Average Value
LOANS ORIGINATED
3
$70,243
21
$89,944
3
$29,823
0
$0
APPLICATIONS APPROVED, NOT ACCEPTED
0
$0
1
$142,860
0
$0
0
$0
APPLICATIONS DENIED
2
$29,550
5
$62,404
2
$13,755
1
$23,230
APPLICATIONS WITHDRAWN
1
$105,570
3
$90,690
0
$0
0
$0
FILES CLOSED FOR INCOMPLETENESS
0
$0
1
$64,200
0
$0
0
$0
Aggregated Statistics For Year 2001 (Based on 2 partial tracts)
A) FHA, FSA/RHS & VA Home Purchase Loans
B) Conventional Home Purchase Loans
C) Refinancings
D) Home Improvement Loans
F) Non-occupant Loans on < 5 Family Dwellings (A B C & D)
Number
Average Value
Number
Average Value
Number
Average Value
Number
Average Value
Number
Average Value
LOANS ORIGINATED
1
$52,780
5
$93,340
11
$92,655
2
$22,925
1
$77,850
APPLICATIONS APPROVED, NOT ACCEPTED
0
$0
1
$36,070
1
$81,110
0
$0
0
$0
APPLICATIONS DENIED
0
$0
2
$52,580
4
$82,030
1
$5,500
0
$0
APPLICATIONS WITHDRAWN
0
$0
1
$80,910
2
$86,715
0
$0
0
$0
FILES CLOSED FOR INCOMPLETENESS
0
$0
0
$0
0
$0
0
$0
0
$0
Aggregated Statistics For Year 2000 (Based on 2 partial tracts)
B) Conventional Home Purchase Loans
C) Refinancings
D) Home Improvement Loans
F) Non-occupant Loans on < 5 Family Dwellings (A B C & D)
Number
Average Value
Number
Average Value
Number
Average Value
Number
Average Value
LOANS ORIGINATED
6
$68,172
6
$61,208
3
$23,437
1
$35,260
APPLICATIONS APPROVED, NOT ACCEPTED
1
$104,140
1
$17,320
0
$0
0
$0
APPLICATIONS DENIED
2
$36,890
2
$35,055
1
$24,250
0
$0
APPLICATIONS WITHDRAWN
0
$0
2
$105,160
0
$0
0
$0
FILES CLOSED FOR INCOMPLETENESS
0
$0
0
$0
0
$0
0
$0
Aggregated Statistics For Year 1999 (Based on 2 partial tracts)
A) FHA, FSA/RHS & VA Home Purchase Loans
B) Conventional Home Purchase Loans
C) Refinancings
D) Home Improvement Loans
E) Loans on Dwellings For 5+ Families
F) Non-occupant Loans on < 5 Family Dwellings (A B C & D)


 Nearest zip codes: 52745, 52729, 52751, 52773, 52748, 52756.


