Estimated zip code population in 2022: 5,635 Zip code population in 2010: 5,426 Zip code population in 2000: 5,029
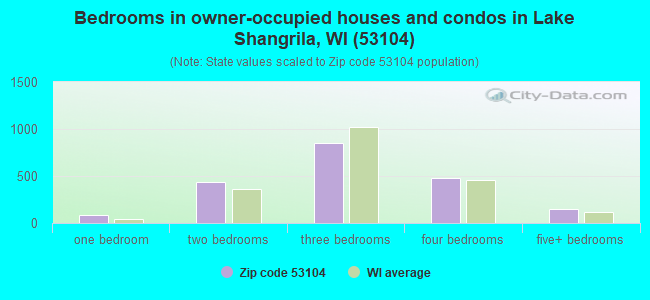
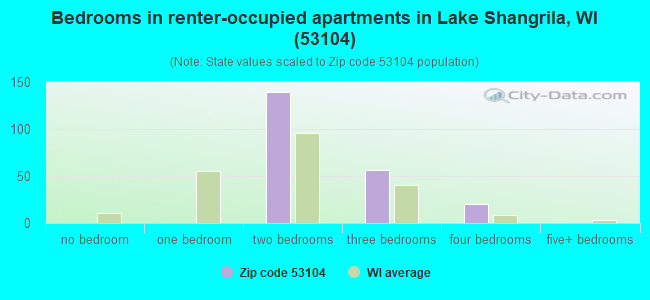
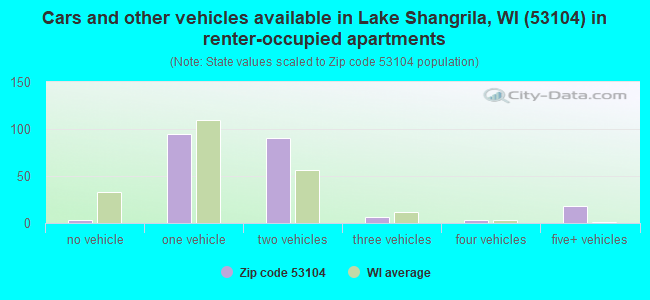
Houses and condos: 2,362 Renter-occupied apartments: 217
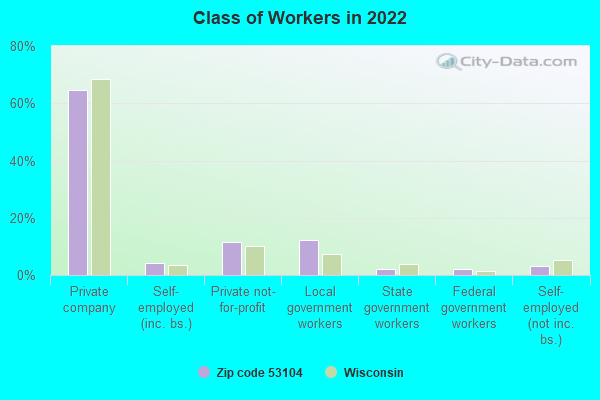
% of renters here:
10%
State:
32%
March 2022 cost of living index in zip code 53104: 96.8 (near average, U.S. average is 100)
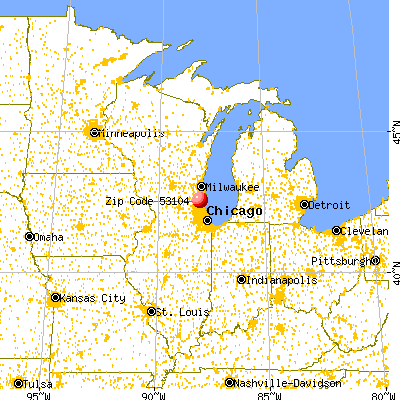
Land area: 31.9 sq. mi. Water area: 0.5 sq. mi.
Population density: 177 people per square mile
(very low).
OSM Map
General Map
Google Map
MSN Map
OSM Map
General Map
Google Map
MSN Map
OSM Map
General Map
Google Map
MSN Map
OSM Map
General Map
Google Map
MSN Map
Please wait while loading the map...
Real estate property taxes paid for housing units in 2022:
This zip code:
1.3% ($4,100)
Wisconsin:
1.4% ($3,497)
Median real estate property taxes paid for housing units with mortgages in 2022: $4,351 (1.2%) Median real estate property taxes paid for housing units with no mortgage in 2022: $3,596 (1.2%)
Business Search- 14 Million verified businesses
Males: 3,089
(54.8%)
Females: 2,547
(45.2%)
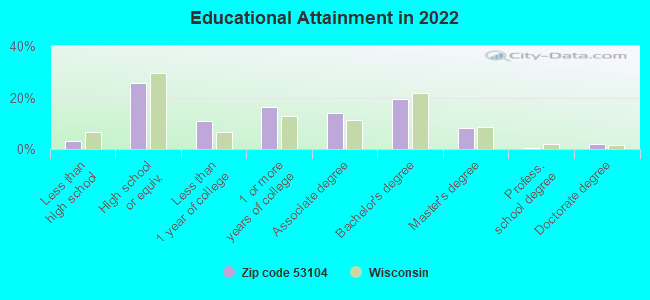
For population 25 years and over in 53104:
High school or higher: 97.1%
Bachelor's degree or higher: 30.3%
Graduate or professional degree: 10.6%
Unemployed: 7.3%
Mean travel time to work (commute): 30.7 minutes
For population 15 years and over in 53104:
Never married: 25.8%
Now married: 63.5%
Separated: 0.0%
Widowed: 3.8%
Divorced: 7.0%
Zip code 53104 compared to state average:
Unemployed percentage above state average.
Black race population percentage significantly below state average.
Hispanic race population percentage below state average.
Median age above state average.
Foreign-born population percentage below state average.
Renting percentage significantly below state average.
Length of stay since moving in above state average.
Estimated median house/condo value in 2022: $319,660
53104:
$319,660
Wisconsin:
$252,800
According to our research of Wisconsin and other state lists, there were 13 registered sex offenders living in 53104 zip code as of May 28, 2024. The ratio of all residents to sex offenders in zip code 53104 is 414 to 1. The ratio of registered sex offenders to all residents in this zip code is near the state average.
Median resident age:
This zip code:
45.5 years
Wisconsin median age:
40.4 years
Average household size:
This zip code:
2.6 people
Wisconsin:
2.3 people
Averages for the 2020 tax year for zip code 53104, filed in 2021:
Average Adjusted Gross Income (AGI) in 2020: $85,710 (Individual Income Tax Returns)
Here:
$85,710
State:
$72,319
Salary/wage: $72,503 (reported on 80.5% of returns)
Here:
$72,503
State:
$59,242
(% of AGI for various income ranges: 1006.0% for AGIs below $25k, 3622.7% for AGIs $25k-50k, 6375.5% for AGIs $50k-75k, 8810.5% for AGIs $75k-100k, 17692.8% for AGIs $100k-200k, 79761.7% for AGIs over 200k)
Taxable interest for individuals: $1,175 (reported on 38.6% of returns)
This zip code:
$1,175
Wisconsin:
$1,431
(% of AGI for various income ranges: 14.5% for AGIs below $25k, 37.0% for AGIs $25k-50k, 65.5% for AGIs $50k-75k, 88.4% for AGIs $75k-100k, 109.7% for AGIs $100k-200k, 530.0% for AGIs over 200k)
Ordinary dividends: $6,194 (reported on 27.1% of returns)
Here:
$6,194
State:
$6,481
(% of AGI for various income ranges: 31.6% for AGIs below $25k, 49.1% for AGIs $25k-50k, 118.7% for AGIs $50k-75k, 320.0% for AGIs $75k-100k, 386.2% for AGIs $100k-200k, 3598.3% for AGIs over 200k)
Net capital gain/loss in AGI: +$10,162 (reported on 24.1% of returns)
Here:
+$10,162
State:
+$18,329
(% of AGI for various income ranges: 11.0% for AGIs below $25k, 27.0% for AGIs $25k-50k, 95.2% for AGIs $50k-75k, 162.1% for AGIs $75k-100k, 474.5% for AGIs $100k-200k, 7890.0% for AGIs over 200k)
Profit/loss from business: +$18,146 (reported on 13.5% of returns)
Here:
+$18,146
State:
+$14,562
(% of AGI for various income ranges: 119.0% for AGIs below $25k, 181.4% for AGIs $25k-50k, 310.0% for AGIs $50k-75k, 277.4% for AGIs $75k-100k, 438.8% for AGIs $100k-200k, 4515.0% for AGIs over 200k)
Taxable individual retirement arrangement distribution: $20,082 (reported on 12.9% of returns)
53104:
$20,082
Wisconsin:
$19,348
(% of AGI for various income ranges: 90.5% for AGIs below $25k, 133.0% for AGIs $25k-50k, 303.9% for AGIs $50k-75k, 417.4% for AGIs $75k-100k, 711.8% for AGIs $100k-200k, 3566.7% for AGIs over 200k)
Total itemized deductions: $29,421 (reported on 10.9% of returns)
Here:
$29,421
State:
$33,000
(% of AGI for various income ranges: 213.0% for AGIs $25k-50k, 293.5% for AGIs $50k-75k, 647.4% for AGIs $75k-100k, 818.0% for AGIs $100k-200k, 5600.0% for AGIs over 200k)
Charity contributions: $7,515 (reported on 8.6% of returns)
Here:
$7,515
State:
$12,044
(% of AGI for various income ranges: 13.4% for AGIs below $25k, 19.4% for AGIs $50k-75k, 55.3% for AGIs $75k-100k, 149.5% for AGIs $100k-200k, 1855.0% for AGIs over 200k)
Taxes paid: $8,915 (reported on 10.9% of returns)
53104:
$8,915
State:
$8,228
(% of AGI for various income ranges: 58.0% for AGIs $25k-50k, 103.2% for AGIs $50k-75k, 236.3% for AGIs $75k-100k, 279.2% for AGIs $100k-200k, 1335.0% for AGIs over 200k)
Earned income credit: $1,788 (reported on 8.3% of returns)
Here:
$1,788
State:
$2,155
(% of AGI for various income ranges: 48.1% for AGIs below $25k, 38.2% for AGIs $25k-50k)
Percentage of individuals using paid preparers for their 2020 taxes: 94.1%
Here:
94%
State:
94%
(% for various income ranges: 92.8% for AGIs below $25k, 93.2% for AGIs $25k-50k, 93.5% for AGIs $50k-75k, 92.9% for AGIs $75k-100k, 97.0% for AGIs $100k-200k, 95.2% for AGIs over 200k)
Averages for the 2012 tax year for zip code 53104, filed in 2013:
Average Adjusted Gross Income (AGI) in 2012: $62,001 (Individual Income Tax Returns)
Here:
$62,001
State:
$57,939
Salary/wage: $54,229 (reported on 85.5% of returns)
Here:
$54,229
State:
$48,248
(% of AGI for various income ranges: 70.2% for AGIs below $25k, 74.6% for AGIs $25k-50k, 73.4% for AGIs $50k-75k, 78.2% for AGIs $75k-100k, 82.4% for AGIs $100k-200k, 59.6% for AGIs over 200k)
Taxable interest for individuals: $966 (reported on 39.7% of returns)
This zip code:
$966
Wisconsin:
$1,224
(% of AGI for various income ranges: 1.2% for AGIs below $25k, 0.9% for AGIs $25k-50k, 0.9% for AGIs $50k-75k, 0.7% for AGIs $75k-100k, 0.3% for AGIs $100k-200k, 0.7% for AGIs over 200k)
Ordinary dividends: $2,783 (reported on 25.2% of returns)
Here:
$2,783
State:
$5,137
(% of AGI for various income ranges: 2.2% for AGIs below $25k, 1.3% for AGIs $25k-50k, 0.9% for AGIs $50k-75k, 1.2% for AGIs $75k-100k, 0.7% for AGIs $100k-200k, 1.7% for AGIs over 200k)
Net capital gain/loss in AGI: +$6,692 (reported on 18.4% of returns)
Here:
+$6,692
State:
+$11,137
(% of AGI for various income ranges: 0.3% for AGIs $25k-50k, 0.2% for AGIs $50k-75k, 0.4% for AGIs $100k-200k, 10.3% for AGIs over 200k)
Profit/loss from business: +$10,900 (reported on 12.4% of returns)
Here:
+$10,900
State:
+$11,943
(% of AGI for various income ranges: 5.0% for AGIs below $25k, 2.8% for AGIs $25k-50k, 2.3% for AGIs $50k-75k, 2.4% for AGIs $75k-100k, 2.4% for AGIs $100k-200k)
Taxable individual retirement arrangement distribution: $14,562 (reported on 12.1% of returns)
53104:
$14,562
Wisconsin:
$14,087
(% of AGI for various income ranges: 4.4% for AGIs below $25k, 2.8% for AGIs $25k-50k, 3.4% for AGIs $50k-75k, 2.8% for AGIs $75k-100k, 3.8% for AGIs $100k-200k)
Total itemized deductions: $23,344 (23% of AGI, reported on 45.0% of returns)
Here:
$23,344
State:
$22,257
Here:
22.6% of AGI
State:
20.1% of AGI
(% of AGI for various income ranges: 12.8% for AGIs below $25k, 13.9% for AGIs $25k-50k, 16.9% for AGIs $50k-75k, 19.8% for AGIs $75k-100k, 18.6% for AGIs $100k-200k, 15.1% for AGIs over 200k)
Charity contributions: $2,470 (reported on 37.6% of returns)
Here:
$2,470
State:
$3,370
(% of AGI for various income ranges: 0.8% for AGIs below $25k, 0.9% for AGIs $25k-50k, 1.5% for AGIs $50k-75k, 1.5% for AGIs $75k-100k, 1.7% for AGIs $100k-200k, 1.7% for AGIs over 200k)
Taxes paid: $10,806 (reported on 45.0% of returns)
53104:
$10,806
State:
$10,731
(% of AGI for various income ranges: 4.3% for AGIs below $25k, 4.8% for AGIs $25k-50k, 7.0% for AGIs $50k-75k, 8.7% for AGIs $75k-100k, 9.4% for AGIs $100k-200k, 8.2% for AGIs over 200k)
Earned income credit: $1,881 (reported on 9.6% of returns)
Here:
$1,881
State:
$2,094
(% of AGI for various income ranges: 3.3% for AGIs below $25k, 0.7% for AGIs $25k-50k)
Percentage of individuals using paid preparers for their 2012 taxes: 57.1%
Here:
57%
State:
54%
(% for various income ranges: 49.5% for AGIs below $25k, 53.2% for AGIs $25k-50k, 64.3% for AGIs $50k-75k, 65.5% for AGIs $75k-100k, 64.4% for AGIs $100k-200k, 66.7% for AGIs over 200k)
Averages for the 2004 tax year for zip code 53104, filed in 2005:
Average Adjusted Gross Income (AGI) in 2004: $55,597 (Individual Income Tax Returns)
Here:
$55,597
State:
$47,735
Salary/wage: $49,962 (reported on 86.7% of returns)
Here:
$49,962
State:
$41,540
(% of AGI for various income ranges: 112.7% for AGIs below $10k, 71.6% for AGIs $10k-25k, 80.8% for AGIs $25k-50k, 81.3% for AGIs $50k-75k, 87.5% for AGIs $75k-100k, 70.5% for AGIs over 100k)
Taxable interest for individuals: $1,116 (reported on 58.6% of returns)
This zip code:
$1,116
Wisconsin:
$1,420
(% of AGI for various income ranges: 8.4% for AGIs below $10k, 3.0% for AGIs $10k-25k, 1.2% for AGIs $25k-50k, 1.2% for AGIs $50k-75k, 1.0% for AGIs $75k-100k, 0.8% for AGIs over 100k)
Taxable dividends: $1,622 (reported on 31.4% of returns)
Here:
$1,622
State:
$2,869
(% of AGI for various income ranges: 5.0% for AGIs below $10k, 2.1% for AGIs $10k-25k, 0.9% for AGIs $25k-50k, 0.8% for AGIs $50k-75k, 0.4% for AGIs $75k-100k, 1.0% for AGIs over 100k)
Net capital gain/loss: +$16,684 (reported on 22.1% of returns)
Here:
+$16,684
State:
+$9,569
(% of AGI for various income ranges: -3.0% for AGIs below $10k, -0.2% for AGIs $10k-25k, 1.1% for AGIs $25k-50k, 1.2% for AGIs $50k-75k, 1.5% for AGIs $75k-100k, 14.7% for AGIs over 100k)
Profit/loss from business: +$10,048 (reported on 14.4% of returns)
Here:
+$10,048
State:
+$10,417
(% of AGI for various income ranges: 7.1% for AGIs below $10k, 6.1% for AGIs $10k-25k, 2.6% for AGIs $25k-50k, 2.5% for AGIs $50k-75k, 2.0% for AGIs $75k-100k, 2.4% for AGIs over 100k)
IRA payment deduction: $3,302 (reported on 3.3% of returns)
53104:
$3,302
Wisconsin:
$2,900
(% of AGI for various income ranges: 0.4% for AGIs $10k-25k, 0.4% for AGIs $25k-50k, 0.2% for AGIs $50k-75k, 0.3% for AGIs $75k-100k, 0.1% for AGIs over 100k)
Self-employed pension: $15,615 (reported on 0.5% of returns)
Here:
$15,615
Wisconsin:
$11,934
Total itemized deductions: $19,806 (23% of AGI, reported on 48.6% of returns)
Here:
$19,806
State:
$18,160
Here:
23.2% of AGI
State:
21.1% of AGI
(% of AGI for various income ranges: 27.5% for AGIs below $10k, 13.9% for AGIs $10k-25k, 16.0% for AGIs $25k-50k, 20.2% for AGIs $50k-75k, 20.3% for AGIs $75k-100k, 15.1% for AGIs over 100k)
Charity contributions deductions: $2,221 (3% of AGI, reported on 43.9% of returns)
Here:
$2,221
State:
$2,711
Here:
2.5% of AGI
State:
3.0% of AGI
(% of AGI for various income ranges: 1.1% for AGIs below $10k, 1.3% for AGIs $10k-25k, 1.4% for AGIs $25k-50k, 2.0% for AGIs $50k-75k, 2.0% for AGIs $75k-100k, 1.7% for AGIs over 100k)
Total tax: $7,718 (reported on 80.4% of returns)
53104:
$7,718
State:
$7,114
(% of AGI for various income ranges: 3.3% for AGIs below $10k, 4.6% for AGIs $10k-25k, 7.5% for AGIs $25k-50k, 8.5% for AGIs $50k-75k, 9.3% for AGIs $75k-100k, 15.7% for AGIs over 100k)
Earned income credit: $1,489 (reported on 7.2% of returns)
Here:
$1,489
State:
$1,544
Percentage of individuals using paid preparers for their 2004 taxes: 59.4%
Here:
59%
State:
57%
(% for various income ranges: 47.9% for AGIs below $10k, 58.7% for AGIs $10k-25k, 59.5% for AGIs $25k-50k, 61.4% for AGIs $50k-75k, 65.8% for AGIs $75k-100k, 67.3% for AGIs over 100k)
Household received Food Stamps/SNAP in the past 12 months: 103 Household did not receive Food Stamps/SNAP in the past 12 months: 2,074
Women who had a birth in the past 12 months: 27 (27 now married, 0 unmarried) Women who did not have a birth in the past 12 months: 992 (603 now married, 389 unmarried)
Housing units in zip code 53104 with a mortgage: 1,244 (204 second mortgage, 211 both second mortgage and home equity loan) Houses without a mortgage: 30
Median monthly owner costs for units with a mortgage: $2,010 Median monthly owner costs for units without a mortgage: $655
Residents with income below the poverty level in 2022:
This zip code:
5.8%
Whole state:
10.7%
Residents with income below 50% of the poverty level in 2022:
This zip code:
4.6%
Whole state:
5.7%
Median number of rooms in houses and condos:
Here:
6.1
State:
6.5
Median number of rooms in apartments:
Here:
5.0
State:
4.1
Notable locations in this zip code not listed on our city pages
Notable locations in zip code 53104: Bristol Wastewater Treatment Plant (A), Pheasant Run Landfill (B), Bristol Fire Department (C). Display/hide their locations on the map
Lakes and reservoirs: Paasch Lake (A), Lake Shangrila (B), Barber Pond (C), Benet Lake (D), George Lake (E), Mud Lake (F), Lake Shangri La and Benet Lake 1 (G). Display/hide their locations on the map
848 married couples with children.
184 single-parent households (68 men, 116 women).
94.7% of residents of 53104 zip code speak English at home.
2.3% of residents speak Spanish at home (85% very well, 6% well, 9% not well).
2.5% of residents speak other Indo-European language at home (100% very well).
0.3% of residents speak other language at home (100% well).
Foreign born population: 127 (2.3%) (72.7% of them are naturalized citizens)
This zip code:
2.3%
Whole state:
5.0%
28%France
20%Belgium
13%Greece
12%Czechoslovakia (includes Czech Republic and Slovakia)
12%Honduras
10%Sweden
7%Austria
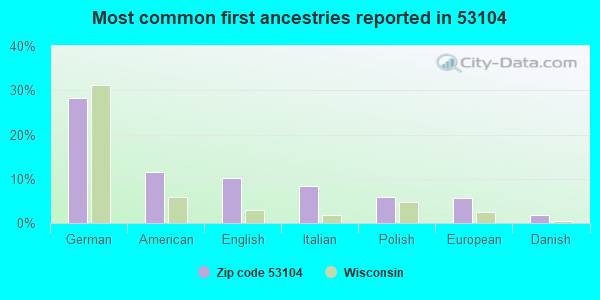
28%German
12%American
10%English
8%Italian
6%Polish
6%European
2%Danish
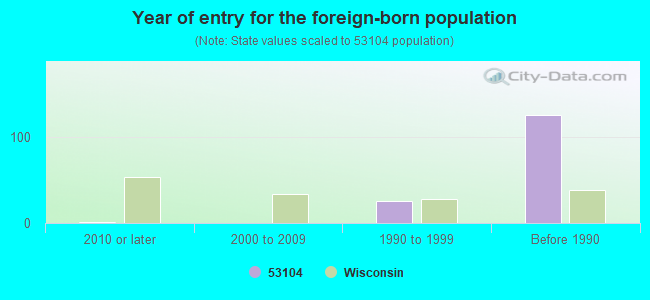
Year of entry for the foreign-born population
12010 or later
02000 to 2009
261990 to 1999
125Before 1990
Facilities with environmental interests located in this zip code:
BRISTOL WASTEWATER TREATMENT PLANT (8101 195TH AVE. in BRISTOL, WI)
National Pollutant Discharge Elimination System NON-MAJOR (Tracking pollutant discharge elimination systems) - permit National Pollutant Discharge Elimination System NON-MAJOR (Tracking pollutant discharge elimination systems) - permit STATE MASTER (Wisconsin database) - PCS-WI0022021, WASTEWATER FACILITY Business SIC classification: SEWERAGE SYSTEMS Alternative names: BRISTOL UTILITY DISTRICT 1
ANDERSON MFG CO (19800 86TH ST in BRISTOL, WI)
Conditionally Exempt Small Quantity Generators, less than 100 kg/month of hazardous waste (Resource Conservation and Recovery Act (tracking hazardous waste)) STATE MASTER (Wisconsin database) - RCRAINFO-WID080512148, CESQG Business SIC classification: BOLTS, NUTS, SCREWS, RIVETS, AND WASHERS
BRISTOL AUTO BODY (5210 200TH AVE in BRISTOL, WI)
Conditionally Exempt Small Quantity Generators, less than 100 kg/month of hazardous waste (Resource Conservation and Recovery Act (tracking hazardous waste)) - notification STATE MASTER (Wisconsin database) - RCRAINFO-WI0000117994, CESQG Organizations: CALLAHAN JOHN (CONTACT/OWNER)
BRISTOL RADIATOR SERV (17711 75TH ST in BRISTOL, WI)
Small Quantity Generators, between 100 kg and 1000 kg of hazardous waste/month (Resource Conservation and Recovery Act (tracking hazardous waste)) - notification STATE MASTER (Wisconsin database) - RCRAINFO-WI0000876193, SQG Organizations: LYNN PAUL (CONTACT/OWNER)
BRISTOL SCHOOL DIST 1 (20121 83RD ST in BRISTOL, WI)
(Integrated Compliance Information System) - ICIS-05-1987-0432, FORMAL ENFORCEMENT ACTION COMPLIANCE ACTIVITY (Tracking inspections of insecticide, fungicide, and rodenticide, and toxic substances) Business SIC classification: ELEMENTARY AND SECONDARY SCHOOLS; ADMINISTRATION OF EDUCATIONAL PROGRAMS Alternative names: BRISTOL S D NUMBER 1
BRISTOL EL (20121 83RD ST in BRISTOL, WI)
(National Center for Education Statistics) - STATE ID-0020 Organizations: BRISTOL #1 SCH DIST (SCHOOL DISTRICT)
CHARMGLOW PRODUCTS (196TH AVE AT 87TH in BRISTOL, WI)
AIR MAJOR (AIRS/AFS) Business SIC classification: HOUSEHOLD COOKING EQUIPMENT Alternative names: CHARMGLOW PRODUCTS, ELECTRIC PROD. DEPT.
Housing units lacking complete kitchen facilities: 0.6%
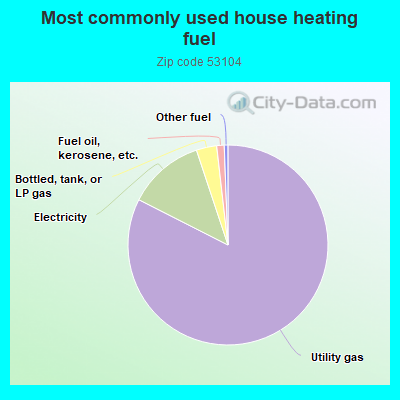
82.4%Utility gas
12.4%Electricity
3.3%Bottled, tank, or LP gas
1.2%Fuel oil, kerosene, etc.
0.6%Other fuel
Population in 1990: 4,514. Population change in the 1990s: +515 (+11.4%).
Place of birth for U.S.-born residents:
This state: 2,566
Northeast: 106
Midwest: 2,459
South: 219
West: 162
65% of the 53104 zip code residents lived in the same house 5 years ago. Out of people who lived in different houses, 48% lived in this county. Out of people who lived in different counties, 50% lived in Wisconsin.
90% of the 53104 zip code residents lived in the same house 1 year ago. Out of people who lived in different houses, 14% moved from this county. Out of people who lived in different houses, 37% moved from different county within same state. Out of people who lived in different houses, 56% moved from different state. Out of people who lived in different houses, 1% moved from abroad.
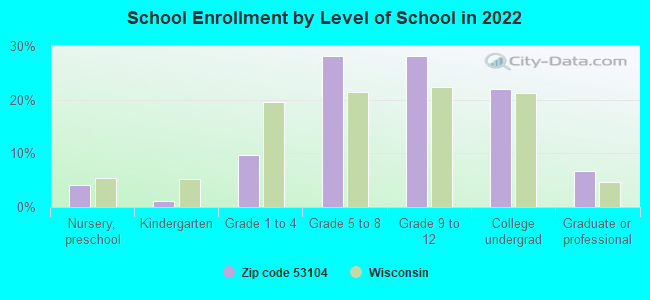
Private vs. public school enrollment:
Students in private schools in grades 1 to 8 (elementary and middle school): 12
Here:
2.3%
Wisconsin:
16.7%
Students in private schools in grades 9 to 12 (high school): 104
Here:
24.7%
Wisconsin:
12.5%
Students in private undergraduate colleges: 45
Here:
14.2%
Wisconsin:
17.5%
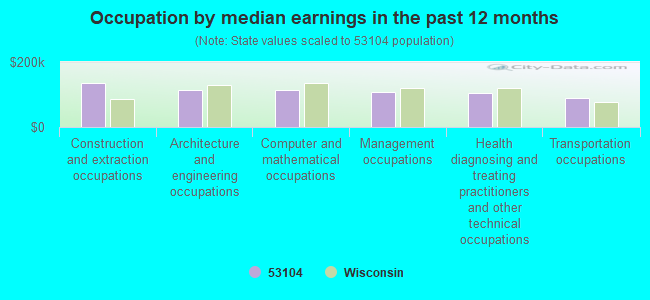
Occupation by median earnings in the past 12 months ($)
135,406Construction and extraction occupations
114,091Architecture and engineering occupations
113,600Computer and mathematical occupations
108,585Management occupations
103,887Health diagnosing and treating practitioners and other technical occupations
89,028Transportation occupations
Companies with federal contracts located in this zip code:
OBERMEYER RIFLED BARRELS (23122 60TH ST in BRISTOL, WI; small business) : $39,295 in 10 contractsfrom 2002 to 2006
Contracts for Structural Shapes, Guns, through 30 mm, Miscellaneous Weapons, Guns, over 30 mm up to 75 mm, and moreby Army Signed by year:2000: $0; 2001: $0; 2002: $9,610; 2003: -$9,280; 2004: $23,765; 2005: $0; 2006: $15,200.
Biggest contracts:
$19,650 with Army for Structural Shapes. Signed on 2004-09-26. Completion date: 2005-03-31.
$15,375, same as above.Signed on 2004-09-14. Completion date: 2005-03-31.
$15,200 with Army for Guns, through 30 mm. Signed on 2006-02-10. Completion date: 2006-03-10.
$9,610 with Army for Miscellaneous Weapons. Signed on 2002-08-15. Completion date: 2003-12-15.
Top industries in this zip code by the number of employees in 2005:
Wholesale Trade: Sporting and Recreational Goods and Supplies Merchant Wholesalers (50-99 employees: 1 establishment)
Construction: New Single-Family Housing Construction (except Operative Builders) (20-49: 1, 5-9: 1, 1-4: 2)
Accommodation and Food Services: Full-Service Restaurants (10-19: 2, 1-4: 2)
People in group quarters in 2010:
20 people in other noninstitutional facilities
18 people in residential treatment centers for juveniles (non-correctional)
People in group quarters in 2000:
18 people in religious group quarters
9 people in homes or halfway houses for drug/alcohol abuse
Fatal accident statistics in 2014:
Fatal accident count: 4
Vehicles involved in fatal accidents: 7
Fatal accidents caused by drunken drivers: 2
Fatalities: 4
Persons involved in fatal accidents: 9
Pedestrians involved in fatal accidents: 0
Fatal accident statistics in 2013:
Fatal accident count: 3
Vehicles involved in fatal accidents: 5
Fatal accidents caused by drunken drivers: 2
Fatalities: 3
Persons involved in fatal accidents: 6
Pedestrians involved in fatal accidents: 1
Home Mortgage Disclosure Act Aggregated Statistics For Year 2009 (Based on 2 partial tracts)
A) FHA, FSA/RHS & VA Home Purchase Loans
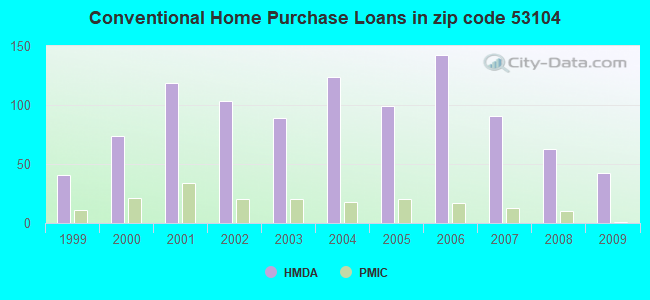
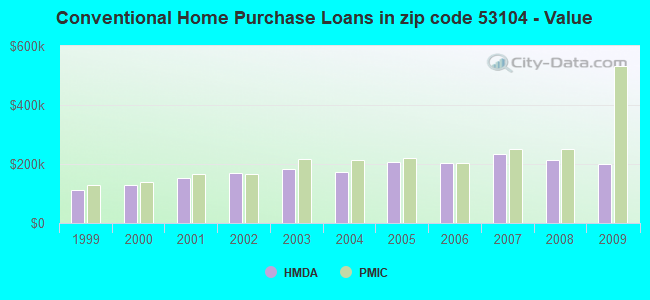
B) Conventional Home Purchase Loans
C) Refinancings
D) Home Improvement Loans
F) Non-occupant Loans on < 5 Family Dwellings (A B C & D)
G) Loans On Manufactured Home Dwelling (A B C & D)
Number
Average Value
Number
Average Value
Number
Average Value
Number
Average Value
Number
Average Value
Number
Average Value
LOANS ORIGINATED
12
$198,968
42
$200,785
313
$209,790
9
$150,250
17
$208,564
5
$41,728
APPLICATIONS APPROVED, NOT ACCEPTED
1
$217,770
1
$309,050
23
$218,335
1
$260,800
0
$0
3
$84,760
APPLICATIONS DENIED
4
$315,895
8
$185,658
69
$230,695
4
$13,692
1
$263,410
1
$58,680
APPLICATIONS WITHDRAWN
0
$0
3
$189,513
48
$226,869
1
$152,570
1
$103,020
0
$0
FILES CLOSED FOR INCOMPLETENESS
0
$0
0
$0
12
$157,241
0
$0
0
$0
0
$0
Aggregated Statistics For Year 2008 (Based on 2 partial tracts)
A) FHA, FSA/RHS & VA Home Purchase Loans
B) Conventional Home Purchase Loans
C) Refinancings
D) Home Improvement Loans
F) Non-occupant Loans on < 5 Family Dwellings (A B C & D)
G) Loans On Manufactured Home Dwelling (A B C & D)
Number
Average Value
Number
Average Value
Number
Average Value
Number
Average Value
Number
Average Value
Number
Average Value
LOANS ORIGINATED
16
$237,165
63
$214,808
196
$224,760
8
$114,589
16
$244,744
5
$13,300
APPLICATIONS APPROVED, NOT ACCEPTED
1
$226,900
8
$208,640
17
$214,316
7
$31,669
3
$166,043
0
$0
APPLICATIONS DENIED
0
$0
5
$160,132
72
$252,378
7
$244,966
1
$543,770
3
$7,823
APPLICATIONS WITHDRAWN
1
$309,050
5
$205,772
34
$256,581
1
$130,400
0
$0
0
$0
FILES CLOSED FOR INCOMPLETENESS
0
$0
0
$0
8
$230,971
0
$0
0
$0
0
$0
Aggregated Statistics For Year 2007 (Based on 2 partial tracts)
A) FHA, FSA/RHS & VA Home Purchase Loans
B) Conventional Home Purchase Loans
C) Refinancings
D) Home Improvement Loans
F) Non-occupant Loans on < 5 Family Dwellings (A B C & D)
G) Loans On Manufactured Home Dwelling (A B C & D)
Number
Average Value
Number
Average Value
Number
Average Value
Number
Average Value
Number
Average Value
Number
Average Value
LOANS ORIGINATED
7
$189,266
91
$234,104
163
$215,000
26
$79,594
20
$219,659
9
$62,012
APPLICATIONS APPROVED, NOT ACCEPTED
0
$0
12
$229,069
29
$225,277
3
$15,213
5
$235,242
0
$0
APPLICATIONS DENIED
3
$194,730
13
$160,091
67
$174,989
9
$83,746
0
$0
3
$7,823
APPLICATIONS WITHDRAWN
0
$0
14
$180,790
42
$205,660
3
$95,627
1
$127,790
0
$0
FILES CLOSED FOR INCOMPLETENESS
0
$0
1
$234,720
12
$220,268
1
$339,040
1
$234,720
0
$0
Aggregated Statistics For Year 2006 (Based on 2 partial tracts)
A) FHA, FSA/RHS & VA Home Purchase Loans
B) Conventional Home Purchase Loans
C) Refinancings
D) Home Improvement Loans
E) Loans on Dwellings For 5+ Families
F) Non-occupant Loans on < 5 Family Dwellings (A B C & D)
G) Loans On Manufactured Home Dwelling (A B C & D)
Number
Average Value
Number
Average Value
Number
Average Value
Number
Average Value
Number
Average Value
Number
Average Value
Number
Average Value
LOANS ORIGINATED
7
$192,806
142
$203,598
183
$188,118
23
$74,215
3
$1,953,827
27
$235,976
13
$50,755
APPLICATIONS APPROVED, NOT ACCEPTED
0
$0
14
$259,682
43
$164,486
0
$0
0
$0
4
$143,115
0
$0
APPLICATIONS DENIED
0
$0
7
$30,923
80
$163,359
7
$115,870
0
$0
3
$132,573
5
$41,728
APPLICATIONS WITHDRAWN
3
$155,610
9
$141,847
47
$182,199
0
$0
0
$0
0
$0
0
$0
FILES CLOSED FOR INCOMPLETENESS
0
$0
3
$324,260
35
$188,372
0
$0
0
$0
0
$0
0
$0
Aggregated Statistics For Year 2005 (Based on 2 partial tracts)
A) FHA, FSA/RHS & VA Home Purchase Loans
B) Conventional Home Purchase Loans
C) Refinancings
D) Home Improvement Loans
E) Loans on Dwellings For 5+ Families
F) Non-occupant Loans on < 5 Family Dwellings (A B C & D)
G) Loans On Manufactured Home Dwelling (A B C & D)
Number
Average Value
Number
Average Value
Number
Average Value
Number
Average Value
Number
Average Value
Number
Average Value
Number
Average Value
LOANS ORIGINATED
8
$165,771
99
$207,850
213
$176,132
23
$74,725
3
$1,911,663
13
$168,417
13
$41,126
APPLICATIONS APPROVED, NOT ACCEPTED
0
$0
10
$169,390
22
$149,664
7
$46,944
0
$0
0
$0
1
$104,320
APPLICATIONS DENIED
0
$0
30
$246,326
67
$210,197
13
$127,190
1
$5,737,600
3
$77,370
7
$35,767
APPLICATIONS WITHDRAWN
3
$151,263
16
$165,689
73
$180,148
3
$109,537
0
$0
5
$149,960
3
$69,547
FILES CLOSED FOR INCOMPLETENESS
0
$0
1
$502,040
44
$187,628
1
$440,750
0
$0
0
$0
0
$0
Aggregated Statistics For Year 2004 (Based on 2 partial tracts)
A) FHA, FSA/RHS & VA Home Purchase Loans
B) Conventional Home Purchase Loans
C) Refinancings
D) Home Improvement Loans
F) Non-occupant Loans on < 5 Family Dwellings (A B C & D)
G) Loans On Manufactured Home Dwelling (A B C & D)
Number
Average Value
Number
Average Value
Number
Average Value
Number
Average Value
Number
Average Value
Number
Average Value
LOANS ORIGINATED
9
$171,983
124
$173,611
232
$176,568
16
$154,524
13
$152,267
8
$20,212
APPLICATIONS APPROVED, NOT ACCEPTED
0
$0
7
$155,176
27
$142,281
0
$0
3
$136,920
0
$0
APPLICATIONS DENIED
0
$0
22
$139,291
67
$157,764
8
$50,204
4
$82,152
4
$34,882
APPLICATIONS WITHDRAWN
3
$142,570
13
$351,077
44
$176,810
1
$45,640
0
$0
0
$0
FILES CLOSED FOR INCOMPLETENESS
1
$155,180
1
$241,240
25
$174,892
1
$33,900
0
$0
0
$0
Aggregated Statistics For Year 2003 (Based on 2 partial tracts)
A) FHA, FSA/RHS & VA Home Purchase Loans
B) Conventional Home Purchase Loans
C) Refinancings
D) Home Improvement Loans
E) Loans on Dwellings For 5+ Families
F) Non-occupant Loans on < 5 Family Dwellings (A B C & D)
Number
Average Value
Number
Average Value
Number
Average Value
Number
Average Value
Number
Average Value
Number
Average Value
LOANS ORIGINATED
9
$159,088
89
$181,798
537
$147,702
17
$25,159
1
$932,360
16
$137,491
APPLICATIONS APPROVED, NOT ACCEPTED
0
$0
4
$153,872
40
$134,377
4
$9,128
0
$0
1
$82,150
APPLICATIONS DENIED
1
$156,480
30
$146,657
96
$156,711
4
$100,408
0
$0
4
$85,412
APPLICATIONS WITHDRAWN
0
$0
14
$142,043
50
$170,850
1
$32,600
1
$5,946,240
7
$84,574
FILES CLOSED FOR INCOMPLETENESS
0
$0
4
$91,280
13
$217,768
0
$0
0
$0
0
$0
Aggregated Statistics For Year 2002 (Based on 2 partial tracts)
A) FHA, FSA/RHS & VA Home Purchase Loans
B) Conventional Home Purchase Loans
C) Refinancings
D) Home Improvement Loans
E) Loans on Dwellings For 5+ Families
F) Non-occupant Loans on < 5 Family Dwellings (A B C & D)
Number
Average Value
Number
Average Value
Number
Average Value
Number
Average Value
Number
Average Value
Number
Average Value
LOANS ORIGINATED
8
$121,598
103
$169,659
398
$139,243
14
$17,045
1
$4,955,200
23
$144,120
APPLICATIONS APPROVED, NOT ACCEPTED
0
$0
3
$126,487
31
$127,119
0
$0
0
$0
1
$82,150
APPLICATIONS DENIED
0
$0
10
$70,155
76
$134,964
5
$8,346
0
$0
1
$371,640
APPLICATIONS WITHDRAWN
1
$122,580
12
$139,528
42
$139,807
5
$36,772
0
$0
1
$217,770
FILES CLOSED FOR INCOMPLETENESS
0
$0
4
$182,560
9
$159,378
0
$0
0
$0
0
$0
Aggregated Statistics For Year 2001 (Based on 2 partial tracts)
A) FHA, FSA/RHS & VA Home Purchase Loans
B) Conventional Home Purchase Loans
C) Refinancings
D) Home Improvement Loans
F) Non-occupant Loans on < 5 Family Dwellings (A B C & D)
Number
Average Value
Number
Average Value
Number
Average Value
Number
Average Value
Number
Average Value
LOANS ORIGINATED
8
$140,342
119
$152,908
265
$131,989
14
$40,051
14
$117,826
APPLICATIONS APPROVED, NOT ACCEPTED
0
$0
12
$121,163
29
$80,173
1
$39,120
0
$0
APPLICATIONS DENIED
0
$0
17
$69,265
47
$126,016
7
$42,846
1
$49,550
APPLICATIONS WITHDRAWN
0
$0
14
$94,726
40
$119,381
0
$0
4
$38,468
FILES CLOSED FOR INCOMPLETENESS
0
$0
4
$115,730
8
$118,338
1
$78,240
0
$0
Aggregated Statistics For Year 2000 (Based on 2 partial tracts)
A) FHA, FSA/RHS & VA Home Purchase Loans
B) Conventional Home Purchase Loans
C) Refinancings
D) Home Improvement Loans
F) Non-occupant Loans on < 5 Family Dwellings (A B C & D)
Number
Average Value
Number
Average Value
Number
Average Value
Number
Average Value
Number
Average Value
LOANS ORIGINATED
8
$120,946
74
$127,211
91
$98,588
35
$21,386
12
$87,151
APPLICATIONS APPROVED, NOT ACCEPTED
0
$0
4
$85,738
12
$53,464
1
$39,120
0
$0
APPLICATIONS DENIED
0
$0
18
$67,663
18
$88,962
9
$13,040
1
$104,320
APPLICATIONS WITHDRAWN
0
$0
12
$172,454
17
$87,368
4
$81,825
0
$0
FILES CLOSED FOR INCOMPLETENESS
0
$0
1
$185,170
7
$84,574
0
$0
0
$0
Aggregated Statistics For Year 1999 (Based on 1 partial tract)
A) FHA, FSA/RHS & VA Home Purchase Loans
B) Conventional Home Purchase Loans
C) Refinancings
D) Home Improvement Loans
E) Loans on Dwellings For 5+ Families
F) Non-occupant Loans on < 5 Family Dwellings (A B C & D)
Detailed PMIC statistics for the following Tracts:0027.00
2002 - 2018 National Fire Incident Reporting System (NFIRS) incidents
Based on the data from the years 2002 - 2018 the average number of fires per year is 27. The highest number of fire incidents - 67 took place in 2018, and the least - 6 in 2011. The data has a growing trend.
When looking into fire subcategories, the most reports belonged to: Structure Fires (45.5%), and Outside Fires (32.2%).
Fire incident types reported to NFIRS in Zip Code 53104


 Nearest zip codes: 53142, 60002, 53179, 53168, 53170, 60046.


 Based on the data from the years 2002 - 2018 the average number of fires per year is 27. The highest number of fire incidents - 67 took place in 2018, and the least - 6 in 2011. The data has a growing trend.
 When looking into fire subcategories, the most reports belonged to: Structure Fires (45.5%), and Outside Fires (32.2%).