Estimated zip code population in 2022: 2,744 Zip code population in 2010: 2,328 Zip code population in 2000: 1,966
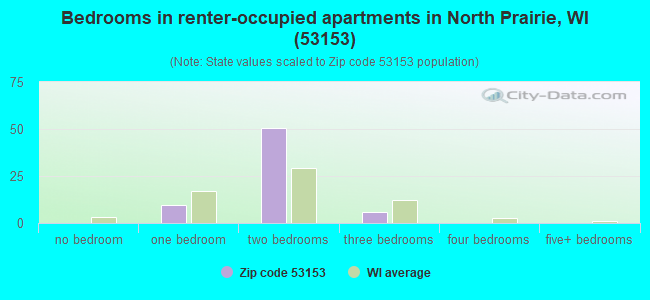
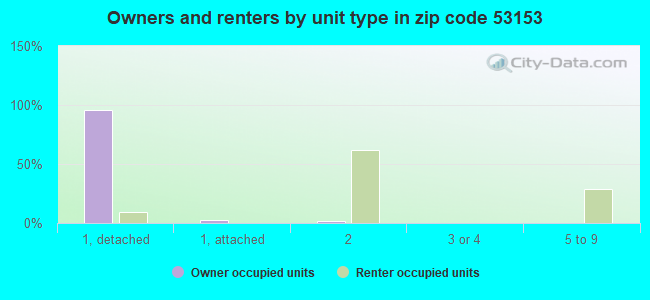
Houses and condos: 1,105 Renter-occupied apartments: 65
% of renters here:
6%
State:
32%
March 2022 cost of living index in zip code 53153: 96.9 (near average, U.S. average is 100)
Land area: 4.1 sq. mi. Water area: 0.1 sq. mi.
Population density: 666 people per square mile
(low).
OSM Map
General Map
Google Map
MSN Map
OSM Map
General Map
Google Map
MSN Map
OSM Map
General Map
Google Map
MSN Map
OSM Map
General Map
Google Map
MSN Map
Please wait while loading the map...
Real estate property taxes paid for housing units in 2022:
This zip code:
0.9% ($3,645)
Wisconsin:
1.4% ($3,497)
Median real estate property taxes paid for housing units with mortgages in 2022: $3,697 (0.9%) Median real estate property taxes paid for housing units with no mortgage in 2022: $3,469 (0.9%)
Business Search- 14 Million verified businesses
Males: 1,427
(52.0%)
Females: 1,317
(48.0%)
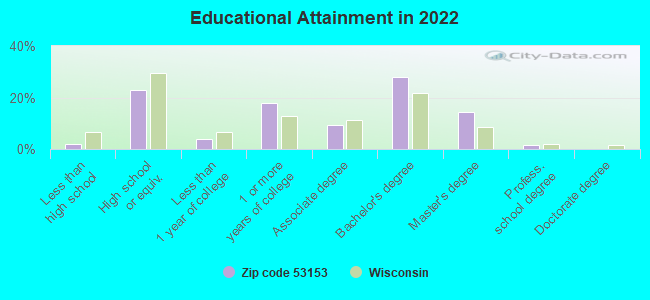
For population 25 years and over in 53153:
High school or higher: 98.9%
Bachelor's degree or higher: 44.4%
Graduate or professional degree: 16.2%
Unemployed: 0.5%
Mean travel time to work (commute): 23.2 minutes
For population 15 years and over in 53153:
Never married: 19.0%
Now married: 69.1%
Separated: 0.0%
Widowed: 4.2%
Divorced: 7.6%
Zip code 53153 compared to state average:
Median household income above state average.
Median house value above state average.
Unemployed percentage significantly below state average.
Black race population percentage significantly below state average.
Hispanic race population percentage significantly below state average.
Foreign-born population percentage significantly below state average.
Renting percentage significantly below state average.
Length of stay since moving in significantly above state average.
Estimated median house/condo value in 2022: $406,184
53153:
$406,184
Wisconsin:
$252,800
According to our research of Wisconsin and other state lists, there were 2 registered sex offenders living in 53153 zip code as of May 28, 2024. The ratio of all residents to sex offenders in zip code 53153 is 1,268 to 1. The ratio of registered sex offenders to all residents in this zip code is much lower than the state average.
Median resident age:
This zip code:
42.8 years
Wisconsin median age:
40.4 years
Average household size:
This zip code:
2.6 people
Wisconsin:
2.3 people
Averages for the 2020 tax year for zip code 53153, filed in 2021:
Average Adjusted Gross Income (AGI) in 2020: $88,127 (Individual Income Tax Returns)
Here:
$88,127
State:
$72,319
Salary/wage: $75,389 (reported on 79.9% of returns)
Here:
$75,389
State:
$59,242
(% of AGI for various income ranges: 1080.5% for AGIs below $25k, 3307.2% for AGIs $25k-50k, 6186.4% for AGIs $50k-75k, 8851.8% for AGIs $75k-100k, 17464.7% for AGIs $100k-200k, 69183.3% for AGIs over 200k)
Taxable interest for individuals: $1,074 (reported on 43.3% of returns)
This zip code:
$1,074
Wisconsin:
$1,431
(% of AGI for various income ranges: 26.4% for AGIs below $25k, 49.4% for AGIs $25k-50k, 57.9% for AGIs $50k-75k, 29.1% for AGIs $75k-100k, 98.9% for AGIs $100k-200k, 583.3% for AGIs over 200k)
Ordinary dividends: $3,521 (reported on 29.1% of returns)
Here:
$3,521
State:
$6,481
(% of AGI for various income ranges: 60.5% for AGIs below $25k, 73.9% for AGIs $25k-50k, 144.3% for AGIs $50k-75k, 162.7% for AGIs $75k-100k, 253.7% for AGIs $100k-200k, 813.3% for AGIs over 200k)
Net capital gain/loss in AGI: +$7,776 (reported on 24.6% of returns)
Here:
+$7,776
State:
+$18,329
(% of AGI for various income ranges: 21.8% for AGIs below $25k, 66.1% for AGIs $25k-50k, 59.3% for AGIs $50k-75k, 158.2% for AGIs $75k-100k, 386.3% for AGIs $100k-200k, 4693.3% for AGIs over 200k)
Profit/loss from business: +$20,222 (reported on 13.4% of returns)
Here:
+$20,222
State:
+$14,562
(% of AGI for various income ranges: 79.1% for AGIs below $25k, 195.6% for AGIs $25k-50k, 283.6% for AGIs $50k-75k, 349.1% for AGIs $75k-100k, 1227.9% for AGIs $100k-200k)
Taxable individual retirement arrangement distribution: $18,558 (reported on 17.9% of returns)
53153:
$18,558
Wisconsin:
$19,348
(% of AGI for various income ranges: 133.2% for AGIs below $25k, 196.1% for AGIs $25k-50k, 406.4% for AGIs $50k-75k, 661.8% for AGIs $75k-100k, 1321.6% for AGIs $100k-200k)
Total itemized deductions: $24,933 (reported on 11.2% of returns)
Here:
$24,933
State:
$33,000
(% of AGI for various income ranges: 620.0% for AGIs $50k-75k, 599.1% for AGIs $75k-100k, 713.7% for AGIs $100k-200k, 2856.7% for AGIs over 200k)
Charity contributions: $6,260 (reported on 7.5% of returns)
Here:
$6,260
State:
$12,044
(% of AGI for various income ranges: 68.6% for AGIs $50k-75k, 125.8% for AGIs $100k-200k, 970.0% for AGIs over 200k)
Taxes paid: $7,520 (reported on 11.2% of returns)
53153:
$7,520
State:
$8,228
(% of AGI for various income ranges: 136.4% for AGIs $50k-75k, 188.2% for AGIs $75k-100k, 248.9% for AGIs $100k-200k, 856.7% for AGIs over 200k)
Earned income credit: $2,122 (reported on 6.7% of returns)
Here:
$2,122
State:
$2,155
(% of AGI for various income ranges: 50.0% for AGIs below $25k, 45.0% for AGIs $25k-50k)
Percentage of individuals using paid preparers for their 2020 taxes: 93.3%
Here:
93%
State:
94%
(% for various income ranges: 90.9% for AGIs below $25k, 95.7% for AGIs $25k-50k, 90.0% for AGIs $50k-75k, 93.8% for AGIs $75k-100k, 93.9% for AGIs $100k-200k, 100.0% for AGIs over 200k)
Averages for the 2012 tax year for zip code 53153, filed in 2013:
Average Adjusted Gross Income (AGI) in 2012: $71,602 (Individual Income Tax Returns)
Here:
$71,602
State:
$57,939
Salary/wage: $63,317 (reported on 85.8% of returns)
Here:
$63,317
State:
$48,248
(% of AGI for various income ranges: 75.5% for AGIs below $25k, 75.2% for AGIs $25k-50k, 73.2% for AGIs $50k-75k, 77.1% for AGIs $75k-100k, 82.9% for AGIs $100k-200k, 66.1% for AGIs over 200k)
Taxable interest for individuals: $743 (reported on 48.0% of returns)
This zip code:
$743
Wisconsin:
$1,224
(% of AGI for various income ranges: 1.3% for AGIs below $25k, 0.7% for AGIs $25k-50k, 0.7% for AGIs $50k-75k, 0.6% for AGIs $75k-100k, 0.3% for AGIs $100k-200k, 0.3% for AGIs over 200k)
Ordinary dividends: $3,568 (reported on 29.1% of returns)
Here:
$3,568
State:
$5,137
(% of AGI for various income ranges: 2.1% for AGIs below $25k, 1.9% for AGIs $25k-50k, 1.2% for AGIs $50k-75k, 1.4% for AGIs $75k-100k, 0.6% for AGIs $100k-200k, 2.7% for AGIs over 200k)
Net capital gain/loss in AGI: +$2,529 (reported on 18.9% of returns)
Here:
+$2,529
State:
+$11,137
(% of AGI for various income ranges: 0.8% for AGIs $50k-75k, 1.5% for AGIs $100k-200k, 0.3% for AGIs over 200k)
Profit/loss from business: +$11,444 (reported on 12.6% of returns)
Here:
+$11,444
State:
+$11,943
(% of AGI for various income ranges: 4.3% for AGIs below $25k, 1.8% for AGIs $25k-50k, 3.1% for AGIs $50k-75k, 1.4% for AGIs $75k-100k, 2.9% for AGIs $100k-200k)
Taxable individual retirement arrangement distribution: $19,594 (reported on 13.4% of returns)
53153:
$19,594
Wisconsin:
$14,087
(% of AGI for various income ranges: 5.0% for AGIs below $25k, 5.3% for AGIs $25k-50k, 3.6% for AGIs $50k-75k, 5.0% for AGIs $75k-100k, 4.9% for AGIs $100k-200k)
Total itemized deductions: $23,486 (21% of AGI, reported on 51.2% of returns)
Here:
$23,486
State:
$22,257
Here:
21.0% of AGI
State:
20.1% of AGI
(% of AGI for various income ranges: 18.5% for AGIs below $25k, 18.1% for AGIs $25k-50k, 16.2% for AGIs $50k-75k, 18.6% for AGIs $75k-100k, 16.8% for AGIs $100k-200k, 15.2% for AGIs over 200k)
Charity contributions: $2,918 (reported on 44.9% of returns)
Here:
$2,918
State:
$3,370
(% of AGI for various income ranges: 1.4% for AGIs below $25k, 1.6% for AGIs $25k-50k, 1.2% for AGIs $50k-75k, 2.2% for AGIs $75k-100k, 1.5% for AGIs $100k-200k, 2.6% for AGIs over 200k)
Taxes paid: $10,762 (reported on 51.2% of returns)
53153:
$10,762
State:
$10,731
(% of AGI for various income ranges: 5.3% for AGIs below $25k, 5.0% for AGIs $25k-50k, 6.7% for AGIs $50k-75k, 8.4% for AGIs $75k-100k, 8.4% for AGIs $100k-200k, 8.1% for AGIs over 200k)
Earned income credit: $1,710 (reported on 7.9% of returns)
Here:
$1,710
State:
$2,094
(% of AGI for various income ranges: 2.9% for AGIs below $25k, 0.6% for AGIs $25k-50k)
Percentage of individuals using paid preparers for their 2012 taxes: 45.7%
Here:
46%
State:
54%
(% for various income ranges: 36.6% for AGIs below $25k, 50.0% for AGIs $25k-50k, 52.6% for AGIs $50k-75k, 43.8% for AGIs $75k-100k, 48.0% for AGIs $100k-200k, 66.7% for AGIs over 200k)
Averages for the 2004 tax year for zip code 53153, filed in 2005:
Average Adjusted Gross Income (AGI) in 2004: $59,816 (Individual Income Tax Returns)
Here:
$59,816
State:
$47,735
Salary/wage: $54,217 (reported on 92.2% of returns)
Here:
$54,217
State:
$41,540
(% of AGI for various income ranges: 127.7% for AGIs below $10k, 71.9% for AGIs $10k-25k, 84.1% for AGIs $25k-50k, 84.2% for AGIs $50k-75k, 87.7% for AGIs $75k-100k, 81.3% for AGIs over 100k)
Taxable interest for individuals: $683 (reported on 62.2% of returns)
This zip code:
$683
Wisconsin:
$1,420
(% of AGI for various income ranges: 3.6% for AGIs below $10k, 1.7% for AGIs $10k-25k, 1.0% for AGIs $25k-50k, 0.6% for AGIs $50k-75k, 0.4% for AGIs $75k-100k, 0.7% for AGIs over 100k)
Taxable dividends: $1,668 (reported on 32.5% of returns)
Here:
$1,668
State:
$2,869
(% of AGI for various income ranges: 0.7% for AGIs below $10k, 0.9% for AGIs $10k-25k, 1.8% for AGIs $25k-50k, 0.5% for AGIs $50k-75k, 0.6% for AGIs $75k-100k, 1.0% for AGIs over 100k)
Net capital gain/loss: +$6,027 (reported on 22.5% of returns)
Here:
+$6,027
State:
+$9,569
(% of AGI for various income ranges: -1.1% for AGIs below $10k, 0.3% for AGIs $10k-25k, -0.3% for AGIs $25k-50k, 0.6% for AGIs $50k-75k, 0.1% for AGIs $75k-100k, 5.0% for AGIs over 100k)
Profit/loss from business: +$12,924 (reported on 13.4% of returns)
Here:
+$12,924
State:
+$10,417
(% of AGI for various income ranges: 5.0% for AGIs $10k-25k, 4.4% for AGIs $25k-50k, 1.9% for AGIs $50k-75k, 1.5% for AGIs $75k-100k, 3.5% for AGIs over 100k)
IRA payment deduction: $2,750 (reported on 2.1% of returns)
53153:
$2,750
Wisconsin:
$2,900
Total itemized deductions: $20,109 (23% of AGI, reported on 55.8% of returns)
Here:
$20,109
State:
$18,160
Here:
22.6% of AGI
State:
21.1% of AGI
(% of AGI for various income ranges: 20.8% for AGIs $10k-25k, 18.1% for AGIs $25k-50k, 20.0% for AGIs $50k-75k, 20.2% for AGIs $75k-100k, 17.9% for AGIs over 100k)
Charity contributions deductions: $2,282 (2% of AGI, reported on 50.1% of returns)
Here:
$2,282
State:
$2,711
Here:
2.5% of AGI
State:
3.0% of AGI
(% of AGI for various income ranges: 1.5% for AGIs $10k-25k, 1.4% for AGIs $25k-50k, 1.4% for AGIs $50k-75k, 1.8% for AGIs $75k-100k, 2.4% for AGIs over 100k)
Total tax: $7,943 (reported on 83.7% of returns)
53153:
$7,943
State:
$7,114
(% of AGI for various income ranges: 2.6% for AGIs below $10k, 5.2% for AGIs $10k-25k, 7.3% for AGIs $25k-50k, 7.4% for AGIs $50k-75k, 8.9% for AGIs $75k-100k, 15.7% for AGIs over 100k)
Earned income credit: $1,739 (reported on 3.9% of returns)
Here:
$1,739
State:
$1,544
Percentage of individuals using paid preparers for their 2004 taxes: 46.4%
Here:
46%
State:
57%
(% for various income ranges: 28.3% for AGIs below $10k, 51.9% for AGIs $10k-25k, 50.2% for AGIs $25k-50k, 49.3% for AGIs $50k-75k, 44.8% for AGIs $75k-100k, 53.9% for AGIs over 100k)
Likely homosexual households (counted as self-reported same-sex unmarried-partner households)
Lesbian couples: 0.2% of all households
Gay men: 0.0% of all households
Household received Food Stamps/SNAP in the past 12 months: 18 Household did not receive Food Stamps/SNAP in the past 12 months: 1,031
Women who had a birth in the past 12 months: 7 (7 now married, 0 unmarried) Women who did not have a birth in the past 12 months: 520 (356 now married, 163 unmarried)
Housing units in zip code 53153 with a mortgage: 776 (168 second mortgage, 154 both second mortgage and home equity loan) Houses without a mortgage: 18
Median monthly owner costs for units with a mortgage: $2,143 Median monthly owner costs for units without a mortgage: $603
Residents with income below the poverty level in 2022:
This zip code:
2.8%
Whole state:
10.7%
Residents with income below 50% of the poverty level in 2022:
This zip code:
1.9%
Whole state:
5.7%
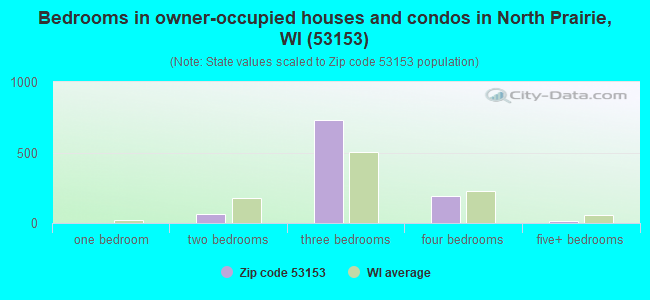
Median number of rooms in houses and condos:
Here:
7.1
State:
6.5
Median number of rooms in apartments:
Here:
4.1
State:
4.1
Notable locations in this zip code not listed on our city pages
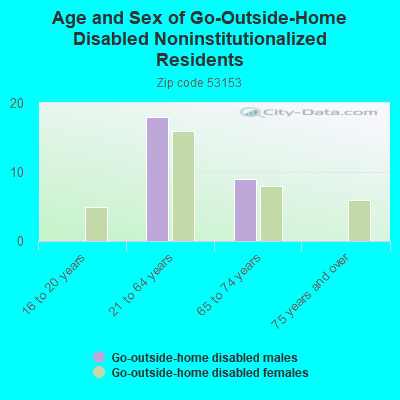
In group quarters: 3 (-1 institutionalized population)
Size of family households: 474 2-persons, 108 3-persons, 203 4-persons, 66 5-persons, 19 6-persons
Size of nonfamily households: 119 1-person, 41 2-persons, 20 3-persons
570 married couples with children.
53 single-parent households (46 men, 7 women).
98.5% of residents of 53153 zip code speak English at home.
0.9% of residents speak Spanish at home (76% very well, 24% well).
0.2% of residents speak other Indo-European language at home (50% very well, 50% not well).
0.2% of residents speak Asian or Pacific Island language at home (100% very well).
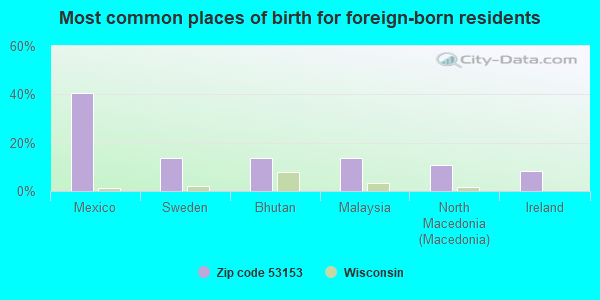
Foreign born population: 37 (1.4%) (84.2% of them are naturalized citizens)
This zip code:
1.4%
Whole state:
5.0%
41%Mexico
14%Sweden
14%Bhutan
14%Malaysia
11%North Macedonia (Macedonia)
8%Ireland
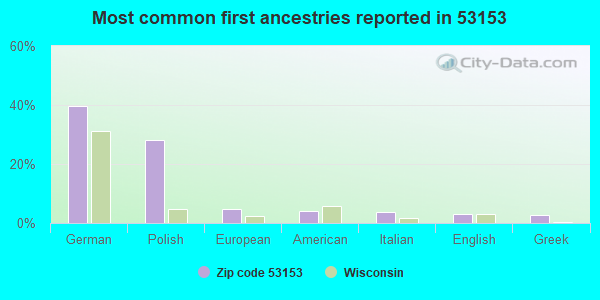
40%German
28%Polish
5%European
4%American
4%Italian
3%English
3%Greek
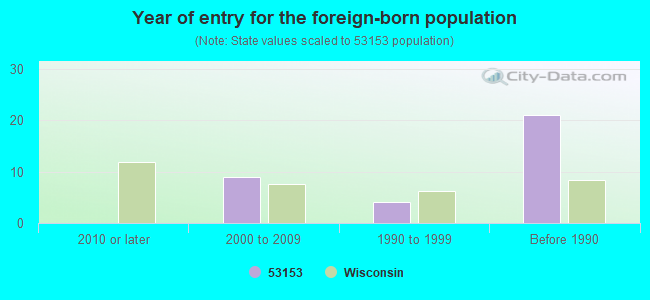
Year of entry for the foreign-born population
02010 or later
92000 to 2009
41990 to 1999
21Before 1990
Facilities with environmental interests located in this zip code:
BILLS SELF SERVICE & MINI MART (102 E STATE RD (HWY 59& E) in NORTH PRAIRIE, WI)
Small Quantity Generators, between 100 kg and 1000 kg of hazardous waste/month (Resource Conservation and Recovery Act (tracking hazardous waste)) - notification STATE MASTER (Wisconsin database) - SDWIS-WI2680751, DRINKING WATER SYSTEM Organizations: BILLS SELF SVC (CONTACT/OWNER)
Alternative names: BILLS SELF SVC
87.7%Utility gas
6.8%Electricity
4.8%Fuel oil, kerosene, etc.
Population in 1990: 1,732. Population change in the 1990s: +234 (+13.5%).
Place of birth for U.S.-born residents:
This state: 2,162
Northeast: 66
Midwest: 332
South: 37
West: 105
73% of the 53153 zip code residents lived in the same house 5 years ago. Out of people who lived in different houses, 66% lived in this county. Out of people who lived in different counties, 50% lived in Wisconsin.
96% of the 53153 zip code residents lived in the same house 1 year ago. Out of people who lived in different houses, 73% moved from this county. Out of people who lived in different houses, 8% moved from different county within same state. Out of people who lived in different houses, 18% moved from different state.
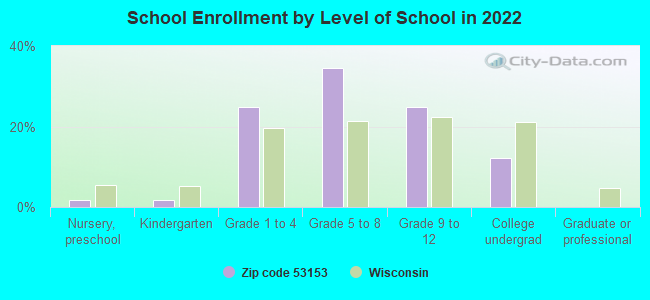
Private vs. public school enrollment:
Students in private schools in grades 1 to 8 (elementary and middle school): 8
Here:
2.1%
Wisconsin:
16.7%
Students in private schools in grades 9 to 12 (high school): 5
Here:
3.4%
Wisconsin:
12.5%
Students in private undergraduate colleges: 19
Here:
22.6%
Wisconsin:
17.5%
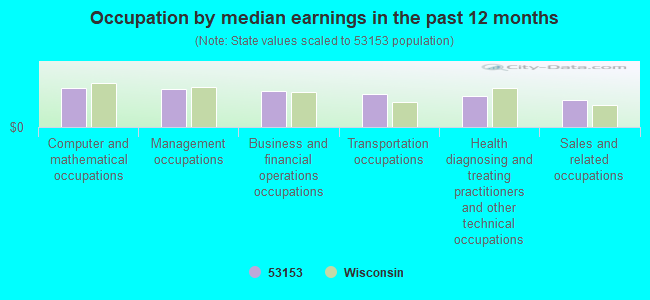
Occupation by median earnings in the past 12 months ($)
94,307Computer and mathematical occupations
92,540Management occupations
87,635Business and financial operations occupations
79,770Transportation occupations
74,205Health diagnosing and treating practitioners and other technical occupations
64,712Sales and related occupations
Top industries in this zip code by the number of employees in 2005:
Other Services (except Public Administration): Religious Organizations (20-49 employees: 1 establishment, 1-4 employees: 3 establishments)
Arts, Entertainment, and Recreation: Golf Courses and Country Clubs (20-49: 1)
Professional, Scientific, and Technical Services: Veterinary Services (20-49: 1)
Health Care and Social Assistance: Child Day Care Services (10-19: 1, 1-4: 1)
Construction: Water and Sewer Line and Related Structures Construction (10-19: 1, 1-4: 1)
People in group quarters in 2010:
4 people in group homes intended for adults
Home Mortgage Disclosure Act Aggregated Statistics For Year 2009 (Based on 2 partial tracts)
A) FHA, FSA/RHS & VA Home Purchase Loans
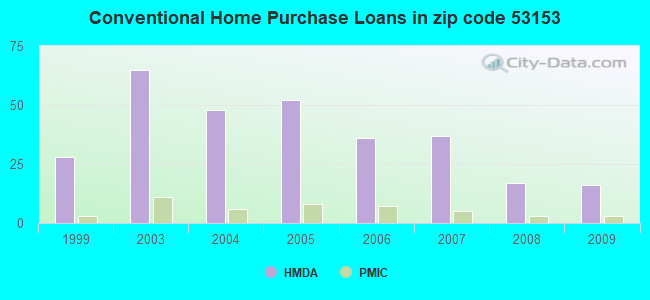
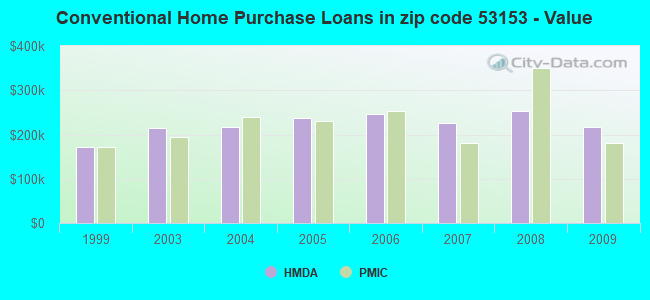
B) Conventional Home Purchase Loans
C) Refinancings
D) Home Improvement Loans
F) Non-occupant Loans on < 5 Family Dwellings (A B C & D)
Number
Average Value
Number
Average Value
Number
Average Value
Number
Average Value
Number
Average Value
LOANS ORIGINATED
8
$237,150
16
$217,997
179
$213,855
13
$81,538
3
$224,063
APPLICATIONS APPROVED, NOT ACCEPTED
1
$135,350
0
$0
8
$217,189
2
$103,035
0
$0
APPLICATIONS DENIED
2
$163,865
0
$0
27
$275,011
1
$36,500
0
$0
APPLICATIONS WITHDRAWN
0
$0
1
$227,360
22
$238,904
2
$143,335
0
$0
FILES CLOSED FOR INCOMPLETENESS
0
$0
0
$0
10
$244,088
0
$0
0
$0
Aggregated Statistics For Year 2008 (Based on 2 partial tracts)
A) FHA, FSA/RHS & VA Home Purchase Loans
B) Conventional Home Purchase Loans
C) Refinancings
D) Home Improvement Loans
F) Non-occupant Loans on < 5 Family Dwellings (A B C & D)
Number
Average Value
Number
Average Value
Number
Average Value
Number
Average Value
Number
Average Value
LOANS ORIGINATED
5
$251,388
17
$253,750
71
$192,092
9
$67,844
1
$93,530
APPLICATIONS APPROVED, NOT ACCEPTED
2
$191,240
5
$175,652
9
$186,382
2
$83,645
0
$0
APPLICATIONS DENIED
1
$193,140
3
$375,383
14
$173,697
1
$189,340
1
$191,620
APPLICATIONS WITHDRAWN
0
$0
4
$189,910
17
$217,966
0
$0
2
$88,965
FILES CLOSED FOR INCOMPLETENESS
0
$0
1
$228,120
2
$188,580
0
$0
0
$0
Aggregated Statistics For Year 2007 (Based on 2 partial tracts)
A) FHA, FSA/RHS & VA Home Purchase Loans
B) Conventional Home Purchase Loans
C) Refinancings
D) Home Improvement Loans
E) Loans on Dwellings For 5+ Families
F) Non-occupant Loans on < 5 Family Dwellings (A B C & D)
Number
Average Value
Number
Average Value
Number
Average Value
Number
Average Value
Number
Average Value
Number
Average Value
LOANS ORIGINATED
1
$98,850
37
$225,736
85
$202,794
14
$62,244
1
$1,531,450
6
$172,103
APPLICATIONS APPROVED, NOT ACCEPTED
0
$0
3
$210,123
11
$286,325
1
$38,020
0
$0
1
$127,750
APPLICATIONS DENIED
0
$0
4
$109,878
27
$228,937
3
$132,817
0
$0
5
$143,868
APPLICATIONS WITHDRAWN
1
$98,850
6
$228,627
23
$192,943
1
$26,610
0
$0
2
$99,995
FILES CLOSED FOR INCOMPLETENESS
0
$0
1
$95,050
4
$270,322
0
$0
0
$0
0
$0
Aggregated Statistics For Year 2006 (Based on 2 partial tracts)
A) FHA, FSA/RHS & VA Home Purchase Loans
B) Conventional Home Purchase Loans
C) Refinancings
D) Home Improvement Loans
F) Non-occupant Loans on < 5 Family Dwellings (A B C & D)
Number
Average Value
Number
Average Value
Number
Average Value
Number
Average Value
Number
Average Value
LOANS ORIGINATED
1
$147,520
36
$245,989
76
$177,563
11
$51,707
5
$219,148
APPLICATIONS APPROVED, NOT ACCEPTED
0
$0
2
$165,765
12
$203,851
5
$15,816
0
$0
APPLICATIONS DENIED
0
$0
5
$175,804
29
$173,660
3
$74,013
1
$11,410
APPLICATIONS WITHDRAWN
0
$0
1
$49,430
23
$207,259
2
$41,820
1
$364,990
FILES CLOSED FOR INCOMPLETENESS
0
$0
0
$0
11
$169,155
0
$0
0
$0
Aggregated Statistics For Year 2005 (Based on 2 partial tracts)
A) FHA, FSA/RHS & VA Home Purchase Loans
B) Conventional Home Purchase Loans
C) Refinancings
D) Home Improvement Loans
F) Non-occupant Loans on < 5 Family Dwellings (A B C & D)
Number
Average Value
Number
Average Value
Number
Average Value
Number
Average Value
Number
Average Value
LOANS ORIGINATED
1
$208,350
52
$238,327
98
$194,290
14
$53,119
4
$202,268
APPLICATIONS APPROVED, NOT ACCEPTED
0
$0
7
$282,651
8
$118,148
2
$260,055
2
$619,725
APPLICATIONS DENIED
0
$0
5
$155,274
27
$196,746
2
$13,685
0
$0
APPLICATIONS WITHDRAWN
1
$127,750
4
$249,602
17
$169,345
1
$102,650
2
$138,395
FILES CLOSED FOR INCOMPLETENESS
0
$0
0
$0
16
$222,559
2
$17,110
0
$0
Aggregated Statistics For Year 2004 (Based on 2 partial tracts)
A) FHA, FSA/RHS & VA Home Purchase Loans
B) Conventional Home Purchase Loans
C) Refinancings
D) Home Improvement Loans
E) Loans on Dwellings For 5+ Families
F) Non-occupant Loans on < 5 Family Dwellings (A B C & D)
Number
Average Value
Number
Average Value
Number
Average Value
Number
Average Value
Number
Average Value
Number
Average Value
LOANS ORIGINATED
0
$0
48
$216,920
132
$190,215
10
$56,726
1
$1,097,260
6
$161,585
APPLICATIONS APPROVED, NOT ACCEPTED
0
$0
2
$174,130
13
$294,743
2
$23,190
0
$0
2
$117,100
APPLICATIONS DENIED
0
$0
4
$188,390
27
$219,868
1
$3,800
0
$0
1
$38,020
APPLICATIONS WITHDRAWN
1
$133,070
2
$271,465
17
$147,294
0
$0
0
$0
0
$0
FILES CLOSED FOR INCOMPLETENESS
0
$0
1
$113,300
14
$226,599
2
$7,605
0
$0
0
$0
Aggregated Statistics For Year 2003 (Based on 2 partial tracts)
A) FHA, FSA/RHS & VA Home Purchase Loans
B) Conventional Home Purchase Loans
C) Refinancings
D) Home Improvement Loans
F) Non-occupant Loans on < 5 Family Dwellings (A B C & D)
Number
Average Value
Number
Average Value
Number
Average Value
Number
Average Value
Number
Average Value
LOANS ORIGINATED
2
$131,550
65
$215,240
285
$152,710
22
$34,944
2
$213,290
APPLICATIONS APPROVED, NOT ACCEPTED
0
$0
5
$108,280
24
$145,015
2
$11,405
0
$0
APPLICATIONS DENIED
0
$0
4
$148,658
33
$161,758
2
$43,725
2
$273,365
APPLICATIONS WITHDRAWN
1
$97,330
4
$190,480
17
$164,202
1
$15,970
1
$121,660
FILES CLOSED FOR INCOMPLETENESS
0
$0
1
$162,730
2
$141,815
1
$19,010
0
$0
Aggregated Statistics For Year 1999 (Based on 1 partial tract)
B) Conventional Home Purchase Loans
C) Refinancings
D) Home Improvement Loans
F) Non-occupant Loans on < 5 Family Dwellings (A B C & D)
Detailed PMIC statistics for the following Tracts:2038.03
2003 - 2018 National Fire Incident Reporting System (NFIRS) incidents
According to the data from the years 2003 - 2018 the average number of fire incidents per year is 10. The highest number of reported fires - 39 took place in 2014, and the least - 0 in 2006. The data has a rising trend.
When looking into fire subcategories, the most incidents belonged to: Structure Fires (68.6%), and Outside Fires (22.6%).
Fire incident types reported to NFIRS in Zip Code 53153

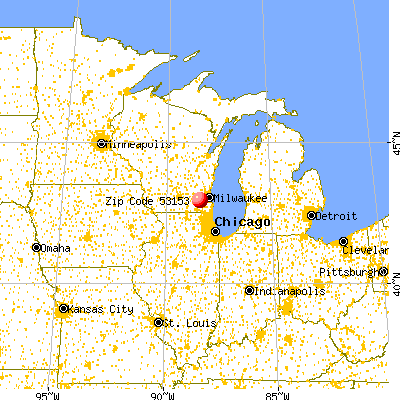


 Nearest zip codes: 53183, 53149, 53119, 53118, 53018, 53189.


 According to the data from the years 2003 - 2018 the average number of fire incidents per year is 10. The highest number of reported fires - 39 took place in 2014, and the least - 0 in 2006. The data has a rising trend.
 When looking into fire subcategories, the most incidents belonged to: Structure Fires (68.6%), and Outside Fires (22.6%).