Estimated zip code population in 2022: 2,452 Zip code population in 2010: 2,573 Zip code population in 2000: 2,002
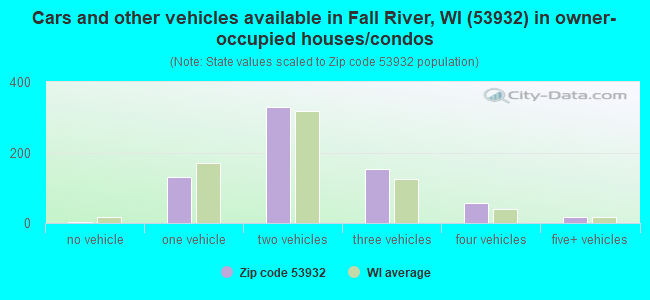
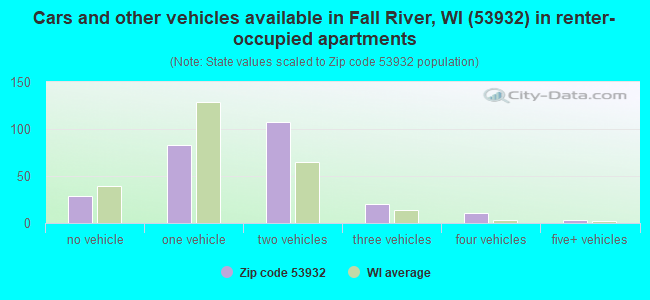
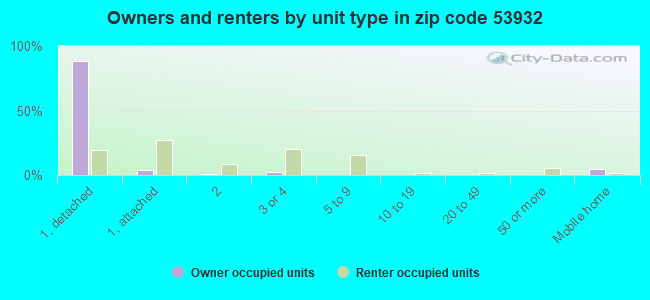
Houses and condos: 1,015 Renter-occupied apartments: 256
% of renters here:
27%
State:
32%
March 2022 cost of living index in zip code 53932: 94.3 (less than average, U.S. average is 100)
Land area: 37.1 sq. mi. Water area: 0.6 sq. mi.
Population density: 66 people per square mile
(very low).
OSM Map
General Map
Google Map
MSN Map
OSM Map
General Map
Google Map
MSN Map
OSM Map
General Map
Google Map
MSN Map
OSM Map
General Map
Google Map
MSN Map
Please wait while loading the map...
Real estate property taxes paid for housing units in 2022:
This zip code:
1.2% ($3,559)
Wisconsin:
1.4% ($3,497)
Median real estate property taxes paid for housing units with mortgages in 2022: $3,700 (1.3%) Median real estate property taxes paid for housing units with no mortgage in 2022: $3,109 (1.1%)
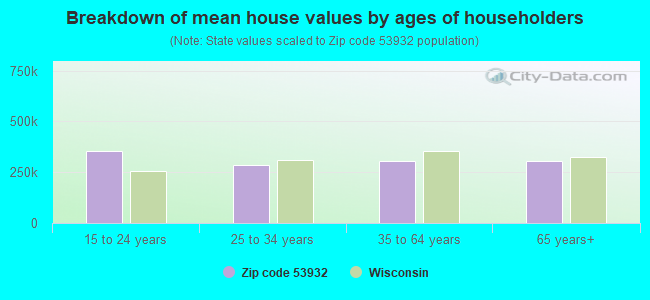
Estimated median house/condo value in 2022: $285,465
53932:
$285,465
Wisconsin:
$252,800
According to our research of Wisconsin and other state lists, there were 3 registered sex offenders living in 53932 zip code as of May 28, 2024. The ratio of all residents to sex offenders in zip code 53932 is 824 to 1. The ratio of registered sex offenders to all residents in this zip code is lower than the state average.
Median resident age:
This zip code:
37.7 years
Wisconsin median age:
40.4 years
Average household size:
This zip code:
2.6 people
Wisconsin:
2.3 people
Averages for the 2020 tax year for zip code 53932, filed in 2021:
Average Adjusted Gross Income (AGI) in 2020: $67,574 (Individual Income Tax Returns)
Here:
$67,574
State:
$72,319
Salary/wage: $59,988 (reported on 86.4% of returns)
Here:
$59,988
State:
$59,242
(% of AGI for various income ranges: 1225.0% for AGIs below $25k, 3838.9% for AGIs $25k-50k, 6731.2% for AGIs $50k-75k, 10325.0% for AGIs $75k-100k, 18674.4% for AGIs $100k-200k)
Taxable interest for individuals: $714 (reported on 40.0% of returns)
This zip code:
$714
Wisconsin:
$1,431
(% of AGI for various income ranges: 20.0% for AGIs below $25k, 20.0% for AGIs $25k-50k, 14.1% for AGIs $50k-75k, 20.0% for AGIs $75k-100k, 128.1% for AGIs $100k-200k)
Ordinary dividends: $2,817 (reported on 20.7% of returns)
Here:
$2,817
State:
$6,481
(% of AGI for various income ranges: 15.5% for AGIs below $25k, 33.2% for AGIs $25k-50k, 64.7% for AGIs $50k-75k, 76.0% for AGIs $75k-100k, 315.0% for AGIs $100k-200k)
Net capital gain/loss in AGI: +$13,963 (reported on 19.3% of returns)
Here:
+$13,963
State:
+$18,329
(% of AGI for various income ranges: 26.8% for AGIs below $25k, 16.4% for AGIs $25k-50k, 110.0% for AGIs $50k-75k, 176.0% for AGIs $75k-100k, 736.2% for AGIs $100k-200k)
Profit/loss from business: +$10,522 (reported on 12.9% of returns)
Here:
+$10,522
State:
+$14,562
(% of AGI for various income ranges: 90.0% for AGIs below $25k, 71.4% for AGIs $25k-50k, 121.2% for AGIs $50k-75k, 419.0% for AGIs $75k-100k, 544.4% for AGIs $100k-200k)
Taxable individual retirement arrangement distribution: $14,693 (reported on 10.7% of returns)
53932:
$14,693
Wisconsin:
$19,348
(% of AGI for various income ranges: 157.7% for AGIs below $25k, 132.9% for AGIs $25k-50k, 149.4% for AGIs $50k-75k, 448.0% for AGIs $75k-100k, 489.4% for AGIs $100k-200k)
Total itemized deductions: $27,310 (reported on 7.1% of returns)
Here:
$27,310
State:
$33,000
(% of AGI for various income ranges: 734.7% for AGIs $50k-75k, 926.2% for AGIs $100k-200k)
Charity contributions: $5,900 (reported on 5.0% of returns)
Here:
$5,900
State:
$12,044
(% of AGI for various income ranges: 35.9% for AGIs $50k-75k, 220.0% for AGIs $100k-200k)
Taxes paid: $8,756 (reported on 6.4% of returns)
53932:
$8,756
State:
$8,228
(% of AGI for various income ranges: 220.6% for AGIs $50k-75k, 258.1% for AGIs $100k-200k)
Earned income credit: $2,086 (reported on 10.0% of returns)
Here:
$2,086
State:
$2,155
(% of AGI for various income ranges: 72.3% for AGIs below $25k, 47.5% for AGIs $25k-50k)
Percentage of individuals using paid preparers for their 2020 taxes: 95.7%
Here:
96%
State:
94%
(% for various income ranges: 94.3% for AGIs below $25k, 94.4% for AGIs $25k-50k, 95.7% for AGIs $50k-75k, 100.0% for AGIs $75k-100k, 96.3% for AGIs $100k-200k, 100.0% for AGIs over 200k)
Averages for the 2012 tax year for zip code 53932, filed in 2013:
Average Adjusted Gross Income (AGI) in 2012: $53,834 (Individual Income Tax Returns)
Here:
$53,834
State:
$57,939
Salary/wage: $46,382 (reported on 89.1% of returns)
Here:
$46,382
State:
$48,248
(% of AGI for various income ranges: 76.7% for AGIs below $25k, 82.2% for AGIs $25k-50k, 80.2% for AGIs $50k-75k, 84.9% for AGIs $75k-100k, 67.3% for AGIs $100k-200k)
Taxable interest for individuals: $558 (reported on 39.1% of returns)
This zip code:
$558
Wisconsin:
$1,224
(% of AGI for various income ranges: 1.1% for AGIs below $25k, 0.7% for AGIs $25k-50k, 0.4% for AGIs $50k-75k, 0.3% for AGIs $75k-100k, 0.2% for AGIs $100k-200k)
Ordinary dividends: $1,557 (reported on 18.0% of returns)
Here:
$1,557
State:
$5,137
(% of AGI for various income ranges: 1.4% for AGIs below $25k, 0.5% for AGIs $25k-50k, 0.3% for AGIs $50k-75k, 0.2% for AGIs $75k-100k, 0.7% for AGIs $100k-200k)
Net capital gain/loss in AGI: +$6,188 (reported on 13.3% of returns)
Here:
+$6,188
State:
+$11,137
(% of AGI for various income ranges: 1.0% for AGIs $25k-50k, 0.3% for AGIs $50k-75k, 3.8% for AGIs $100k-200k)
Profit/loss from business: +$5,081 (reported on 12.5% of returns)
Here:
+$5,081
State:
+$11,943
(% of AGI for various income ranges: 3.8% for AGIs below $25k, 0.9% for AGIs $25k-50k, 1.0% for AGIs $50k-75k, 1.1% for AGIs $75k-100k, 1.0% for AGIs $100k-200k)
Taxable individual retirement arrangement distribution: $11,392 (reported on 9.4% of returns)
53932:
$11,392
Wisconsin:
$14,087
(% of AGI for various income ranges: 5.7% for AGIs below $25k, 2.5% for AGIs $25k-50k, 1.7% for AGIs $50k-75k, 3.9% for AGIs $75k-100k)
Total itemized deductions: $20,275 (23% of AGI, reported on 39.8% of returns)
Here:
$20,275
State:
$22,257
Here:
23.1% of AGI
State:
20.1% of AGI
(% of AGI for various income ranges: 11.7% for AGIs below $25k, 10.2% for AGIs $25k-50k, 14.7% for AGIs $50k-75k, 16.7% for AGIs $75k-100k, 17.3% for AGIs $100k-200k)
Charity contributions: $2,331 (reported on 30.5% of returns)
Here:
$2,331
State:
$3,370
(% of AGI for various income ranges: 0.4% for AGIs below $25k, 1.1% for AGIs $25k-50k, 1.0% for AGIs $50k-75k, 1.2% for AGIs $75k-100k, 1.8% for AGIs $100k-200k)
Taxes paid: $8,863 (reported on 39.8% of returns)
53932:
$8,863
State:
$10,731
(% of AGI for various income ranges: 2.7% for AGIs below $25k, 3.6% for AGIs $25k-50k, 5.6% for AGIs $50k-75k, 8.2% for AGIs $75k-100k, 8.4% for AGIs $100k-200k)
Earned income credit: $1,924 (reported on 13.3% of returns)
Here:
$1,924
State:
$2,094
(% of AGI for various income ranges: 4.6% for AGIs below $25k, 0.8% for AGIs $25k-50k)
Percentage of individuals using paid preparers for their 2012 taxes: 58.6%
Here:
59%
State:
54%
(% for various income ranges: 60.0% for AGIs below $25k, 57.6% for AGIs $25k-50k, 56.5% for AGIs $50k-75k, 62.5% for AGIs $75k-100k, 56.2% for AGIs $100k-200k)
Averages for the 2004 tax year for zip code 53932, filed in 2005:
Average Adjusted Gross Income (AGI) in 2004: $44,198 (Individual Income Tax Returns)
Here:
$44,198
State:
$47,735
Salary/wage: $41,300 (reported on 88.5% of returns)
Here:
$41,300
State:
$41,540
(% of AGI for various income ranges: 124.6% for AGIs below $10k, 78.7% for AGIs $10k-25k, 83.4% for AGIs $25k-50k, 92.1% for AGIs $50k-75k, 90.9% for AGIs $75k-100k, 60.0% for AGIs over 100k)
Taxable interest for individuals: $1,000 (reported on 52.9% of returns)
This zip code:
$1,000
Wisconsin:
$1,420
(% of AGI for various income ranges: 10.5% for AGIs below $10k, 2.7% for AGIs $10k-25k, 1.1% for AGIs $25k-50k, 0.3% for AGIs $50k-75k, 0.4% for AGIs $75k-100k, 2.2% for AGIs over 100k)
Taxable dividends: $1,635 (reported on 21.8% of returns)
Here:
$1,635
State:
$2,869
(% of AGI for various income ranges: 1.0% for AGIs below $10k, 1.0% for AGIs $10k-25k, 0.4% for AGIs $25k-50k, 0.1% for AGIs $50k-75k, 0.5% for AGIs $75k-100k, 2.4% for AGIs over 100k)
Net capital gain/loss: +$6,967 (reported on 16.7% of returns)
Here:
+$6,967
State:
+$9,569
(% of AGI for various income ranges: 14.0% for AGIs below $10k, 0.7% for AGIs $10k-25k, 1.4% for AGIs $25k-50k, 0.3% for AGIs $50k-75k, 0.8% for AGIs $75k-100k, 9.0% for AGIs over 100k)
Profit/loss from business: +$5,123 (reported on 14.8% of returns)
Here:
+$5,123
State:
+$10,417
(% of AGI for various income ranges: -1.7% for AGIs below $10k, 2.5% for AGIs $10k-25k, 3.4% for AGIs $25k-50k, 1.4% for AGIs $50k-75k, -0.1% for AGIs $75k-100k, 1.8% for AGIs over 100k)
Profit/loss from farming: +$1,046 (reported on 5.9% of returns)
Here:
+$1,046
State:
-$2,654
(% of AGI for various income ranges: 12.5% for AGIs below $10k, -0.2% for AGIs $25k-50k, -0.2% for AGIs $50k-75k, 0.4% for AGIs $75k-100k)
IRA payment deduction: $3,176 (reported on 1.5% of returns)
53932:
$3,176
Wisconsin:
$2,900
Total itemized deductions: $17,752 (25% of AGI, reported on 40.3% of returns)
Here:
$17,752
State:
$18,160
Here:
25.4% of AGI
State:
21.1% of AGI
(% of AGI for various income ranges: 37.6% for AGIs below $10k, 5.2% for AGIs $10k-25k, 12.8% for AGIs $25k-50k, 17.2% for AGIs $50k-75k, 17.0% for AGIs $75k-100k, 20.5% for AGIs over 100k)
Charity contributions deductions: $2,072 (3% of AGI, reported on 32.7% of returns)
Here:
$2,072
State:
$2,711
Here:
2.9% of AGI
State:
3.0% of AGI
(% of AGI for various income ranges: 2.5% for AGIs below $10k, 0.6% for AGIs $10k-25k, 1.0% for AGIs $25k-50k, 1.3% for AGIs $50k-75k, 1.2% for AGIs $75k-100k, 3.0% for AGIs over 100k)
Total tax: $4,864 (reported on 81.9% of returns)
53932:
$4,864
State:
$7,114
(% of AGI for various income ranges: 3.3% for AGIs below $10k, 4.6% for AGIs $10k-25k, 7.2% for AGIs $25k-50k, 7.8% for AGIs $50k-75k, 9.0% for AGIs $75k-100k, 14.7% for AGIs over 100k)
Earned income credit: $1,596 (reported on 9.4% of returns)
Here:
$1,596
State:
$1,544
Percentage of individuals using paid preparers for their 2004 taxes: 59.7%
Here:
60%
State:
57%
(% for various income ranges: 51.3% for AGIs below $10k, 61.2% for AGIs $10k-25k, 64.3% for AGIs $25k-50k, 59.1% for AGIs $50k-75k, 57.5% for AGIs $75k-100k, 61.9% for AGIs over 100k)
Likely homosexual households (counted as self-reported same-sex unmarried-partner households)
Lesbian couples: 0.4% of all households
Gay men: 0.0% of all households
Household received Food Stamps/SNAP in the past 12 months: 111 Household did not receive Food Stamps/SNAP in the past 12 months: 835
Women who had a birth in the past 12 months: 29 (22 now married, 6 unmarried) Women who did not have a birth in the past 12 months: 493 (265 now married, 228 unmarried)
Housing units in zip code 53932 with a mortgage: 485 (86 second mortgage, 71 both second mortgage and home equity loan) Houses without a mortgage: 13
Median monthly owner costs for units with a mortgage: $1,676 Median monthly owner costs for units without a mortgage: $638
Residents with income below the poverty level in 2022:
This zip code:
8.2%
Whole state:
10.7%
Residents with income below 50% of the poverty level in 2022:
This zip code:
4.4%
Whole state:
5.7%
Median number of rooms in houses and condos:
Here:
6.9
State:
6.5
Median number of rooms in apartments:
Here:
4.6
State:
4.1
Notable locations in this zip code not listed on our city pages
Size of family households: 252 2-persons, 160 3-persons, 127 4-persons, 71 5-persons, 18 6-persons, 20 7-or-more-persons
Size of nonfamily households: 251 1-person, 40 2-persons
499 married couples with children.
121 single-parent households (55 men, 66 women).
94.6% of residents of 53932 zip code speak English at home.
4.1% of residents speak Spanish at home (68% very well, 32% not well).
0.2% of residents speak other Indo-European language at home (100% very well).
0.3% of residents speak Asian or Pacific Island language at home (100% well).
Foreign born population: 56 (2.3%) (42.2% of them are naturalized citizens)
This zip code:
2.3%
Whole state:
5.0%
57%Guatemala
18%Korea
7%France
7%Uganda
2%Honduras
2%Chile
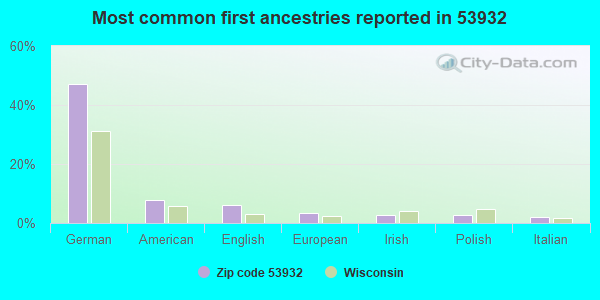
47%German
8%American
6%English
3%European
3%Irish
3%Polish
2%Italian
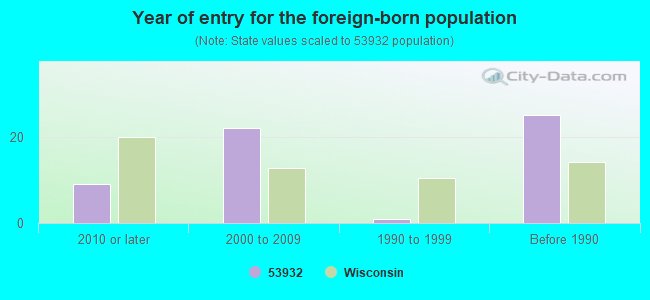
Year of entry for the foreign-born population
92010 or later
222000 to 2009
11990 to 1999
25Before 1990
Housing units lacking complete plumbing facilities: 0.6% Housing units lacking complete kitchen facilities: 3.0%
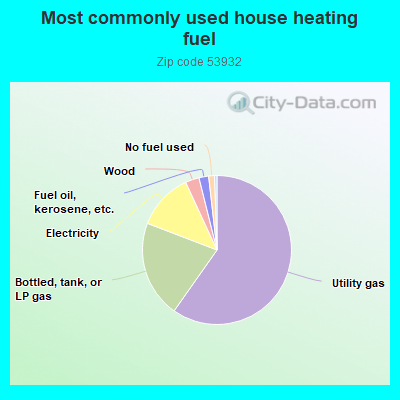
59.9%Utility gas
21.1%Bottled, tank, or LP gas
12.3%Electricity
3.0%Wood
2.1%Fuel oil, kerosene, etc.
1.3%No fuel used
0.5%Other fuel
Population in 1990: 1,996. Population change in the 1990s: +6 (+0.3%).
Place of birth for U.S.-born residents:
This state: 2,058
Northeast: 14
Midwest: 190
South: 59
West: 62
56% of the 53932 zip code residents lived in the same house 5 years ago. Out of people who lived in different houses, 56% lived in this county. Out of people who lived in different counties, 50% lived in Wisconsin.
91% of the 53932 zip code residents lived in the same house 1 year ago. Out of people who lived in different houses, 32% moved from this county. Out of people who lived in different houses, 62% moved from different county within same state. Out of people who lived in different houses, 3% moved from different state. Out of people who lived in different houses, 4% moved from abroad.
Private vs. public school enrollment:
Students in private schools in grades 1 to 8 (elementary and middle school): 42
Here:
14.3%
Wisconsin:
16.7%
Students in private schools in grades 9 to 12 (high school): 27
Here:
17.1%
Wisconsin:
12.5%
Students in private undergraduate colleges:
Here:
0.0%
Wisconsin:
17.5%
Occupation by median earnings in the past 12 months ($)
88,794Architecture and engineering occupations
85,182Computer and mathematical occupations
81,306Management occupations
72,903Health diagnosing and treating practitioners and other technical occupations
67,121Community and social service occupations
65,688Life, physical, and social science occupations
Top industries in this zip code by the number of employees in 2005:
Administrative and Support and Waste Management and Remediation Services: Professional Employer Organizations (50-99 employees: 1 establishment)
Administrative and Support and Waste Management and Remediation Services: All Other Support Services (20-49: 1)
Construction: Plumbing, Heating, and Air-Conditioning Contractors (5-9: 2, 1-4: 1)
Construction: Electrical Contractors (10-19: 1)
Fatal accident statistics in 2013:
Fatal accident count: 1
Vehicles involved in fatal accidents: 2
Fatal accidents caused by drunken drivers: 0
Fatalities: 1
Persons involved in fatal accidents: 6
Pedestrians involved in fatal accidents: 0
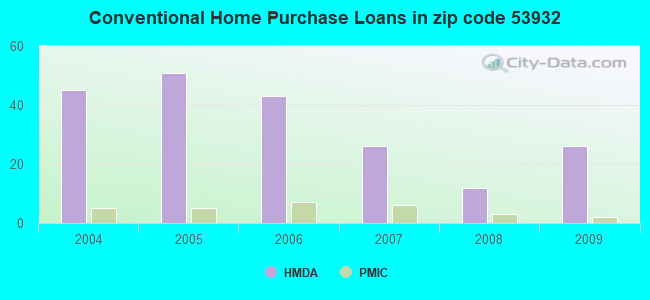
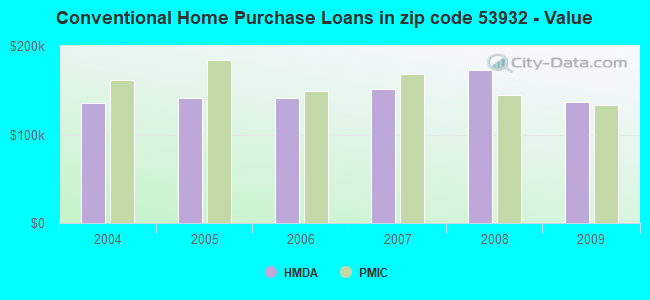
Home Mortgage Disclosure Act Aggregated Statistics For Year 2009 (Based on 2 partial tracts)
A) FHA, FSA/RHS & VA Home Purchase Loans
B) Conventional Home Purchase Loans
C) Refinancings
D) Home Improvement Loans
E) Loans on Dwellings For 5+ Families
F) Non-occupant Loans on < 5 Family Dwellings (A B C & D)
G) Loans On Manufactured Home Dwelling (A B C & D)
Number
Average Value
Number
Average Value
Number
Average Value
Number
Average Value
Number
Average Value
Number
Average Value
Number
Average Value
LOANS ORIGINATED
9
$152,474
26
$136,930
122
$171,334
17
$83,753
0
$0
12
$102,491
1
$18,310
APPLICATIONS APPROVED, NOT ACCEPTED
0
$0
3
$154,357
7
$209,890
0
$0
0
$0
1
$46,100
1
$12,200
APPLICATIONS DENIED
2
$138,310
3
$60,567
26
$183,947
2
$18,985
1
$305,100
2
$110,855
1
$21,700
APPLICATIONS WITHDRAWN
1
$120,680
1
$94,920
21
$168,080
1
$2,030
0
$0
0
$0
0
$0
FILES CLOSED FOR INCOMPLETENESS
0
$0
0
$0
3
$265,097
0
$0
0
$0
0
$0
0
$0
Aggregated Statistics For Year 2008 (Based on 2 partial tracts)
A) FHA, FSA/RHS & VA Home Purchase Loans
B) Conventional Home Purchase Loans
C) Refinancings
D) Home Improvement Loans
E) Loans on Dwellings For 5+ Families
F) Non-occupant Loans on < 5 Family Dwellings (A B C & D)
G) Loans On Manufactured Home Dwelling (A B C & D)
Number
Average Value
Number
Average Value
Number
Average Value
Number
Average Value
Number
Average Value
Number
Average Value
Number
Average Value
LOANS ORIGINATED
1
$208,820
12
$173,116
75
$161,744
14
$56,516
2
$579,010
8
$180,856
1
$123,400
APPLICATIONS APPROVED, NOT ACCEPTED
0
$0
1
$389,850
8
$170,856
1
$10,170
0
$0
0
$0
0
$0
APPLICATIONS DENIED
1
$108,480
1
$44,070
27
$174,623
3
$195,037
0
$0
0
$0
1
$32,540
APPLICATIONS WITHDRAWN
0
$0
1
$339,000
11
$206,235
1
$200,690
0
$0
0
$0
0
$0
FILES CLOSED FOR INCOMPLETENESS
0
$0
1
$240,010
5
$241,368
1
$65,090
0
$0
0
$0
0
$0
Aggregated Statistics For Year 2007 (Based on 2 partial tracts)
B) Conventional Home Purchase Loans
C) Refinancings
D) Home Improvement Loans
F) Non-occupant Loans on < 5 Family Dwellings (A B C & D)
G) Loans On Manufactured Home Dwelling (A B C & D)
Number
Average Value
Number
Average Value
Number
Average Value
Number
Average Value
Number
Average Value
LOANS ORIGINATED
26
$151,742
63
$147,621
22
$41,666
4
$154,922
1
$22,370
APPLICATIONS APPROVED, NOT ACCEPTED
5
$90,716
14
$121,023
1
$23,050
1
$7,460
0
$0
APPLICATIONS DENIED
7
$83,587
41
$140,214
9
$60,191
0
$0
5
$59,258
APPLICATIONS WITHDRAWN
2
$147,465
24
$159,867
3
$82,037
4
$180,348
1
$14,240
FILES CLOSED FOR INCOMPLETENESS
1
$99,670
1
$78,650
0
$0
0
$0
0
$0
Aggregated Statistics For Year 2006 (Based on 2 partial tracts)
A) FHA, FSA/RHS & VA Home Purchase Loans
B) Conventional Home Purchase Loans
C) Refinancings
D) Home Improvement Loans
F) Non-occupant Loans on < 5 Family Dwellings (A B C & D)
G) Loans On Manufactured Home Dwelling (A B C & D)
Number
Average Value
Number
Average Value
Number
Average Value
Number
Average Value
Number
Average Value
Number
Average Value
LOANS ORIGINATED
1
$237,980
43
$141,087
69
$130,648
16
$34,027
9
$162,720
1
$20,340
APPLICATIONS APPROVED, NOT ACCEPTED
0
$0
3
$129,723
10
$140,346
1
$37,290
0
$0
1
$19,660
APPLICATIONS DENIED
0
$0
7
$76,323
30
$151,239
3
$25,313
1
$233,230
2
$32,205
APPLICATIONS WITHDRAWN
0
$0
4
$107,462
32
$131,511
5
$142,786
0
$0
1
$82,720
FILES CLOSED FOR INCOMPLETENESS
0
$0
2
$67,460
5
$203,264
1
$89,500
0
$0
0
$0
Aggregated Statistics For Year 2005 (Based on 2 partial tracts)
A) FHA, FSA/RHS & VA Home Purchase Loans
B) Conventional Home Purchase Loans
C) Refinancings
D) Home Improvement Loans
F) Non-occupant Loans on < 5 Family Dwellings (A B C & D)
G) Loans On Manufactured Home Dwelling (A B C & D)
Number
Average Value
Number
Average Value
Number
Average Value
Number
Average Value
Number
Average Value
Number
Average Value
LOANS ORIGINATED
1
$212,890
51
$141,277
89
$149,922
18
$40,906
8
$215,011
3
$31,187
APPLICATIONS APPROVED, NOT ACCEPTED
0
$0
1
$110,510
8
$123,481
1
$21,020
0
$0
0
$0
APPLICATIONS DENIED
0
$0
6
$62,715
24
$146,646
3
$75,710
1
$162,720
3
$22,147
APPLICATIONS WITHDRAWN
1
$232,550
5
$117,836
18
$166,298
1
$54,240
1
$284,760
0
$0
FILES CLOSED FOR INCOMPLETENESS
1
$110,510
3
$102,153
7
$148,289
0
$0
1
$41,360
1
$188,480
Aggregated Statistics For Year 2004 (Based on 2 partial tracts)
A) FHA, FSA/RHS & VA Home Purchase Loans
B) Conventional Home Purchase Loans
C) Refinancings
D) Home Improvement Loans
E) Loans on Dwellings For 5+ Families
F) Non-occupant Loans on < 5 Family Dwellings (A B C & D)
G) Loans On Manufactured Home Dwelling (A B C & D)
Detailed PMIC statistics for the following Tracts:9711.00
2002 - 2018 National Fire Incident Reporting System (NFIRS) incidents
Based on the data from the years 2002 - 2018 the average number of fires per year is 7. The highest number of reported fire incidents - 22 took place in 2016, and the least - 0 in 2003. The data has a rising trend.
When looking into fire subcategories, the most reports belonged to: Outside Fires (44.2%), and Structure Fires (40.7%).
Fire incident types reported to NFIRS in Zip Code 53932


+$1,046
-$2,654
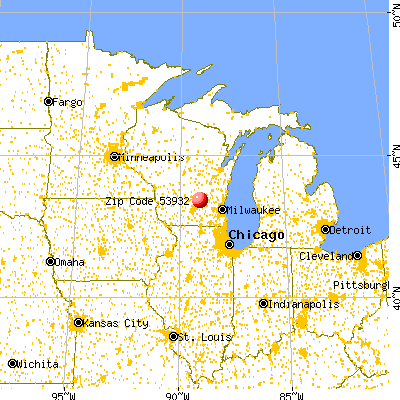
(% of AGI for various income ranges: 12.5% for AGIs below $10k, -0.2% for AGIs $25k-50k, -0.2% for AGIs $50k-75k, 0.4% for AGIs $75k-100k) Nearest zip codes: 53925, 53928, 53956, 53935, 53923, 53960.


 Based on the data from the years 2002 - 2018 the average number of fires per year is 7. The highest number of reported fire incidents - 22 took place in 2016, and the least - 0 in 2003. The data has a rising trend.
 When looking into fire subcategories, the most reports belonged to: Outside Fires (44.2%), and Structure Fires (40.7%).