Estimated zip code population in 2022: 4,292 Zip code population in 2010: 4,479 Zip code population in 2000: 4,225
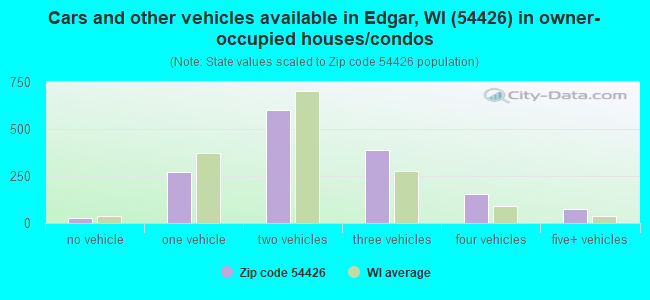
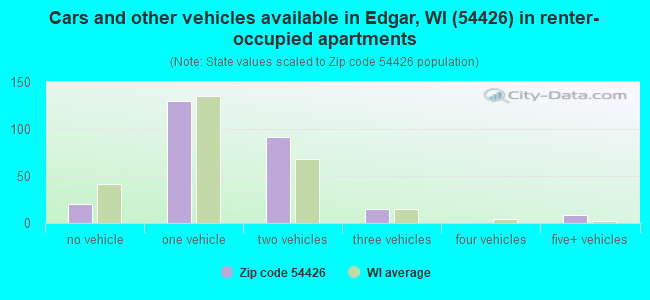
Houses and condos: 1,810 Renter-occupied apartments: 265
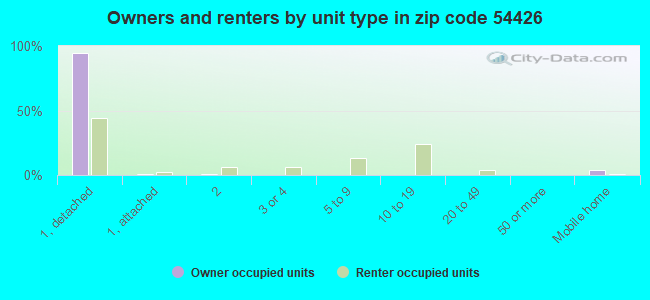
% of renters here:
15%
State:
32%
March 2022 cost of living index in zip code 54426: 86.5 (less than average, U.S. average is 100)
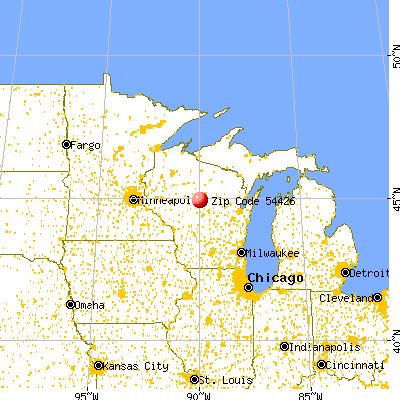
Land area: 108.3 sq. mi. Water area: 0.2 sq. mi.
Population density: 40 people per square mile
(very low).
OSM Map
General Map
Google Map
MSN Map
OSM Map
General Map
Google Map
MSN Map
OSM Map
General Map
Google Map
MSN Map
OSM Map
General Map
Google Map
MSN Map
Please wait while loading the map...
Real estate property taxes paid for housing units in 2022:
This zip code:
1.3% ($2,573)
Wisconsin:
1.4% ($3,497)
Median real estate property taxes paid for housing units with mortgages in 2022: $2,538 (1.2%) Median real estate property taxes paid for housing units with no mortgage in 2022: $2,638 (1.3%)
Business Search- 14 Million verified businesses
Males: 2,287
(53.3%)
Females: 2,005
(46.7%)
For population 25 years and over in 54426:
High school or higher: 92.5%
Bachelor's degree or higher: 16.0%
Graduate or professional degree: 3.6%
Unemployed: 2.2%
Mean travel time to work (commute): 24.1 minutes
For population 15 years and over in 54426:
Never married: 23.4%
Now married: 64.2%
Separated: 0.8%
Widowed: 5.3%
Divorced: 6.3%
Zip code 54426 compared to state average:
Black race population percentage significantly below state average.
Hispanic race population percentage significantly below state average.
Foreign-born population percentage significantly below state average.
Renting percentage below state average.
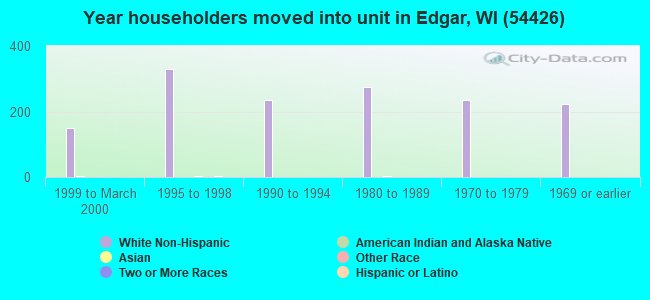
Length of stay since moving in significantly above state average.
Number of college students below state average.
Percentage of population with a bachelor's degree or higher below state average.
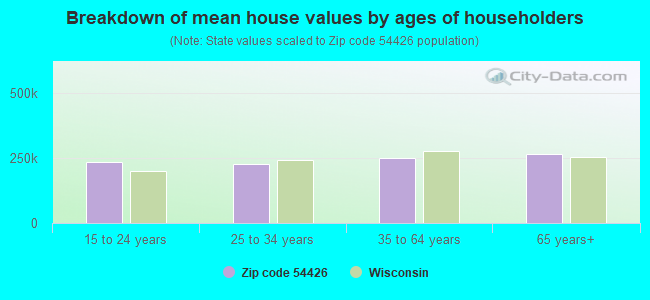
Estimated median house/condo value in 2022: $201,890
54426:
$201,890
Wisconsin:
$252,800
According to our research of Wisconsin and other state lists, there were 8 registered sex offenders living in 54426 zip code as of May 28, 2024. The ratio of all residents to sex offenders in zip code 54426 is 579 to 1. The ratio of registered sex offenders to all residents in this zip code is lower than the state average.
Median resident age:
This zip code:
43.6 years
Wisconsin median age:
40.4 years
Average household size:
This zip code:
2.4 people
Wisconsin:
2.3 people
Averages for the 2020 tax year for zip code 54426, filed in 2021:
Average Adjusted Gross Income (AGI) in 2020: $65,346 (Individual Income Tax Returns)
Here:
$65,346
State:
$72,319
Salary/wage: $57,492 (reported on 83.4% of returns)
Here:
$57,492
State:
$59,242
(% of AGI for various income ranges: 1315.0% for AGIs below $25k, 4202.0% for AGIs $25k-50k, 8383.8% for AGIs $50k-75k, 12219.3% for AGIs $75k-100k, 17768.4% for AGIs $100k-200k)
Taxable interest for individuals: $936 (reported on 43.4% of returns)
This zip code:
$936
Wisconsin:
$1,431
(% of AGI for various income ranges: 58.6% for AGIs below $25k, 42.0% for AGIs $25k-50k, 36.2% for AGIs $50k-75k, 53.3% for AGIs $75k-100k, 110.5% for AGIs $100k-200k)
Ordinary dividends: $3,030 (reported on 21.0% of returns)
Here:
$3,030
State:
$6,481
(% of AGI for various income ranges: 47.5% for AGIs below $25k, 23.4% for AGIs $25k-50k, 46.2% for AGIs $50k-75k, 66.7% for AGIs $75k-100k, 208.4% for AGIs $100k-200k)
Net capital gain/loss in AGI: +$16,082 (reported on 21.5% of returns)
Here:
+$16,082
State:
+$18,329
(% of AGI for various income ranges: 110.0% for AGIs below $25k, 65.4% for AGIs $25k-50k, 308.1% for AGIs $50k-75k, 450.7% for AGIs $75k-100k, 736.3% for AGIs $100k-200k)
Profit/loss from business: +$19,224 (reported on 14.1% of returns)
Here:
+$19,224
State:
+$14,562
(% of AGI for various income ranges: 204.6% for AGIs below $25k, 170.0% for AGIs $25k-50k, 363.8% for AGIs $50k-75k, 310.0% for AGIs $75k-100k, 1672.6% for AGIs $100k-200k)
Taxable individual retirement arrangement distribution: $12,364 (reported on 12.2% of returns)
54426:
$12,364
Wisconsin:
$19,348
(% of AGI for various income ranges: 213.9% for AGIs below $25k, 159.7% for AGIs $25k-50k, 211.9% for AGIs $50k-75k, 353.3% for AGIs $75k-100k, 504.2% for AGIs $100k-200k)
Total itemized deductions: $25,100 (reported on 2.9% of returns)
Here:
$25,100
State:
$33,000
(% of AGI for various income ranges: 340.5% for AGIs $50k-75k, 416.3% for AGIs $100k-200k)
Charity contributions: $5,000 (reported on 2.0% of returns)
Here:
$5,000
State:
$12,044
(% of AGI for various income ranges: 105.3% for AGIs $100k-200k)
Taxes paid: $7,300 (reported on 2.9% of returns)
54426:
$7,300
State:
$8,228
(% of AGI for various income ranges: 91.9% for AGIs $50k-75k, 128.9% for AGIs $100k-200k)
Earned income credit: $2,132 (reported on 9.3% of returns)
Here:
$2,132
State:
$2,155
(% of AGI for various income ranges: 71.1% for AGIs below $25k, 58.9% for AGIs $25k-50k)
Percentage of individuals using paid preparers for their 2020 taxes: 95.1%
Here:
95%
State:
94%
(% for various income ranges: 92.5% for AGIs below $25k, 94.0% for AGIs $25k-50k, 97.1% for AGIs $50k-75k, 96.3% for AGIs $75k-100k, 97.1% for AGIs $100k-200k, 100.0% for AGIs over 200k)
Averages for the 2012 tax year for zip code 54426, filed in 2013:
Average Adjusted Gross Income (AGI) in 2012: $48,700 (Individual Income Tax Returns)
Here:
$48,700
State:
$57,939
Salary/wage: $41,564 (reported on 87.1% of returns)
Here:
$41,564
State:
$48,248
(% of AGI for various income ranges: 70.9% for AGIs below $25k, 82.8% for AGIs $25k-50k, 80.3% for AGIs $50k-75k, 78.3% for AGIs $75k-100k, 63.0% for AGIs $100k-200k)
Taxable interest for individuals: $824 (reported on 46.3% of returns)
This zip code:
$824
Wisconsin:
$1,224
(% of AGI for various income ranges: 2.2% for AGIs below $25k, 0.6% for AGIs $25k-50k, 0.6% for AGIs $50k-75k, 0.7% for AGIs $75k-100k, 0.7% for AGIs $100k-200k)
Ordinary dividends: $1,576 (reported on 20.9% of returns)
Here:
$1,576
State:
$5,137
(% of AGI for various income ranges: 1.0% for AGIs below $25k, 0.4% for AGIs $25k-50k, 0.6% for AGIs $50k-75k, 0.8% for AGIs $75k-100k, 0.7% for AGIs $100k-200k)
Net capital gain/loss in AGI: +$8,776 (reported on 20.4% of returns)
Here:
+$8,776
State:
+$11,137
(% of AGI for various income ranges: 2.1% for AGIs below $25k, 3.0% for AGIs $25k-50k, 2.8% for AGIs $50k-75k, 2.9% for AGIs $75k-100k, 5.8% for AGIs $100k-200k)
Profit/loss from business: +$11,007 (reported on 13.4% of returns)
Here:
+$11,007
State:
+$11,943
(% of AGI for various income ranges: 4.9% for AGIs below $25k, 3.2% for AGIs $25k-50k, 2.2% for AGIs $50k-75k, 2.6% for AGIs $75k-100k, 3.3% for AGIs $100k-200k)
Taxable individual retirement arrangement distribution: $9,335 (reported on 11.4% of returns)
54426:
$9,335
Wisconsin:
$14,087
(% of AGI for various income ranges: 5.2% for AGIs below $25k, 1.9% for AGIs $25k-50k, 1.3% for AGIs $50k-75k, 2.5% for AGIs $75k-100k, 1.9% for AGIs $100k-200k)
Total itemized deductions: $16,936 (20% of AGI, reported on 27.4% of returns)
Here:
$16,936
State:
$22,257
Here:
20.1% of AGI
State:
20.1% of AGI
(% of AGI for various income ranges: 5.8% for AGIs below $25k, 6.9% for AGIs $25k-50k, 9.3% for AGIs $50k-75k, 10.5% for AGIs $75k-100k, 11.6% for AGIs $100k-200k)
Charity contributions: $2,112 (reported on 20.4% of returns)
Here:
$2,112
State:
$3,370
(% of AGI for various income ranges: 0.7% for AGIs below $25k, 0.6% for AGIs $25k-50k, 0.8% for AGIs $50k-75k, 1.1% for AGIs $75k-100k, 1.0% for AGIs $100k-200k)
Taxes paid: $7,409 (reported on 27.4% of returns)
54426:
$7,409
State:
$10,731
(% of AGI for various income ranges: 1.1% for AGIs below $25k, 2.1% for AGIs $25k-50k, 3.7% for AGIs $50k-75k, 4.6% for AGIs $75k-100k, 6.3% for AGIs $100k-200k)
Earned income credit: $1,962 (reported on 12.9% of returns)
Here:
$1,962
State:
$2,094
(% of AGI for various income ranges: 3.5% for AGIs below $25k, 1.2% for AGIs $25k-50k)
Percentage of individuals using paid preparers for their 2012 taxes: 63.7%
Here:
64%
State:
54%
(% for various income ranges: 55.6% for AGIs below $25k, 59.6% for AGIs $25k-50k, 72.7% for AGIs $50k-75k, 76.0% for AGIs $75k-100k, 73.7% for AGIs $100k-200k)
Averages for the 2004 tax year for zip code 54426, filed in 2005:
Average Adjusted Gross Income (AGI) in 2004: $37,441 (Individual Income Tax Returns)
Here:
$37,441
State:
$47,735
Salary/wage: $35,075 (reported on 87.8% of returns)
Here:
$35,075
State:
$41,540
(% of AGI for various income ranges: 166.7% for AGIs below $10k, 75.9% for AGIs $10k-25k, 82.4% for AGIs $25k-50k, 82.7% for AGIs $50k-75k, 83.7% for AGIs $75k-100k, 72.9% for AGIs over 100k)
Taxable interest for individuals: $1,225 (reported on 55.8% of returns)
This zip code:
$1,225
Wisconsin:
$1,420
(% of AGI for various income ranges: 14.3% for AGIs below $10k, 4.3% for AGIs $10k-25k, 1.4% for AGIs $25k-50k, 1.4% for AGIs $50k-75k, 1.0% for AGIs $75k-100k, 1.7% for AGIs over 100k)
Taxable dividends: $1,245 (reported on 22.8% of returns)
Here:
$1,245
State:
$2,869
(% of AGI for various income ranges: 3.2% for AGIs below $10k, 1.2% for AGIs $10k-25k, 0.8% for AGIs $25k-50k, 0.6% for AGIs $50k-75k, 0.8% for AGIs $75k-100k, 0.4% for AGIs over 100k)
Net capital gain/loss: +$5,582 (reported on 25.1% of returns)
Here:
+$5,582
State:
+$9,569
(% of AGI for various income ranges: 20.1% for AGIs below $10k, 3.0% for AGIs $10k-25k, 3.1% for AGIs $25k-50k, 2.9% for AGIs $50k-75k, 2.7% for AGIs $75k-100k, 8.2% for AGIs over 100k)
Profit/loss from business: +$9,605 (reported on 13.9% of returns)
Here:
+$9,605
State:
+$10,417
(% of AGI for various income ranges: 11.2% for AGIs below $10k, 5.3% for AGIs $10k-25k, 3.5% for AGIs $25k-50k, 2.9% for AGIs $50k-75k, 5.3% for AGIs $75k-100k)
Profit/loss from farming: +$2,470 (reported on 12.8% of returns)
Here:
+$2,470
State:
-$2,654
(% of AGI for various income ranges: -27.1% for AGIs below $10k, -3.4% for AGIs $10k-25k, 3.0% for AGIs $25k-50k, 2.2% for AGIs $50k-75k, 0.4% for AGIs $75k-100k)
IRA payment deduction: $3,115 (reported on 5.3% of returns)
54426:
$3,115
Wisconsin:
$2,900
(% of AGI for various income ranges: 0.7% for AGIs $10k-25k, 0.6% for AGIs $25k-50k, 0.4% for AGIs $50k-75k, 0.3% for AGIs $75k-100k)
Self-employed pension: $6,304 (reported on 1.2% of returns)
Here:
$6,304
Wisconsin:
$11,934
Total itemized deductions: $14,315 (22% of AGI, reported on 28.3% of returns)
Here:
$14,315
State:
$18,160
Here:
22.3% of AGI
State:
21.1% of AGI
(% of AGI for various income ranges: 11.6% for AGIs below $10k, 6.3% for AGIs $10k-25k, 8.5% for AGIs $25k-50k, 11.0% for AGIs $50k-75k, 14.5% for AGIs $75k-100k, 14.0% for AGIs over 100k)
Charity contributions deductions: $1,653 (2% of AGI, reported on 22.8% of returns)
Here:
$1,653
State:
$2,711
Here:
2.5% of AGI
State:
3.0% of AGI
(% of AGI for various income ranges: 0.8% for AGIs $10k-25k, 0.9% for AGIs $25k-50k, 1.0% for AGIs $50k-75k, 1.5% for AGIs $75k-100k, 1.0% for AGIs over 100k)
Total tax: $3,901 (reported on 78.7% of returns)
54426:
$3,901
State:
$7,114
(% of AGI for various income ranges: 6.1% for AGIs below $10k, 4.9% for AGIs $10k-25k, 6.7% for AGIs $25k-50k, 7.9% for AGIs $50k-75k, 9.3% for AGIs $75k-100k, 14.4% for AGIs over 100k)
Earned income credit: $1,438 (reported on 10.3% of returns)
Here:
$1,438
State:
$1,544
Percentage of individuals using paid preparers for their 2004 taxes: 68.2%
Here:
68%
State:
57%
(% for various income ranges: 56.9% for AGIs below $10k, 64.9% for AGIs $10k-25k, 72.1% for AGIs $25k-50k, 72.7% for AGIs $50k-75k, 74.7% for AGIs $75k-100k, 82.5% for AGIs over 100k)
Likely homosexual households (counted as self-reported same-sex unmarried-partner households)
Lesbian couples: 0.2% of all households
Gay men: 0.1% of all households
Household received Food Stamps/SNAP in the past 12 months: 142 Household did not receive Food Stamps/SNAP in the past 12 months: 1,636
Women who had a birth in the past 12 months: 92 (76 now married, 15 unmarried) Women who did not have a birth in the past 12 months: 620 (375 now married, 244 unmarried)
Housing units in zip code 54426 with a mortgage: 858 (120 second mortgage, 100 both second mortgage and home equity loan) Houses without a mortgage: 45
Median monthly owner costs for units with a mortgage: $1,370 Median monthly owner costs for units without a mortgage: $573
Residents with income below the poverty level in 2022:
This zip code:
8.0%
Whole state:
10.7%
Residents with income below 50% of the poverty level in 2022:
This zip code:
4.8%
Whole state:
5.7%
Median number of rooms in houses and condos:
Here:
6.6
State:
6.5
Median number of rooms in apartments:
Here:
4.3
State:
4.1
Notable locations in this zip code not listed on our city pages
Notable locations in zip code 54426: Edgar Wastewater Treatment Plant (A), Wind Valley Farms (B), Rock Ridge Orchard (C), Stratford Area Fire Department Station 3 (D), Edgar Volunteer Fire Department (E). Display/hide their locations on the map
In group quarters: 23 (-1 institutionalized population)
Size of family households: 735 2-persons, 178 3-persons, 183 4-persons, 117 5-persons, 28 6-persons, 36 7-or-more-persons
Size of nonfamily households: 433 1-person, 49 2-persons, 16 3-persons
940 married couples with children.
140 single-parent households (57 men, 83 women).
94.3% of residents of 54426 zip code speak English at home.
1.4% of residents speak Spanish at home (55% very well, 2% well, 43% not at all).
4.1% of residents speak other Indo-European language at home (58% very well, 38% well, 3% not well, 1% not at all).
0.1% of residents speak Asian or Pacific Island language at home (100% very well).
0.2% of residents speak other language at home (100% not well).
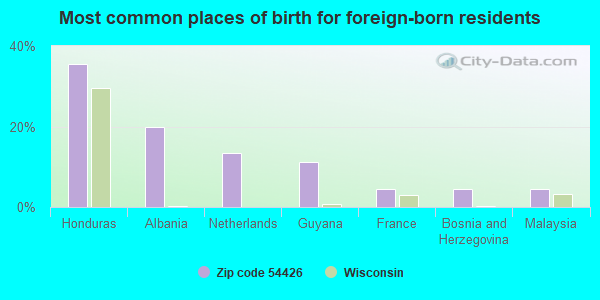
Foreign born population: 45 (1.1%) (41.4% of them are naturalized citizens)
This zip code:
1.1%
Whole state:
5.0%
36%Honduras
20%Albania
13%Netherlands
11%Guyana
4%France
4%Bosnia and Herzegovina
4%Malaysia
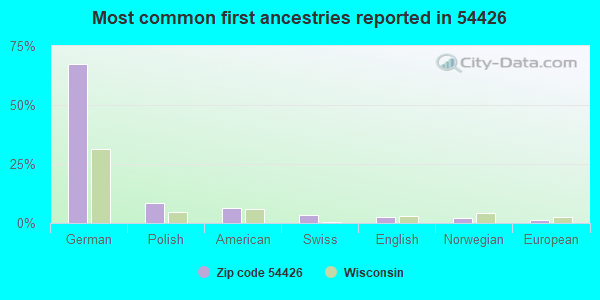
67%German
8%Polish
7%American
3%Swiss
2%English
2%Norwegian
1%European
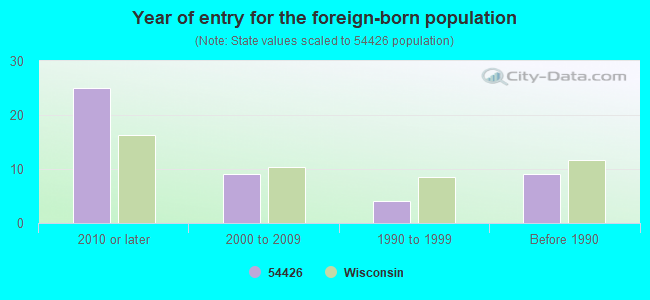
Year of entry for the foreign-born population
252010 or later
92000 to 2009
41990 to 1999
9Before 1990
Facilities with environmental interests located in this zip code:
BERLINER& MARX (316 S 3RD AVE in EDGAR, WI)
Conditionally Exempt Small Quantity Generators, less than 100 kg/month of hazardous waste (Resource Conservation and Recovery Act (tracking hazardous waste)) - notification TRI REPORTER (Tracking of toxic chemicals releasing facilities) STATE MASTER (Wisconsin database) - TRIS-54426BRLNR316TH, TRI REPORTER, RCRAINFO-WID147744189, CESQG Business SIC classification: MEAT PACKING PLANTS Organizations: BERLINER AND MARX (CONTACT/OWNER)
Housing units lacking complete plumbing facilities: 1.1% Housing units lacking complete kitchen facilities: 1.2%
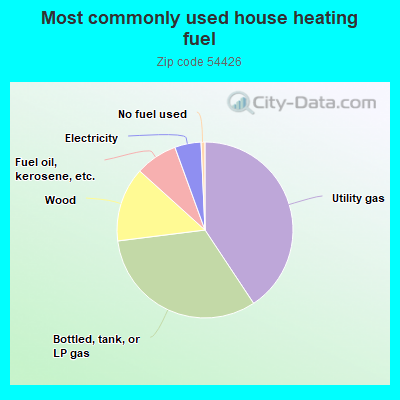
40.4%Utility gas
32.1%Bottled, tank, or LP gas
13.6%Wood
7.7%Fuel oil, kerosene, etc.
4.8%Electricity
0.7%No fuel used
Population in 1990: 3,810. Population change in the 1990s: +415 (+10.9%).
Place of birth for U.S.-born residents:
This state: 3,655
Northeast: 90
Midwest: 375
South: 58
West: 48
73% of the 54426 zip code residents lived in the same house 5 years ago. Out of people who lived in different houses, 72% lived in this county. Out of people who lived in different counties, 50% lived in Wisconsin.
96% of the 54426 zip code residents lived in the same house 1 year ago. Out of people who lived in different houses, 66% moved from this county. Out of people who lived in different houses, 25% moved from different county within same state. Out of people who lived in different houses, 6% moved from different state. Out of people who lived in different houses, 2% moved from abroad.
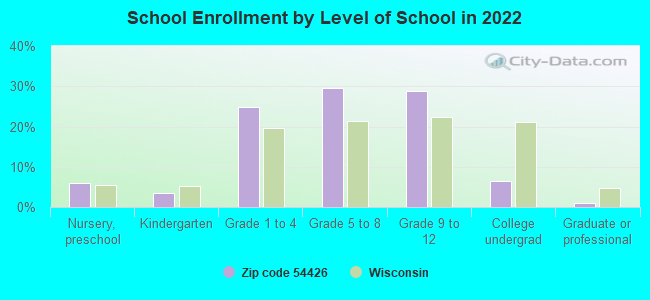
Private vs. public school enrollment:
Students in private schools in grades 1 to 8 (elementary and middle school): 117
Here:
24.2%
Wisconsin:
16.7%
Students in private schools in grades 9 to 12 (high school): 39
Here:
15.5%
Wisconsin:
12.5%
Students in private undergraduate colleges:
Here:
1.6%
Wisconsin:
17.5%
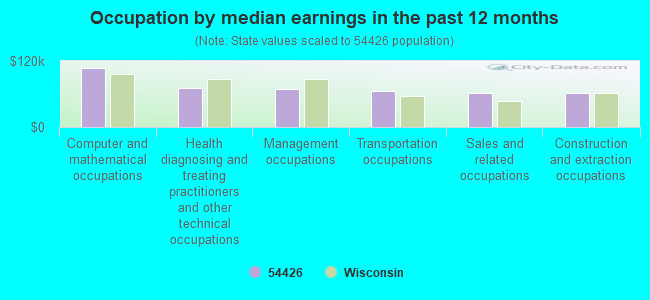
Occupation by median earnings in the past 12 months ($)
107,696Computer and mathematical occupations
71,143Health diagnosing and treating practitioners and other technical occupations
69,024Management occupations
65,289Transportation occupations
62,414Sales and related occupations
60,912Construction and extraction occupations
Companies with federal contracts located in this zip code:
TRACYS CLEANING SERVICE (509 W REDWOOD ST in EDGAR, WI; small business) : $12,090 in 2 contractsin 2001
$6,480 with Army for Custodial Janitorial Services. Signed on 2001-11-16. Completion date: 2002-09-30.
$5,610, same as above.Signed on 2001-01-03. Completion date: 2001-09-30.
Top industries in this zip code by the number of employees in 2005:
Other Services (except Public Administration): Religious Organizations (10-19 employees: 1 establishment, 5-9 employees: 1 establishment, 1-4 employees: 5 establishments)
Construction: Plumbing, Heating, and Air-Conditioning Contractors (10-19: 1, 1-4: 3)
Wholesale Trade: Farm and Garden Machinery and Equipment Merchant Wholesalers (10-19: 1, 1-4: 1)
People in group quarters in 2010:
16 people in group homes intended for adults
Fatal accident statistics in 2014:
Fatal accident count: 1
Vehicles involved in fatal accidents: 3
Fatal accidents caused by drunken drivers: 1
Fatalities: 1
Persons involved in fatal accidents: 4
Pedestrians involved in fatal accidents: 0
Fatal accident statistics in 2010:
Fatal accident count: 1
Vehicles involved in fatal accidents: 2
Fatal accidents caused by drunken drivers: 0
Fatalities: 1
Persons involved in fatal accidents: 3
Pedestrians involved in fatal accidents: 0
Home Mortgage Disclosure Act Aggregated Statistics For Year 2009 (Based on 6 partial tracts)
A) FHA, FSA/RHS & VA Home Purchase Loans
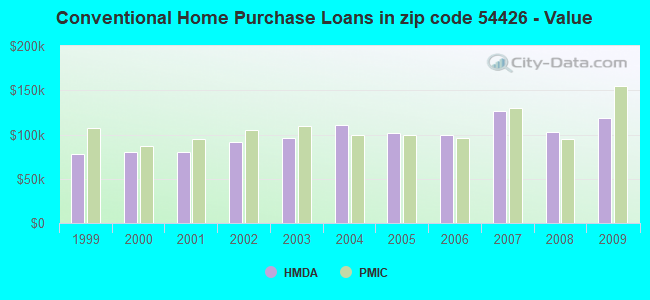
B) Conventional Home Purchase Loans
C) Refinancings
D) Home Improvement Loans
E) Loans on Dwellings For 5+ Families
F) Non-occupant Loans on < 5 Family Dwellings (A B C & D)
G) Loans On Manufactured Home Dwelling (A B C & D)
Number
Average Value
Number
Average Value
Number
Average Value
Number
Average Value
Number
Average Value
Number
Average Value
Number
Average Value
LOANS ORIGINATED
13
$108,105
38
$118,790
340
$127,225
23
$44,750
1
$133,310
12
$249,378
7
$44,963
APPLICATIONS APPROVED, NOT ACCEPTED
1
$39,850
1
$84,780
19
$116,962
1
$76,840
0
$0
0
$0
0
$0
APPLICATIONS DENIED
1
$126,870
18
$71,678
66
$174,026
5
$47,696
0
$0
2
$80,795
4
$41,435
APPLICATIONS WITHDRAWN
1
$39,900
4
$117,138
32
$127,515
0
$0
0
$0
1
$76,980
0
$0
FILES CLOSED FOR INCOMPLETENESS
0
$0
1
$122,450
9
$135,354
1
$66,650
0
$0
0
$0
0
$0
Aggregated Statistics For Year 2008 (Based on 6 partial tracts)
A) FHA, FSA/RHS & VA Home Purchase Loans
B) Conventional Home Purchase Loans
C) Refinancings
D) Home Improvement Loans
E) Loans on Dwellings For 5+ Families
F) Non-occupant Loans on < 5 Family Dwellings (A B C & D)
G) Loans On Manufactured Home Dwelling (A B C & D)
Number
Average Value
Number
Average Value
Number
Average Value
Number
Average Value
Number
Average Value
Number
Average Value
Number
Average Value
LOANS ORIGINATED
8
$105,584
50
$102,797
207
$121,799
24
$56,171
2
$520,965
12
$184,490
11
$39,203
APPLICATIONS APPROVED, NOT ACCEPTED
1
$68,530
5
$101,052
20
$121,746
3
$68,720
0
$0
1
$202,730
1
$19,980
APPLICATIONS DENIED
3
$84,807
7
$82,639
68
$151,140
9
$68,496
0
$0
2
$123,515
3
$30,013
APPLICATIONS WITHDRAWN
1
$165,300
2
$91,825
25
$141,619
0
$0
0
$0
0
$0
0
$0
FILES CLOSED FOR INCOMPLETENESS
0
$0
0
$0
8
$156,308
1
$133,310
0
$0
0
$0
0
$0
Aggregated Statistics For Year 2007 (Based on 6 partial tracts)
A) FHA, FSA/RHS & VA Home Purchase Loans
B) Conventional Home Purchase Loans
C) Refinancings
D) Home Improvement Loans
E) Loans on Dwellings For 5+ Families
F) Non-occupant Loans on < 5 Family Dwellings (A B C & D)
G) Loans On Manufactured Home Dwelling (A B C & D)
Number
Average Value
Number
Average Value
Number
Average Value
Number
Average Value
Number
Average Value
Number
Average Value
Number
Average Value
LOANS ORIGINATED
6
$147,487
76
$126,111
197
$112,897
35
$40,448
1
$106,080
15
$139,379
8
$30,849
APPLICATIONS APPROVED, NOT ACCEPTED
0
$0
6
$71,287
24
$119,790
4
$26,570
0
$0
2
$38,675
1
$73,950
APPLICATIONS DENIED
1
$105,860
24
$86,168
76
$106,428
11
$31,049
0
$0
2
$51,225
10
$30,666
APPLICATIONS WITHDRAWN
0
$0
6
$128,853
32
$121,456
5
$56,766
0
$0
2
$70,880
1
$65,340
FILES CLOSED FOR INCOMPLETENESS
0
$0
1
$140,740
10
$163,334
0
$0
0
$0
0
$0
0
$0
Aggregated Statistics For Year 2006 (Based on 6 partial tracts)
A) FHA, FSA/RHS & VA Home Purchase Loans
B) Conventional Home Purchase Loans
C) Refinancings
D) Home Improvement Loans
E) Loans on Dwellings For 5+ Families
F) Non-occupant Loans on < 5 Family Dwellings (A B C & D)
G) Loans On Manufactured Home Dwelling (A B C & D)
Number
Average Value
Number
Average Value
Number
Average Value
Number
Average Value
Number
Average Value
Number
Average Value
Number
Average Value
LOANS ORIGINATED
1
$94,960
83
$98,888
211
$100,311
48
$41,314
2
$189,435
15
$119,604
12
$44,164
APPLICATIONS APPROVED, NOT ACCEPTED
0
$0
9
$115,352
19
$111,718
6
$125,205
0
$0
1
$150,000
1
$19,780
APPLICATIONS DENIED
1
$109,440
19
$57,694
79
$97,243
11
$37,270
0
$0
1
$100,170
6
$33,983
APPLICATIONS WITHDRAWN
1
$63,840
10
$108,465
46
$111,229
5
$53,382
0
$0
1
$178,210
0
$0
FILES CLOSED FOR INCOMPLETENESS
0
$0
4
$88,732
13
$129,238
0
$0
0
$0
0
$0
0
$0
Aggregated Statistics For Year 2005 (Based on 6 partial tracts)
A) FHA, FSA/RHS & VA Home Purchase Loans
B) Conventional Home Purchase Loans
C) Refinancings
D) Home Improvement Loans
E) Loans on Dwellings For 5+ Families
F) Non-occupant Loans on < 5 Family Dwellings (A B C & D)
G) Loans On Manufactured Home Dwelling (A B C & D)
Number
Average Value
Number
Average Value
Number
Average Value
Number
Average Value
Number
Average Value
Number
Average Value
Number
Average Value
LOANS ORIGINATED
6
$113,272
97
$101,919
247
$96,616
42
$53,612
2
$168,985
16
$122,607
13
$32,771
APPLICATIONS APPROVED, NOT ACCEPTED
1
$111,160
12
$122,417
22
$110,889
4
$37,262
0
$0
1
$39,560
2
$20,530
APPLICATIONS DENIED
1
$114,530
20
$97,658
75
$105,027
10
$46,256
0
$0
6
$92,675
6
$69,960
APPLICATIONS WITHDRAWN
0
$0
10
$82,886
32
$121,273
7
$68,883
0
$0
0
$0
1
$27,160
FILES CLOSED FOR INCOMPLETENESS
0
$0
1
$56,120
16
$128,496
0
$0
0
$0
0
$0
0
$0
Aggregated Statistics For Year 2004 (Based on 6 partial tracts)
A) FHA, FSA/RHS & VA Home Purchase Loans
B) Conventional Home Purchase Loans
C) Refinancings
D) Home Improvement Loans
E) Loans on Dwellings For 5+ Families
F) Non-occupant Loans on < 5 Family Dwellings (A B C & D)
G) Loans On Manufactured Home Dwelling (A B C & D)
Number
Average Value
Number
Average Value
Number
Average Value
Number
Average Value
Number
Average Value
Number
Average Value
Number
Average Value
LOANS ORIGINATED
3
$70,690
85
$110,670
225
$103,709
51
$36,029
1
$101,390
14
$65,541
11
$38,075
APPLICATIONS APPROVED, NOT ACCEPTED
0
$0
5
$76,256
16
$84,069
3
$21,297
0
$0
0
$0
1
$56,370
APPLICATIONS DENIED
0
$0
15
$91,434
81
$88,846
11
$77,987
1
$281,640
5
$90,604
10
$50,849
APPLICATIONS WITHDRAWN
0
$0
5
$83,722
35
$120,671
4
$28,705
0
$0
0
$0
0
$0
FILES CLOSED FOR INCOMPLETENESS
0
$0
4
$60,482
17
$112,871
1
$19,710
0
$0
1
$95,760
0
$0
Aggregated Statistics For Year 2003 (Based on 6 partial tracts)
A) FHA, FSA/RHS & VA Home Purchase Loans
B) Conventional Home Purchase Loans
C) Refinancings
D) Home Improvement Loans
E) Loans on Dwellings For 5+ Families
F) Non-occupant Loans on < 5 Family Dwellings (A B C & D)
Number
Average Value
Number
Average Value
Number
Average Value
Number
Average Value
Number
Average Value
Number
Average Value
LOANS ORIGINATED
1
$151,020
94
$95,944
475
$94,001
33
$43,366
2
$130,025
13
$117,135
APPLICATIONS APPROVED, NOT ACCEPTED
0
$0
9
$65,602
26
$83,702
1
$7,130
0
$0
2
$63,370
APPLICATIONS DENIED
0
$0
14
$80,499
93
$79,871
11
$21,498
0
$0
2
$94,640
APPLICATIONS WITHDRAWN
0
$0
8
$109,816
39
$91,574
1
$47,930
1
$96,700
2
$60,035
FILES CLOSED FOR INCOMPLETENESS
0
$0
1
$69,340
11
$111,965
0
$0
0
$0
2
$82,145
Aggregated Statistics For Year 2002 (Based on 6 partial tracts)
A) FHA, FSA/RHS & VA Home Purchase Loans
B) Conventional Home Purchase Loans
C) Refinancings
D) Home Improvement Loans
F) Non-occupant Loans on < 5 Family Dwellings (A B C & D)
Number
Average Value
Number
Average Value
Number
Average Value
Number
Average Value
Number
Average Value
LOANS ORIGINATED
6
$85,635
69
$91,931
386
$91,368
53
$48,531
9
$55,730
APPLICATIONS APPROVED, NOT ACCEPTED
0
$0
11
$88,525
27
$80,203
3
$32,067
1
$112,370
APPLICATIONS DENIED
0
$0
22
$61,570
65
$80,842
8
$33,491
3
$23,997
APPLICATIONS WITHDRAWN
0
$0
4
$108,522
33
$83,826
2
$21,590
0
$0
FILES CLOSED FOR INCOMPLETENESS
0
$0
1
$67,070
4
$110,155
0
$0
0
$0
Aggregated Statistics For Year 2001 (Based on 6 partial tracts)
A) FHA, FSA/RHS & VA Home Purchase Loans
B) Conventional Home Purchase Loans
C) Refinancings
D) Home Improvement Loans
E) Loans on Dwellings For 5+ Families
F) Non-occupant Loans on < 5 Family Dwellings (A B C & D)
Number
Average Value
Number
Average Value
Number
Average Value
Number
Average Value
Number
Average Value
Number
Average Value
LOANS ORIGINATED
6
$93,022
67
$80,744
280
$74,257
47
$28,942
1
$19,710
10
$55,076
APPLICATIONS APPROVED, NOT ACCEPTED
0
$0
3
$49,433
23
$69,633
3
$14,980
0
$0
1
$63,840
APPLICATIONS DENIED
1
$76,470
16
$72,918
67
$76,194
12
$20,622
0
$0
1
$67,590
APPLICATIONS WITHDRAWN
0
$0
7
$77,213
29
$88,486
4
$19,875
0
$0
0
$0
FILES CLOSED FOR INCOMPLETENESS
0
$0
1
$37,930
3
$55,187
1
$30,960
0
$0
0
$0
Aggregated Statistics For Year 2000 (Based on 6 partial tracts)
A) FHA, FSA/RHS & VA Home Purchase Loans
B) Conventional Home Purchase Loans
C) Refinancings
D) Home Improvement Loans
E) Loans on Dwellings For 5+ Families
F) Non-occupant Loans on < 5 Family Dwellings (A B C & D)
Number
Average Value
Number
Average Value
Number
Average Value
Number
Average Value
Number
Average Value
Number
Average Value
LOANS ORIGINATED
2
$53,835
75
$80,595
135
$51,955
57
$29,876
1
$115,910
6
$60,438
APPLICATIONS APPROVED, NOT ACCEPTED
0
$0
7
$58,460
5
$60,692
3
$31,203
0
$0
0
$0
APPLICATIONS DENIED
0
$0
23
$54,167
42
$55,183
7
$12,710
0
$0
1
$40,370
APPLICATIONS WITHDRAWN
0
$0
10
$59,513
22
$59,433
4
$24,190
0
$0
0
$0
FILES CLOSED FOR INCOMPLETENESS
0
$0
3
$122,103
4
$82,132
0
$0
0
$0
0
$0
Aggregated Statistics For Year 1999 (Based on 3 partial tracts)
A) FHA, FSA/RHS & VA Home Purchase Loans
B) Conventional Home Purchase Loans
C) Refinancings
D) Home Improvement Loans
F) Non-occupant Loans on < 5 Family Dwellings (A B C & D)
2002 - 2018 National Fire Incident Reporting System (NFIRS) incidents
According to the data from the years 2002 - 2018 the average number of fire incidents per year is 7. The highest number of reported fires - 20 took place in 2017, and the least - 0 in 2003. The data has a rising trend.
When looking into fire subcategories, the most reports belonged to: Structure Fires (45.8%), and Outside Fires (31.4%).
Fire incident types reported to NFIRS in Zip Code 54426


+$2,470
-$2,654
(% of AGI for various income ranges: -27.1% for AGIs below $10k, -3.4% for AGIs $10k-25k, 3.0% for AGIs $25k-50k, 2.2% for AGIs $50k-75k, 0.4% for AGIs $75k-100k)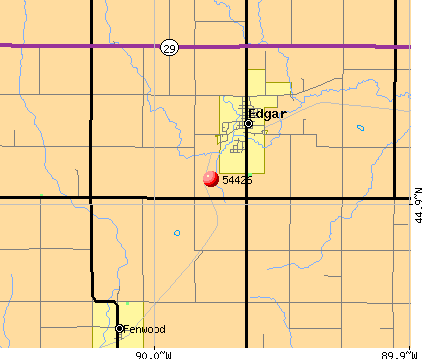 Nearest zip codes: 54484, 54411, 54448, 54412, 54421, 54441.


 According to the data from the years 2002 - 2018 the average number of fire incidents per year is 7. The highest number of reported fires - 20 took place in 2017, and the least - 0 in 2003. The data has a rising trend.
 When looking into fire subcategories, the most reports belonged to: Structure Fires (45.8%), and Outside Fires (31.4%).