Estimated zip code population in 2022: 1,089 Zip code population in 2010: 1,514 Zip code population in 2000: 1,515
Houses and condos: 531 Renter-occupied apartments: 66
% of renters here:
13%
State:
32%
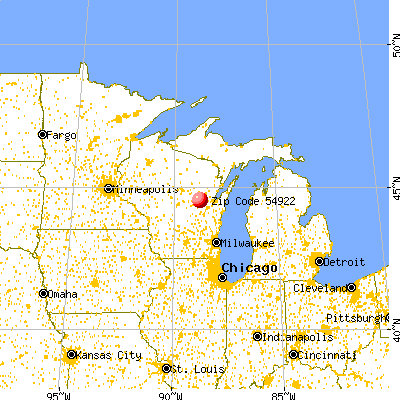
March 2022 cost of living index in zip code 54922: 87.3 (less than average, U.S. average is 100)
Land area: 47.5 sq. mi. Water area: 0.3 sq. mi.
Population density: 23 people per square mile
(very low).
OSM Map
General Map
Google Map
MSN Map
OSM Map
General Map
Google Map
MSN Map
OSM Map
General Map
Google Map
MSN Map
OSM Map
General Map
Google Map
MSN Map
Please wait while loading the map...
Real estate property taxes paid for housing units in 2022:
This zip code:
1.3% ($2,346)
Wisconsin:
1.4% ($3,497)
Median real estate property taxes paid for housing units with mortgages in 2022: $2,399 (1.3%) Median real estate property taxes paid for housing units with no mortgage in 2022: $2,302 (1.3%)
Business Search- 14 Million verified businesses
Males: 574
(52.7%)
Females: 515
(47.3%)
For population 25 years and over in 54922:
High school or higher: 88.3%
Bachelor's degree or higher: 15.6%
Graduate or professional degree: 5.2%
Unemployed: 3.0%
Mean travel time to work (commute): 30.5 minutes
For population 15 years and over in 54922:
Never married: 26.0%
Now married: 50.6%
Separated: 0.7%
Widowed: 10.3%
Divorced: 12.4%
Zip code 54922 compared to state average:
Black race population percentage significantly below state average.
Median age significantly above state average.
Foreign-born population percentage significantly below state average.
Renting percentage significantly below state average.
Length of stay since moving in significantly above state average.
Percentage of population with a bachelor's degree or higher below state average.
Averages for the 2020 tax year for zip code 54922, filed in 2021:
Average Adjusted Gross Income (AGI) in 2020: $59,947 (Individual Income Tax Returns)
Here:
$59,947
State:
$72,319
Salary/wage: $53,507 (reported on 83.8% of returns)
Here:
$53,507
State:
$59,242
(% of AGI for various income ranges: 1410.0% for AGIs below $25k, 4480.0% for AGIs $25k-50k, 6880.0% for AGIs $50k-75k, 13572.5% for AGIs $75k-100k, 23570.0% for AGIs $100k-200k)
Taxable interest for individuals: $761 (reported on 41.2% of returns)
This zip code:
$761
Wisconsin:
$1,431
(% of AGI for various income ranges: 25.6% for AGIs below $25k, 12.3% for AGIs $25k-50k, 21.1% for AGIs $50k-75k, 32.5% for AGIs $75k-100k, 284.0% for AGIs $100k-200k)
Ordinary dividends: $1,860 (reported on 14.7% of returns)
Here:
$1,860
State:
$6,481
(% of AGI for various income ranges: 41.5% for AGIs $25k-50k, 16.7% for AGIs $50k-75k, 234.0% for AGIs $100k-200k)
Net capital gain/loss in AGI: +$7,760 (reported on 14.7% of returns)
Here:
+$7,760
State:
+$18,329
(% of AGI for various income ranges: 68.5% for AGIs $25k-50k, 152.2% for AGIs $50k-75k, 1100.0% for AGIs $100k-200k)
Profit/loss from business: +$8,562 (reported on 11.8% of returns)
Here:
+$8,562
State:
+$14,562
(% of AGI for various income ranges: 210.8% for AGIs $25k-50k, 1027.5% for AGIs $75k-100k)
Taxable individual retirement arrangement distribution: $14,767 (reported on 13.2% of returns)
54922:
$14,767
Wisconsin:
$19,348
(% of AGI for various income ranges: 503.8% for AGIs $25k-50k, 1685.0% for AGIs $75k-100k)
Earned income credit: $2,029 (reported on 10.3% of returns)
Here:
$2,029
State:
$2,155
(% of AGI for various income ranges: 87.8% for AGIs below $25k, 48.5% for AGIs $25k-50k)
Percentage of individuals using paid preparers for their 2020 taxes: 97.1%
Here:
97%
State:
94%
(% for various income ranges: 94.1% for AGIs below $25k, 95.0% for AGIs $25k-50k, 100.0% for AGIs $50k-75k, 100.0% for AGIs $75k-100k, 100.0% for AGIs $100k-200k)
Averages for the 2012 tax year for zip code 54922, filed in 2013:
Average Adjusted Gross Income (AGI) in 2012: $45,085 (Individual Income Tax Returns)
Here:
$45,085
State:
$57,939
Salary/wage: $40,400 (reported on 91.2% of returns)
Here:
$40,400
State:
$48,248
(% of AGI for various income ranges: 83.6% for AGIs below $25k, 81.7% for AGIs $25k-50k, 85.7% for AGIs $50k-75k, 85.8% for AGIs $75k-100k, 70.9% for AGIs $100k-200k)
Taxable interest for individuals: $419 (reported on 39.7% of returns)
This zip code:
$419
Wisconsin:
$1,224
(% of AGI for various income ranges: 0.4% for AGIs below $25k, 0.7% for AGIs $25k-50k, 0.3% for AGIs $50k-75k, 0.3% for AGIs $75k-100k, 0.2% for AGIs $100k-200k)
Ordinary dividends: $1,164 (reported on 16.2% of returns)
Here:
$1,164
State:
$5,137
(% of AGI for various income ranges: 0.3% for AGIs below $25k, 0.8% for AGIs $25k-50k, 0.3% for AGIs $50k-75k, 0.6% for AGIs $75k-100k)
Net capital gain/loss in AGI: +$3,100 (reported on 14.7% of returns)
Here:
+$3,100
State:
+$11,137
(% of AGI for various income ranges: 0.4% for AGIs below $25k, 2.0% for AGIs $25k-50k, 2.4% for AGIs $75k-100k)
Profit/loss from business: +$5,662 (reported on 11.8% of returns)
Here:
+$5,662
State:
+$11,943
Taxable individual retirement arrangement distribution: $9,400 (reported on 8.8% of returns)
54922:
$9,400
Wisconsin:
$14,087
Total itemized deductions: $14,994 (20% of AGI, reported on 25.0% of returns)
Here:
$14,994
State:
$22,257
Here:
20.0% of AGI
State:
20.1% of AGI
(% of AGI for various income ranges: 6.5% for AGIs $25k-50k, 8.0% for AGIs $50k-75k, 11.2% for AGIs $75k-100k, 11.6% for AGIs $100k-200k)
Charity contributions: $1,636 (reported on 16.2% of returns)
Here:
$1,636
State:
$3,370
(% of AGI for various income ranges: 0.5% for AGIs below $25k, 0.4% for AGIs $50k-75k, 0.8% for AGIs $75k-100k, 1.3% for AGIs $100k-200k)
Taxes paid: $6,647 (reported on 25.0% of returns)
54922:
$6,647
State:
$10,731
(% of AGI for various income ranges: 2.3% for AGIs $25k-50k, 3.7% for AGIs $50k-75k, 4.8% for AGIs $75k-100k, 5.8% for AGIs $100k-200k)
Earned income credit: $2,043 (reported on 10.3% of returns)
Here:
$2,043
State:
$2,094
(% of AGI for various income ranges: 4.8% for AGIs below $25k)
Percentage of individuals using paid preparers for their 2012 taxes: 70.6%
Here:
71%
State:
54%
(% for various income ranges: 62.5% for AGIs below $25k, 66.7% for AGIs $25k-50k, 76.9% for AGIs $50k-75k, 87.5% for AGIs $75k-100k, 80.0% for AGIs $100k-200k)
Averages for the 2004 tax year for zip code 54922, filed in 2005:
Average Adjusted Gross Income (AGI) in 2004: $36,647 (Individual Income Tax Returns)
Here:
$36,647
State:
$47,735
Salary/wage: $34,567 (reported on 90.6% of returns)
Here:
$34,567
State:
$41,540
(% of AGI for various income ranges: 120.8% for AGIs below $10k, 79.1% for AGIs $10k-25k, 90.8% for AGIs $25k-50k, 88.9% for AGIs $50k-75k, 90.9% for AGIs $75k-100k, 43.4% for AGIs over 100k)
Taxable interest for individuals: $635 (reported on 48.5% of returns)
This zip code:
$635
Wisconsin:
$1,420
(% of AGI for various income ranges: 5.9% for AGIs below $10k, 2.7% for AGIs $10k-25k, 0.5% for AGIs $25k-50k, 0.3% for AGIs $50k-75k, 0.2% for AGIs $75k-100k, 1.6% for AGIs over 100k)
Taxable dividends: $588 (reported on 20.1% of returns)
Here:
$588
State:
$2,869
(% of AGI for various income ranges: 1.1% for AGIs below $10k, 0.7% for AGIs $10k-25k, 0.2% for AGIs $25k-50k, 0.3% for AGIs $50k-75k, 0.5% for AGIs $75k-100k)
Net capital gain/loss: +$5,679 (reported on 16.1% of returns)
Here:
+$5,679
State:
+$9,569
(% of AGI for various income ranges: -2.7% for AGIs below $10k, 2.8% for AGIs $10k-25k, 1.0% for AGIs $25k-50k, 3.0% for AGIs $50k-75k, 5.9% for AGIs $75k-100k)
Profit/loss from business: +$2,928 (reported on 10.2% of returns)
Here:
+$2,928
State:
+$10,417
(% of AGI for various income ranges: -7.9% for AGIs below $10k, 1.5% for AGIs $10k-25k, 0.1% for AGIs $25k-50k, 2.2% for AGIs $50k-75k)
IRA payment deduction: $2,588 (reported on 2.5% of returns)
54922:
$2,588
Wisconsin:
$2,900
Total itemized deductions: $13,399 (22% of AGI, reported on 28.5% of returns)
Here:
$13,399
State:
$18,160
Here:
22.3% of AGI
State:
21.1% of AGI
(% of AGI for various income ranges: 7.5% for AGIs $10k-25k, 9.4% for AGIs $25k-50k, 11.4% for AGIs $50k-75k, 12.5% for AGIs $75k-100k, 12.1% for AGIs over 100k)
Charity contributions deductions: $1,285 (2% of AGI, reported on 22.3% of returns)
Here:
$1,285
State:
$2,711
Here:
2.0% of AGI
State:
3.0% of AGI
(% of AGI for various income ranges: 0.4% for AGIs $10k-25k, 0.6% for AGIs $25k-50k, 0.9% for AGIs $50k-75k, 1.3% for AGIs $75k-100k, 0.9% for AGIs over 100k)
Total tax: $3,755 (reported on 76.5% of returns)
54922:
$3,755
State:
$7,114
(% of AGI for various income ranges: 1.6% for AGIs below $10k, 4.0% for AGIs $10k-25k, 7.1% for AGIs $25k-50k, 7.8% for AGIs $50k-75k, 8.8% for AGIs $75k-100k, 15.0% for AGIs over 100k)
Earned income credit: $1,250 (reported on 10.0% of returns)
Here:
$1,250
State:
$1,544
Percentage of individuals using paid preparers for their 2004 taxes: 68.0%
Here:
68%
State:
57%
(% for various income ranges: 53.4% for AGIs below $10k, 65.4% for AGIs $10k-25k, 69.1% for AGIs $25k-50k, 78.2% for AGIs $50k-75k, 78.3% for AGIs $75k-100k, 84.6% for AGIs over 100k)
Likely homosexual households (counted as self-reported same-sex unmarried-partner households)
Lesbian couples: 0.2% of all households
Gay men: 0.0% of all households
Household received Food Stamps/SNAP in the past 12 months: 25 Household did not receive Food Stamps/SNAP in the past 12 months: 472
Women who had a birth in the past 12 months: 13 (2 now married, 10 unmarried) Women who did not have a birth in the past 12 months: 182 (91 now married, 90 unmarried)
Housing units in zip code 54922 with a mortgage: 231 (17 second mortgage, 9 both second mortgage and home equity loan) Houses without a mortgage: 1
Median monthly owner costs for units with a mortgage: $1,306 Median monthly owner costs for units without a mortgage: $529
Residents with income below the poverty level in 2022:
This zip code:
7.8%
Whole state:
10.7%
Residents with income below 50% of the poverty level in 2022:
This zip code:
6.6%
Whole state:
5.7%
Median number of rooms in houses and condos:
Here:
6.5
State:
6.5
Median number of rooms in apartments:
Here:
5.1
State:
4.1
Notable locations in this zip code not listed on our city pages
In group quarters: 8 (-1 institutionalized population)
Size of family households: 162 2-persons, 64 3-persons, 60 4-persons, 28 5-persons, 2 7-or-more-persons
Size of nonfamily households: 148 1-person, 35 2-persons
113 married couples with children.
69 single-parent households (35 men, 34 women).
92.6% of residents of 54922 zip code speak English at home.
7.0% of residents speak Spanish at home (71% very well, 15% well, 14% not well).
Foreign born population: 17 (1.6%) (16.7% of them are naturalized citizens)
This zip code:
1.6%
Whole state:
5.0%
100%Honduras
44%German
7%American
4%Polish
4%Irish
3%French
2%English
0%Danish
Year of entry for the foreign-born population
02010 or later
02000 to 2009
131990 to 1999
25Before 1990
Facilities with environmental interests located in this zip code:
BEAR CREEK EL (N PARK ST in BEAR CREEK, WI)
(National Center for Education Statistics) - STATE ID-0015 Organizations: CLINTONVILLE SCH DIST (SCHOOL DISTRICT)
Housing units lacking complete plumbing facilities: 2.5% Housing units lacking complete kitchen facilities: 2.4%
56.6%Bottled, tank, or LP gas
22.2%Utility gas
8.6%Fuel oil, kerosene, etc.
6.6%Wood
3.1%Electricity
3.1%Other fuel
Population in 1990: 1,488. Population change in the 1990s: +27 (+1.8%).
Place of birth for U.S.-born residents:
This state: 940
Northeast: 2
Midwest: 54
South: 22
West: 24
68% of the 54922 zip code residents lived in the same house 5 years ago. Out of people who lived in different houses, 46% lived in this county. Out of people who lived in different counties, 50% lived in Wisconsin.
96% of the 54922 zip code residents lived in the same house 1 year ago. Out of people who lived in different houses, 19% moved from this county. Out of people who lived in different houses, 78% moved from different county within same state. Out of people who lived in different houses, 3% moved from different state. Out of people who lived in different houses, 5% moved from abroad.
Private vs. public school enrollment:
Students in private schools in grades 1 to 8 (elementary and middle school): 3
Here:
7.4%
Wisconsin:
16.7%
Students in private schools in grades 9 to 12 (high school):
Here:
0.0%
Wisconsin:
12.5%
Students in private undergraduate colleges: 1
Here:
7.3%
Wisconsin:
17.5%
Occupation by median earnings in the past 12 months ($)
191,717Health diagnosing and treating practitioners and other technical occupations
88,288Arts, design, entertainment, sports, and media occupations
68,931Transportation occupations
65,136Architecture and engineering occupations
61,378Management occupations
51,582Sales and related occupations
Top industries in this zip code by the number of employees in 2005:
Educational Services: Elementary and Secondary Schools (20-49 employees: 1 establishment)
Other Services (except Public Administration): Business Associations (5-9: 1)
Construction: New Single-Family Housing Construction (except Operative Builders) (1-4: 3)
Accommodation and Food Services: Drinking Places (Alcoholic Beverages) (1-4: 2)
People in group quarters in 2010:
8 people in group homes intended for adults
Fatal accident statistics in 2013:
Fatal accident count: 1
Vehicles involved in fatal accidents: 1
Fatal accidents caused by drunken drivers: 0
Fatalities: 1
Persons involved in fatal accidents: 1
Pedestrians involved in fatal accidents: 0
Home Mortgage Disclosure Act Aggregated Statistics For Year 2009 (Based on 2 partial tracts)
A) FHA, FSA/RHS & VA Home Purchase Loans
B) Conventional Home Purchase Loans
C) Refinancings
D) Home Improvement Loans
F) Non-occupant Loans on < 5 Family Dwellings (A B C & D)
G) Loans On Manufactured Home Dwelling (A B C & D)
Number
Average Value
Number
Average Value
Number
Average Value
Number
Average Value
Number
Average Value
Number
Average Value
LOANS ORIGINATED
1
$209,810
6
$140,413
59
$126,087
9
$71,832
1
$100,840
2
$76,845
APPLICATIONS APPROVED, NOT ACCEPTED
0
$0
0
$0
3
$193,407
0
$0
0
$0
0
$0
APPLICATIONS DENIED
1
$101,650
3
$74,137
9
$140,097
2
$30,090
1
$26,840
0
$0
APPLICATIONS WITHDRAWN
1
$102,460
1
$60,180
8
$121,269
2
$76,645
0
$0
0
$0
FILES CLOSED FOR INCOMPLETENESS
0
$0
0
$0
1
$122,390
0
$0
0
$0
0
$0
Aggregated Statistics For Year 2008 (Based on 2 partial tracts)
A) FHA, FSA/RHS & VA Home Purchase Loans
B) Conventional Home Purchase Loans
C) Refinancings
D) Home Improvement Loans
F) Non-occupant Loans on < 5 Family Dwellings (A B C & D)
G) Loans On Manufactured Home Dwelling (A B C & D)
Number
Average Value
Number
Average Value
Number
Average Value
Number
Average Value
Number
Average Value
Number
Average Value
LOANS ORIGINATED
2
$67,900
5
$143,692
43
$110,151
9
$39,621
1
$171,180
1
$6,100
APPLICATIONS APPROVED, NOT ACCEPTED
0
$0
1
$99,210
3
$118,187
1
$164,670
0
$0
0
$0
APPLICATIONS DENIED
0
$0
2
$183,175
12
$97,889
2
$36,795
1
$93,920
1
$60,180
APPLICATIONS WITHDRAWN
0
$0
1
$84,980
7
$135,804
0
$0
0
$0
0
$0
FILES CLOSED FOR INCOMPLETENESS
0
$0
0
$0
0
$0
0
$0
0
$0
0
$0
Aggregated Statistics For Year 2007 (Based on 2 partial tracts)
A) FHA, FSA/RHS & VA Home Purchase Loans
B) Conventional Home Purchase Loans
C) Refinancings
D) Home Improvement Loans
F) Non-occupant Loans on < 5 Family Dwellings (A B C & D)
G) Loans On Manufactured Home Dwelling (A B C & D)
Number
Average Value
Number
Average Value
Number
Average Value
Number
Average Value
Number
Average Value
Number
Average Value
LOANS ORIGINATED
1
$106,530
12
$115,203
37
$129,145
13
$53,358
2
$115,270
1
$76,440
APPLICATIONS APPROVED, NOT ACCEPTED
0
$0
2
$79,085
4
$121,370
0
$0
0
$0
0
$0
APPLICATIONS DENIED
0
$0
2
$111,815
17
$95,551
3
$50,823
2
$36,390
1
$26,430
APPLICATIONS WITHDRAWN
0
$0
2
$142,920
8
$108,562
1
$143,940
0
$0
0
$0
FILES CLOSED FOR INCOMPLETENESS
0
$0
0
$0
1
$154,100
0
$0
0
$0
0
$0
Aggregated Statistics For Year 2006 (Based on 2 partial tracts)
B) Conventional Home Purchase Loans
C) Refinancings
D) Home Improvement Loans
F) Non-occupant Loans on < 5 Family Dwellings (A B C & D)
G) Loans On Manufactured Home Dwelling (A B C & D)
Number
Average Value
Number
Average Value
Number
Average Value
Number
Average Value
Number
Average Value
LOANS ORIGINATED
17
$126,165
44
$112,933
16
$37,077
5
$78,880
1
$32,120
APPLICATIONS APPROVED, NOT ACCEPTED
1
$58,960
5
$144,424
2
$28,460
1
$30,490
0
$0
APPLICATIONS DENIED
5
$111,572
22
$117,341
2
$14,030
1
$52,450
2
$81,930
APPLICATIONS WITHDRAWN
1
$81,320
11
$134,436
0
$0
0
$0
1
$99,620
FILES CLOSED FOR INCOMPLETENESS
0
$0
4
$159,388
0
$0
0
$0
0
$0
Aggregated Statistics For Year 2005 (Based on 2 partial tracts)
A) FHA, FSA/RHS & VA Home Purchase Loans
B) Conventional Home Purchase Loans
C) Refinancings
D) Home Improvement Loans
F) Non-occupant Loans on < 5 Family Dwellings (A B C & D)
G) Loans On Manufactured Home Dwelling (A B C & D)
Number
Average Value
Number
Average Value
Number
Average Value
Number
Average Value
Number
Average Value
Number
Average Value
LOANS ORIGINATED
2
$85,185
14
$91,717
48
$121,345
14
$33,806
4
$69,528
2
$57,940
APPLICATIONS APPROVED, NOT ACCEPTED
0
$0
2
$96,365
4
$68,715
0
$0
0
$0
0
$0
APPLICATIONS DENIED
0
$0
2
$154,710
19
$105,074
3
$42,830
0
$0
1
$95,140
APPLICATIONS WITHDRAWN
0
$0
1
$129,710
8
$149,934
1
$82,540
0
$0
0
$0
FILES CLOSED FOR INCOMPLETENESS
0
$0
0
$0
7
$105,774
0
$0
0
$0
0
$0
Aggregated Statistics For Year 2004 (Based on 2 partial tracts)
A) FHA, FSA/RHS & VA Home Purchase Loans
B) Conventional Home Purchase Loans
C) Refinancings
D) Home Improvement Loans
F) Non-occupant Loans on < 5 Family Dwellings (A B C & D)
G) Loans On Manufactured Home Dwelling (A B C & D)
Number
Average Value
Number
Average Value
Number
Average Value
Number
Average Value
Number
Average Value
Number
Average Value
LOANS ORIGINATED
1
$92,700
26
$121,855
50
$101,902
13
$53,859
2
$114,865
2
$102,055
APPLICATIONS APPROVED, NOT ACCEPTED
0
$0
0
$0
2
$72,780
0
$0
0
$0
0
$0
APPLICATIONS DENIED
0
$0
3
$104,633
13
$90,515
4
$22,262
0
$0
1
$96,360
APPLICATIONS WITHDRAWN
0
$0
0
$0
7
$102,114
0
$0
0
$0
0
$0
FILES CLOSED FOR INCOMPLETENESS
0
$0
0
$0
3
$96,637
0
$0
0
$0
0
$0
Aggregated Statistics For Year 2003 (Based on 2 partial tracts)
B) Conventional Home Purchase Loans
C) Refinancings
D) Home Improvement Loans
F) Non-occupant Loans on < 5 Family Dwellings (A B C & D)
Number
Average Value
Number
Average Value
Number
Average Value
Number
Average Value
LOANS ORIGINATED
18
$108,833
71
$103,299
11
$22,622
3
$51,503
APPLICATIONS APPROVED, NOT ACCEPTED
0
$0
4
$104,902
0
$0
1
$58,140
APPLICATIONS DENIED
3
$101,380
19
$98,889
2
$47,570
0
$0
APPLICATIONS WITHDRAWN
1
$119,950
7
$84,573
0
$0
0
$0
FILES CLOSED FOR INCOMPLETENESS
0
$0
0
$0
0
$0
0
$0
Aggregated Statistics For Year 2002 (Based on 2 partial tracts)
A) FHA, FSA/RHS & VA Home Purchase Loans
B) Conventional Home Purchase Loans
C) Refinancings
D) Home Improvement Loans
F) Non-occupant Loans on < 5 Family Dwellings (A B C & D)
Number
Average Value
Number
Average Value
Number
Average Value
Number
Average Value
Number
Average Value
LOANS ORIGINATED
2
$82,135
13
$94,706
59
$96,392
9
$20,647
2
$55,905
APPLICATIONS APPROVED, NOT ACCEPTED
0
$0
0
$0
5
$90,916
0
$0
0
$0
APPLICATIONS DENIED
0
$0
5
$63,674
16
$85,894
0
$0
0
$0
APPLICATIONS WITHDRAWN
0
$0
0
$0
8
$94,484
1
$8,540
1
$74,000
FILES CLOSED FOR INCOMPLETENESS
0
$0
0
$0
1
$107,750
0
$0
0
$0
Aggregated Statistics For Year 2001 (Based on 2 partial tracts)
A) FHA, FSA/RHS & VA Home Purchase Loans
B) Conventional Home Purchase Loans
C) Refinancings
D) Home Improvement Loans
F) Non-occupant Loans on < 5 Family Dwellings (A B C & D)
Number
Average Value
Number
Average Value
Number
Average Value
Number
Average Value
Number
Average Value
LOANS ORIGINATED
2
$70,340
14
$105,309
57
$91,621
7
$19,633
2
$64,650
APPLICATIONS APPROVED, NOT ACCEPTED
0
$0
2
$39,845
4
$96,568
0
$0
0
$0
APPLICATIONS DENIED
0
$0
2
$82,945
12
$101,209
2
$4,065
0
$0
APPLICATIONS WITHDRAWN
0
$0
1
$39,850
7
$83,876
0
$0
0
$0
FILES CLOSED FOR INCOMPLETENESS
0
$0
0
$0
0
$0
0
$0
0
$0
Aggregated Statistics For Year 2000 (Based on 2 partial tracts)
A) FHA, FSA/RHS & VA Home Purchase Loans
B) Conventional Home Purchase Loans
C) Refinancings
D) Home Improvement Loans
F) Non-occupant Loans on < 5 Family Dwellings (A B C & D)
Number
Average Value
Number
Average Value
Number
Average Value
Number
Average Value
Number
Average Value
LOANS ORIGINATED
1
$50,420
15
$85,793
24
$61,498
9
$16,083
2
$43,305
APPLICATIONS APPROVED, NOT ACCEPTED
0
$0
1
$85,790
2
$104,295
1
$10,980
0
$0
APPLICATIONS DENIED
0
$0
3
$97,177
6
$68,512
0
$0
0
$0
APPLICATIONS WITHDRAWN
1
$36,190
2
$76,440
3
$52,180
0
$0
0
$0
FILES CLOSED FOR INCOMPLETENESS
0
$0
0
$0
2
$89,655
0
$0
0
$0
Aggregated Statistics For Year 1999 (Based on 1 partial tract)
B) Conventional Home Purchase Loans
C) Refinancings
D) Home Improvement Loans
F) Non-occupant Loans on < 5 Family Dwellings (A B C & D)
Detailed PMIC statistics for the following Tracts:0132.00
2004 - 2018 National Fire Incident Reporting System (NFIRS) incidents
According to the data from the years 2004 - 2018 the average number of fires per year is 7. The highest number of reported fires - 14 took place in 2006, and the least - 0 in 2005. The data has a constant trend.
When looking into fire subcategories, the most incidents belonged to: Structure Fires (43.6%), and Outside Fires (26.7%).
Fire incident types reported to NFIRS in Zip Code 54922


 Nearest zip codes: 54929, 54961, 54933, 54949, 54170, 54950.


 According to the data from the years 2004 - 2018 the average number of fires per year is 7. The highest number of reported fires - 14 took place in 2006, and the least - 0 in 2005. The data has a constant trend.
 When looking into fire subcategories, the most incidents belonged to: Structure Fires (43.6%), and Outside Fires (26.7%).