Estimated zip code population in 2022: 1,298 Zip code population in 2010: 1,201 Zip code population in 2000: 980
Houses and condos: 484 Renter-occupied apartments: 54
% of renters here:
12%
State:
28%
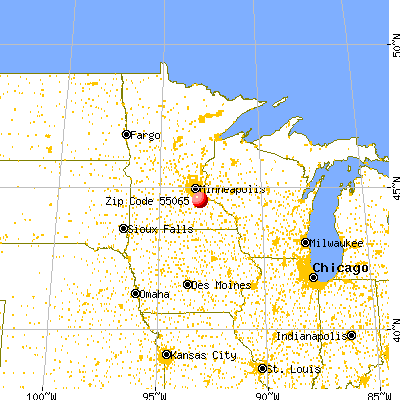
March 2022 cost of living index in zip code 55065: 97.9 (near average, U.S. average is 100)
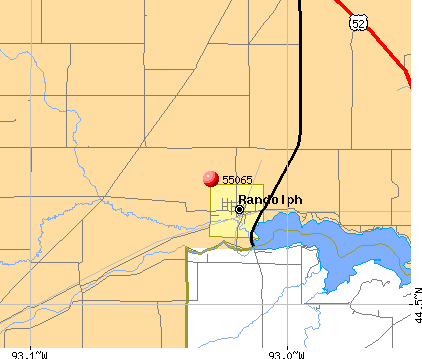
Land area: 32.9 sq. mi. Water area: 0.3 sq. mi.
Population density: 39 people per square mile
(very low).
OSM Map
General Map
Google Map
MSN Map
OSM Map
General Map
Google Map
MSN Map
OSM Map
General Map
Google Map
MSN Map
OSM Map
General Map
Google Map
MSN Map
Please wait while loading the map...
Real estate property taxes paid for housing units in 2022:
This zip code:
0.7% ($2,691)
Minnesota:
1.0% ($3,087)
Median real estate property taxes paid for housing units with mortgages in 2022: $2,666 (0.7%) Median real estate property taxes paid for housing units with no mortgage in 2022: $2,751 (0.8%)
Business Search- 14 Million verified businesses
Males: 675
(52.0%)
Females: 623
(48.0%)
For population 25 years and over in 55065:
High school or higher: 96.9%
Bachelor's degree or higher: 32.7%
Graduate or professional degree: 5.3%
Unemployed: 2.7%
Mean travel time to work (commute): 28.2 minutes
For population 15 years and over in 55065:
Never married: 21.9%
Now married: 64.9%
Separated: 0.5%
Widowed: 3.1%
Divorced: 9.6%
Zip code 55065 compared to state average:
Black race population percentage significantly below state average.
Hispanic race population percentage significantly below state average.
Foreign-born population percentage significantly below state average.
Renting percentage significantly below state average.
Length of stay since moving in significantly above state average.
Estimated median house/condo value in 2022: $383,378
55065:
$383,378
Minnesota:
$314,600
Median resident age:
This zip code:
39.4 years
Minnesota median age:
39.0 years
Average household size:
This zip code:
2.7 people
Minnesota:
2.4 people
Averages for the 2020 tax year for zip code 55065, filed in 2021:
Average Adjusted Gross Income (AGI) in 2020: $77,423 (Individual Income Tax Returns)
Here:
$77,423
State:
$82,178
Salary/wage: $71,490 (reported on 80.0% of returns)
Here:
$71,490
State:
$67,438
(% of AGI for various income ranges: 1943.3% for AGIs below $25k, 4290.0% for AGIs $25k-50k, 8085.0% for AGIs $50k-75k, 9328.0% for AGIs $75k-100k, 18051.1% for AGIs $100k-200k)
Taxable interest for individuals: $1,208 (reported on 40.0% of returns)
This zip code:
$1,208
Minnesota:
$1,814
(% of AGI for various income ranges: 43.3% for AGIs below $25k, 55.7% for AGIs $25k-50k, 81.7% for AGIs $50k-75k, 92.0% for AGIs $75k-100k, 144.4% for AGIs $100k-200k)
Ordinary dividends: $2,415 (reported on 21.7% of returns)
Here:
$2,415
State:
$6,928
(% of AGI for various income ranges: 16.7% for AGIs below $25k, 131.7% for AGIs $50k-75k, 250.0% for AGIs $100k-200k)
Net capital gain/loss in AGI: +$11,691 (reported on 18.3% of returns)
Here:
+$11,691
State:
+$20,591
(% of AGI for various income ranges: 151.7% for AGIs $50k-75k, 1332.2% for AGIs $100k-200k)
Profit/loss from business: +$11,078 (reported on 15.0% of returns)
Here:
+$11,078
State:
+$14,342
(% of AGI for various income ranges: 653.3% for AGIs below $25k, 191.7% for AGIs $50k-75k, 544.4% for AGIs $100k-200k)
Taxable individual retirement arrangement distribution: $22,800 (reported on 10.0% of returns)
55065:
$22,800
Minnesota:
$20,675
(% of AGI for various income ranges: 631.4% for AGIs $25k-50k, 1852.0% for AGIs $75k-100k)
Total itemized deductions: $27,417 (reported on 10.0% of returns)
Here:
$27,417
State:
$33,311
(% of AGI for various income ranges: 1378.3% for AGIs $50k-75k, 908.9% for AGIs $100k-200k)
Charity contributions: $3,450 (reported on 6.7% of returns)
Here:
$3,450
State:
$11,879
(% of AGI for various income ranges: 276.0% for AGIs $75k-100k)
Taxes paid: $7,317 (reported on 10.0% of returns)
55065:
$7,317
State:
$8,252
(% of AGI for various income ranges: 330.0% for AGIs $50k-75k, 267.8% for AGIs $100k-200k)
Earned income credit: $2,000 (reported on 6.7% of returns)
Here:
$2,000
State:
$2,055
(% of AGI for various income ranges: 133.3% for AGIs below $25k)
Percentage of individuals using paid preparers for their 2020 taxes: 91.7%
Here:
92%
State:
94%
(% for various income ranges: 91.7% for AGIs below $25k, 91.7% for AGIs $25k-50k, 90.0% for AGIs $50k-75k, 87.5% for AGIs $75k-100k, 93.3% for AGIs $100k-200k, 100.0% for AGIs over 200k)
Averages for the 2012 tax year for zip code 55065, filed in 2013:
Average Adjusted Gross Income (AGI) in 2012: $60,247 (Individual Income Tax Returns)
Here:
$60,247
State:
$67,192
Salary/wage: $53,411 (reported on 85.5% of returns)
Here:
$53,411
State:
$55,182
(% of AGI for various income ranges: 76.0% for AGIs below $25k, 82.2% for AGIs $25k-50k, 77.7% for AGIs $50k-75k, 78.7% for AGIs $75k-100k, 71.2% for AGIs $100k-200k)
Taxable interest for individuals: $696 (reported on 41.8% of returns)
This zip code:
$696
Minnesota:
$1,664
(% of AGI for various income ranges: 0.7% for AGIs below $25k, 0.3% for AGIs $25k-50k, 0.8% for AGIs $50k-75k, 0.6% for AGIs $75k-100k, 0.3% for AGIs $100k-200k)
Ordinary dividends: $1,318 (reported on 20.0% of returns)
Here:
$1,318
State:
$5,665
(% of AGI for various income ranges: 0.4% for AGIs $25k-50k, 0.5% for AGIs $50k-75k, 0.3% for AGIs $75k-100k, 0.5% for AGIs $100k-200k)
Net capital gain/loss in AGI: +$3,044 (reported on 16.4% of returns)
Here:
+$3,044
State:
+$16,131
(% of AGI for various income ranges: 1.6% for AGIs $50k-75k, 1.4% for AGIs $100k-200k)
Profit/loss from business: +$9,300 (reported on 14.5% of returns)
Here:
+$9,300
State:
+$12,430
(% of AGI for various income ranges: 11.9% for AGIs below $25k, 2.9% for AGIs $50k-75k, 5.0% for AGIs $75k-100k)
Taxable individual retirement arrangement distribution: $9,650 (reported on 7.3% of returns)
55065:
$9,650
Minnesota:
$15,212
Total itemized deductions: $20,035 (22% of AGI, reported on 47.3% of returns)
Here:
$20,035
State:
$24,665
Here:
22.0% of AGI
State:
19.6% of AGI
(% of AGI for various income ranges: 15.9% for AGIs $25k-50k, 17.6% for AGIs $50k-75k, 15.2% for AGIs $75k-100k, 17.0% for AGIs $100k-200k)
Charity contributions: $2,825 (reported on 36.4% of returns)
Here:
$2,825
State:
$3,948
(% of AGI for various income ranges: 1.8% for AGIs $25k-50k, 1.6% for AGIs $50k-75k, 1.3% for AGIs $75k-100k, 2.1% for AGIs $100k-200k)
Taxes paid: $6,838 (reported on 47.3% of returns)
55065:
$6,838
State:
$10,589
(% of AGI for various income ranges: 3.5% for AGIs $25k-50k, 5.4% for AGIs $50k-75k, 5.1% for AGIs $75k-100k, 6.7% for AGIs $100k-200k)
Earned income credit: $1,660 (reported on 9.1% of returns)
Here:
$1,660
State:
$2,037
(% of AGI for various income ranges: 5.0% for AGIs below $25k)
Percentage of individuals using paid preparers for their 2012 taxes: 60.0%
Here:
60%
State:
55%
(% for various income ranges: 53.3% for AGIs below $25k, 50.0% for AGIs $25k-50k, 60.0% for AGIs $50k-75k, 66.7% for AGIs $75k-100k, 77.8% for AGIs $100k-200k)
Averages for the 2004 tax year for zip code 55065, filed in 2005:
Average Adjusted Gross Income (AGI) in 2004: $47,278 (Individual Income Tax Returns)
Here:
$47,278
State:
$53,560
Salary/wage: $42,530 (reported on 88.0% of returns)
Here:
$42,530
State:
$46,177
(% of AGI for various income ranges: 127.3% for AGIs below $10k, 69.5% for AGIs $10k-25k, 85.4% for AGIs $25k-50k, 82.4% for AGIs $50k-75k, 84.4% for AGIs $75k-100k, 67.2% for AGIs over 100k)
Taxable interest for individuals: $924 (reported on 55.6% of returns)
This zip code:
$924
Minnesota:
$1,796
(% of AGI for various income ranges: 3.7% for AGIs below $10k, 3.6% for AGIs $10k-25k, 0.7% for AGIs $25k-50k, 0.9% for AGIs $50k-75k, 0.5% for AGIs $75k-100k, 1.2% for AGIs over 100k)
Taxable dividends: $569 (reported on 21.8% of returns)
Here:
$569
State:
$3,096
(% of AGI for various income ranges: 0.7% for AGIs below $10k, 0.4% for AGIs $10k-25k, 0.2% for AGIs $25k-50k, 0.1% for AGIs $50k-75k, 0.3% for AGIs $75k-100k, 0.4% for AGIs over 100k)
Net capital gain/loss: +$2,923 (reported on 18.2% of returns)
Here:
+$2,923
State:
+$10,864
(% of AGI for various income ranges: -1.2% for AGIs $10k-25k, 0.1% for AGIs $25k-50k, -0.2% for AGIs $50k-75k, 4.5% for AGIs over 100k)
Profit/loss from business: +$1,025 (reported on 16.0% of returns)
Here:
+$1,025
State:
+$10,442
(% of AGI for various income ranges: -9.1% for AGIs below $10k, 5.3% for AGIs $10k-25k, 0.5% for AGIs $25k-50k, 0.2% for AGIs $50k-75k, 0.2% for AGIs $75k-100k)
IRA payment deduction: $2,312 (reported on 3.2% of returns)
55065:
$2,312
Minnesota:
$2,955
Total itemized deductions: $16,862 (23% of AGI, reported on 46.4% of returns)
Here:
$16,862
State:
$20,035
Here:
22.9% of AGI
State:
21.3% of AGI
(% of AGI for various income ranges: 24.4% for AGIs $10k-25k, 12.3% for AGIs $25k-50k, 18.2% for AGIs $50k-75k, 17.4% for AGIs $75k-100k, 16.6% for AGIs over 100k)
Charity contributions deductions: $2,005 (3% of AGI, reported on 40.4% of returns)
Here:
$2,005
State:
$3,333
Here:
2.6% of AGI
State:
3.4% of AGI
(% of AGI for various income ranges: 3.9% for AGIs $10k-25k, 0.7% for AGIs $25k-50k, 1.5% for AGIs $50k-75k, 2.0% for AGIs $75k-100k, 2.1% for AGIs over 100k)
Total tax: $5,722 (reported on 82.6% of returns)
55065:
$5,722
State:
$8,485
(% of AGI for various income ranges: 4.0% for AGIs below $10k, 5.8% for AGIs $10k-25k, 7.8% for AGIs $25k-50k, 8.4% for AGIs $50k-75k, 9.7% for AGIs $75k-100k, 14.6% for AGIs over 100k)
Earned income credit: $1,647 (reported on 6.8% of returns)
Here:
$1,647
State:
$1,523
Percentage of individuals using paid preparers for their 2004 taxes: 63.0%
Here:
63%
State:
59%
(% for various income ranges: 49.5% for AGIs below $10k, 49.4% for AGIs $10k-25k, 64.1% for AGIs $25k-50k, 75.5% for AGIs $50k-75k, 61.1% for AGIs $75k-100k, 88.9% for AGIs over 100k)
Household received Food Stamps/SNAP in the past 12 months: 11 Household did not receive Food Stamps/SNAP in the past 12 months: 465
Women who had a birth in the past 12 months: 10 (10 now married, 0 unmarried) Women who did not have a birth in the past 12 months: 253 (162 now married, 91 unmarried)
Housing units in zip code 55065 with a mortgage: 302 (76 second mortgage, 74 both second mortgage and home equity loan) Houses without a mortgage: 5
Median monthly owner costs for units with a mortgage: $2,105 Median monthly owner costs for units without a mortgage: $645
Residents with income below the poverty level in 2022:
This zip code:
4.3%
Whole state:
9.6%
Residents with income below 50% of the poverty level in 2022:
This zip code:
2.4%
Whole state:
5.2%
Median number of rooms in houses and condos:
Here:
7.3
State:
7.1
Median number of rooms in apartments:
Here:
6.6
State:
3.8
Notable locations in this zip code not listed on our city pages
Notable locations in zip code 55065: Randolph (A), Randolph - Hampton Fire Department Station 1 Headquarters (B), Randolph City Hall (C). Display/hide their locations on the map
Churches in zip code 55065 include: Saint Marks Lutheran Church (A), Randolph United Methodist Church (B), Randolph Baptist Church (C). Display/hide their locations on the map
In group quarters: 4 (-1 institutionalized population)
Size of family households: 128 2-persons, 64 3-persons, 99 4-persons, 40 5-persons, 12 6-persons, 3 7-or-more-persons
Size of nonfamily households: 87 1-person, 35 2-persons, 2 3-persons
310 married couples with children.
30 single-parent households (19 men, 11 women).
98.9% of residents of 55065 zip code speak English at home.
0.4% of residents speak Spanish at home (60% very well, 40% well).
0.1% of residents speak other Indo-European language at home (100% very well).
Foreign born population: 11 (0.9%) (64.9% of them are naturalized citizens)
This zip code:
0.9%
Whole state:
8.7%
45%Japan
18%Ireland
18%Sweden
18%Honduras
44%German
14%Norwegian
8%American
8%European
4%Czech
3%Swedish
2%French
Year of entry for the foreign-born population
22010 or later
12000 to 2009
01990 to 1999
9Before 1990
Facilities with environmental interests located in this zip code:
FARMERS UNION COOP OIL ASSOCIATION (4411 UPPER 291ST STREET in RANDOLPH, MN)
ENFORCEMENT/COMPLIANCE ACTIVITY (Integrated Compliance Information System)
47.4%Bottled, tank, or LP gas
35.0%Utility gas
10.2%Electricity
4.5%Fuel oil, kerosene, etc.
2.8%Wood
0.6%Other fuel
Population in 1990: 370. Population change in the 1990s: +610 (+164.9%).
Place of birth for U.S.-born residents:
This state: 1,077
Northeast: 1
Midwest: 164
South: 11
West: 24
62% of the 55065 zip code residents lived in the same house 5 years ago. Out of people who lived in different houses, 36% lived in this county. Out of people who lived in different counties, 50% lived in Minnesota.
98% of the 55065 zip code residents lived in the same house 1 year ago. Out of people who lived in different houses, 89% moved from this county. Out of people who lived in different houses, 11% moved from different county within same state. Out of people who lived in different houses, 11% moved from abroad.
Private vs. public school enrollment:
Students in private schools in grades 1 to 8 (elementary and middle school): 1
Here:
0.6%
Minnesota:
12.9%
Students in private schools in grades 9 to 12 (high school):
Here:
0.0%
Minnesota:
8.6%
Students in private undergraduate colleges: 5
Here:
22.9%
Minnesota:
26.2%
Occupation by median earnings in the past 12 months ($)
156,041Management occupations
145,461Computer and mathematical occupations
105,913Architecture and engineering occupations
89,585Law enforcement workers including supervisors
83,643Construction and extraction occupations
83,064Business and financial operations occupations
Top industries in this zip code by the number of employees in 2005:
Administrative and Support and Waste Management and Remediation Services: Landscaping Services (10-19 employees: 1 establishment)
Accommodation and Food Services: Drinking Places (Alcoholic Beverages) (10-19: 1)
Wholesale Trade: Farm and Garden Machinery and Equipment Merchant Wholesalers (1-4: 4)
Wholesale Trade: Industrial Machinery and Equipment Merchant Wholesalers (1-4: 2)
Other Services (except Public Administration): Religious Organizations (1-4: 2)
Other Services (except Public Administration): Pet Care (except Veterinary) Services (1-4: 2)
People in group quarters in 2010:
4 people in group homes intended for adults
People in group quarters in 2000:
4 people in homes for the mentally retarded
Fatal accident statistics in 2013:
Fatal accident count: 1
Vehicles involved in fatal accidents: 2
Fatal accidents caused by drunken drivers: 0
Fatalities: 2
Persons involved in fatal accidents: 7
Pedestrians involved in fatal accidents: 0
Fatal accident statistics in 2011:
Fatal accident count: 1
Vehicles involved in fatal accidents: 2
Fatal accidents caused by drunken drivers: 0
Fatalities: 2
Persons involved in fatal accidents: 3
Pedestrians involved in fatal accidents: 0
Home Mortgage Disclosure Act Aggregated Statistics For Year 2009 (Based on 6 partial tracts)
A) FHA, FSA/RHS & VA Home Purchase Loans
B) Conventional Home Purchase Loans
C) Refinancings
D) Home Improvement Loans
F) Non-occupant Loans on < 5 Family Dwellings (A B C & D)
G) Loans On Manufactured Home Dwelling (A B C & D)
Number
Average Value
Number
Average Value
Number
Average Value
Number
Average Value
Number
Average Value
Number
Average Value
LOANS ORIGINATED
10
$196,768
10
$204,130
90
$209,501
7
$102,877
2
$402,965
0
$0
APPLICATIONS APPROVED, NOT ACCEPTED
1
$177,700
0
$0
7
$212,864
1
$52,570
0
$0
0
$0
APPLICATIONS DENIED
2
$172,870
2
$137,390
21
$234,925
3
$50,550
1
$104,410
1
$126,710
APPLICATIONS WITHDRAWN
1
$187,030
2
$141,115
20
$245,198
2
$166,170
0
$0
0
$0
FILES CLOSED FOR INCOMPLETENESS
0
$0
0
$0
5
$212,140
0
$0
0
$0
0
$0
Aggregated Statistics For Year 2008 (Based on 6 partial tracts)
A) FHA, FSA/RHS & VA Home Purchase Loans
B) Conventional Home Purchase Loans
C) Refinancings
D) Home Improvement Loans
F) Non-occupant Loans on < 5 Family Dwellings (A B C & D)
G) Loans On Manufactured Home Dwelling (A B C & D)
Number
Average Value
Number
Average Value
Number
Average Value
Number
Average Value
Number
Average Value
Number
Average Value
LOANS ORIGINATED
6
$208,708
16
$215,125
41
$212,004
10
$76,240
3
$186,070
1
$118,330
APPLICATIONS APPROVED, NOT ACCEPTED
0
$0
1
$96,720
6
$243,088
1
$18,790
0
$0
0
$0
APPLICATIONS DENIED
0
$0
5
$247,796
28
$271,347
3
$148,560
1
$136,780
1
$54,070
APPLICATIONS WITHDRAWN
0
$0
4
$186,515
11
$241,873
1
$28,770
1
$202,430
0
$0
FILES CLOSED FOR INCOMPLETENESS
0
$0
0
$0
3
$257,347
1
$173,350
0
$0
0
$0
Aggregated Statistics For Year 2007 (Based on 6 partial tracts)
A) FHA, FSA/RHS & VA Home Purchase Loans
B) Conventional Home Purchase Loans
C) Refinancings
D) Home Improvement Loans
F) Non-occupant Loans on < 5 Family Dwellings (A B C & D)
G) Loans On Manufactured Home Dwelling (A B C & D)
Number
Average Value
Number
Average Value
Number
Average Value
Number
Average Value
Number
Average Value
Number
Average Value
LOANS ORIGINATED
4
$206,448
40
$192,324
57
$205,307
13
$82,792
5
$109,346
0
$0
APPLICATIONS APPROVED, NOT ACCEPTED
0
$0
6
$259,668
15
$237,736
1
$158,940
0
$0
0
$0
APPLICATIONS DENIED
0
$0
6
$239,995
40
$214,779
6
$136,585
4
$246,982
1
$79,490
APPLICATIONS WITHDRAWN
0
$0
3
$197,153
14
$272,794
2
$129,705
1
$150,010
0
$0
FILES CLOSED FOR INCOMPLETENESS
0
$0
1
$102,320
6
$224,508
0
$0
0
$0
0
$0
Aggregated Statistics For Year 2006 (Based on 6 partial tracts)
A) FHA, FSA/RHS & VA Home Purchase Loans
B) Conventional Home Purchase Loans
C) Refinancings
D) Home Improvement Loans
F) Non-occupant Loans on < 5 Family Dwellings (A B C & D)
G) Loans On Manufactured Home Dwelling (A B C & D)
Number
Average Value
Number
Average Value
Number
Average Value
Number
Average Value
Number
Average Value
Number
Average Value
LOANS ORIGINATED
5
$179,864
46
$181,797
61
$203,637
11
$63,373
4
$196,592
0
$0
APPLICATIONS APPROVED, NOT ACCEPTED
0
$0
6
$230,793
13
$194,792
2
$114,100
1
$381,260
0
$0
APPLICATIONS DENIED
0
$0
8
$188,076
27
$253,977
4
$59,025
2
$162,355
1
$174,170
APPLICATIONS WITHDRAWN
0
$0
5
$259,690
20
$218,706
2
$83,005
0
$0
0
$0
FILES CLOSED FOR INCOMPLETENESS
0
$0
2
$118,555
7
$226,871
1
$189,410
0
$0
0
$0
Aggregated Statistics For Year 2005 (Based on 6 partial tracts)
A) FHA, FSA/RHS & VA Home Purchase Loans
B) Conventional Home Purchase Loans
C) Refinancings
D) Home Improvement Loans
F) Non-occupant Loans on < 5 Family Dwellings (A B C & D)
G) Loans On Manufactured Home Dwelling (A B C & D)
Number
Average Value
Number
Average Value
Number
Average Value
Number
Average Value
Number
Average Value
Number
Average Value
LOANS ORIGINATED
5
$204,374
58
$186,528
74
$204,950
17
$51,146
5
$187,730
2
$153,385
APPLICATIONS APPROVED, NOT ACCEPTED
0
$0
7
$183,061
16
$190,154
1
$233,900
1
$124,730
0
$0
APPLICATIONS DENIED
1
$136,140
12
$189,667
28
$220,596
4
$104,840
2
$161,185
2
$43,125
APPLICATIONS WITHDRAWN
0
$0
7
$249,151
31
$213,599
2
$45,180
1
$137,410
0
$0
FILES CLOSED FOR INCOMPLETENESS
0
$0
1
$124,830
10
$184,415
1
$71,690
1
$91,980
0
$0
Aggregated Statistics For Year 2004 (Based on 6 partial tracts)
A) FHA, FSA/RHS & VA Home Purchase Loans
B) Conventional Home Purchase Loans
C) Refinancings
D) Home Improvement Loans
F) Non-occupant Loans on < 5 Family Dwellings (A B C & D)
G) Loans On Manufactured Home Dwelling (A B C & D)
Number
Average Value
Number
Average Value
Number
Average Value
Number
Average Value
Number
Average Value
Number
Average Value
LOANS ORIGINATED
4
$154,252
50
$194,458
96
$182,123
16
$62,757
6
$139,593
1
$105,600
APPLICATIONS APPROVED, NOT ACCEPTED
0
$0
5
$231,300
17
$183,247
1
$66,190
0
$0
0
$0
APPLICATIONS DENIED
0
$0
9
$224,116
34
$202,521
3
$30,660
3
$173,670
1
$76,530
APPLICATIONS WITHDRAWN
0
$0
5
$218,540
30
$197,795
2
$55,165
2
$222,100
0
$0
FILES CLOSED FOR INCOMPLETENESS
0
$0
1
$262,560
8
$212,468
0
$0
1
$122,190
0
$0
Aggregated Statistics For Year 2003 (Based on 6 partial tracts)
A) FHA, FSA/RHS & VA Home Purchase Loans
B) Conventional Home Purchase Loans
C) Refinancings
D) Home Improvement Loans
F) Non-occupant Loans on < 5 Family Dwellings (A B C & D)
Number
Average Value
Number
Average Value
Number
Average Value
Number
Average Value
Number
Average Value
LOANS ORIGINATED
8
$176,372
42
$186,976
223
$169,781
16
$35,304
5
$138,532
APPLICATIONS APPROVED, NOT ACCEPTED
0
$0
5
$169,560
19
$153,368
2
$26,235
1
$50,240
APPLICATIONS DENIED
0
$0
4
$82,580
37
$167,952
3
$53,837
2
$64,735
APPLICATIONS WITHDRAWN
0
$0
3
$280,387
36
$175,609
0
$0
0
$0
FILES CLOSED FOR INCOMPLETENESS
0
$0
0
$0
9
$192,529
0
$0
0
$0
Aggregated Statistics For Year 1999 (Based on 2 partial tracts)


 Nearest zip codes: 55031, 55024, 55018, 55085, 55057, 55009.


