Estimated zip code population in 2022: 4,229 Zip code population in 2010: 4,518 Zip code population in 2000: 1,907
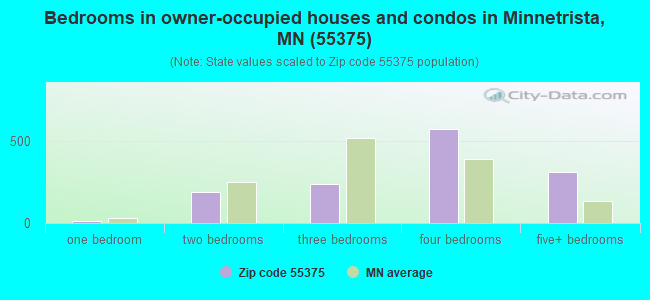
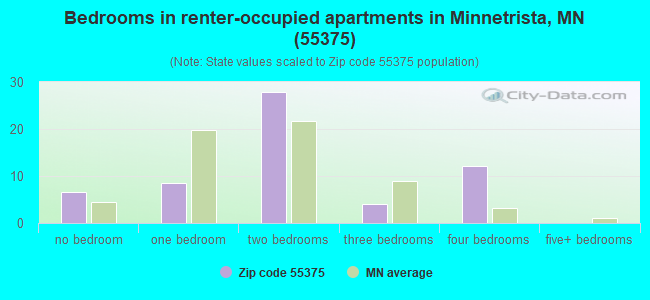
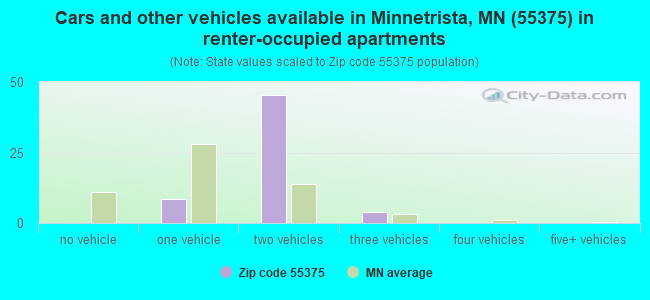
Houses and condos: 1,506 Renter-occupied apartments: 59
% of renters here:
4%
State:
28%
March 2022 cost of living index in zip code 55375: 112.4 (more than average, U.S. average is 100)
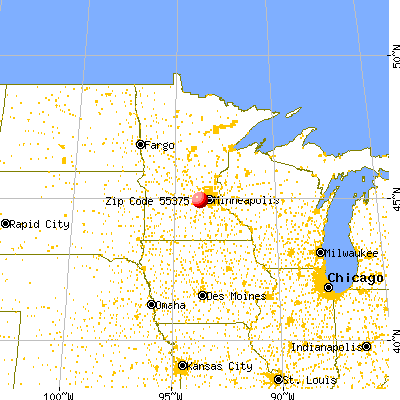
Land area: 5.2 sq. mi. Water area: 0.3 sq. mi.
Population density: 806 people per square mile
(low).
OSM Map
General Map
Google Map
MSN Map
OSM Map
General Map
Google Map
MSN Map
OSM Map
General Map
Google Map
MSN Map
OSM Map
General Map
Google Map
MSN Map
Please wait while loading the map...
Real estate property taxes paid for housing units in 2022:
This zip code:
1.0% ($4,195)
Minnesota:
1.0% ($3,087)
Median real estate property taxes paid for housing units with mortgages in 2022: $4,231 (1.0%) Median real estate property taxes paid for housing units with no mortgage in 2022: $3,975 (1.0%)
Business Search- 14 Million verified businesses
Males: 2,266
(53.6%)
Females: 1,963
(46.4%)
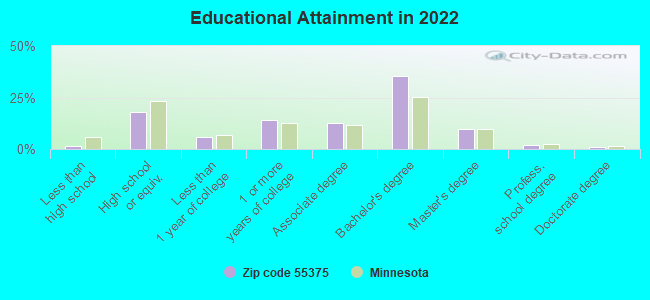
For population 25 years and over in 55375:
High school or higher: 98.7%
Bachelor's degree or higher: 48.6%
Graduate or professional degree: 13.0%
Unemployed: 1.8%
Mean travel time to work (commute): 26.8 minutes
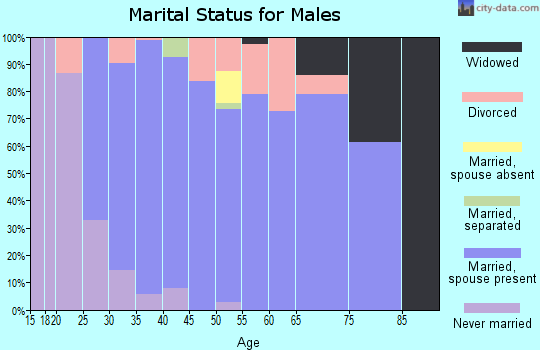
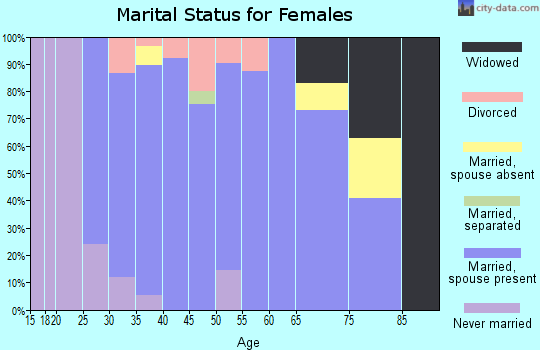
For population 15 years and over in 55375:
Never married: 30.1%
Now married: 62.4%
Separated: 0.5%
Widowed: 1.9%
Divorced: 5.2%
Zip code 55375 compared to state average:
Unemployed percentage below state average.
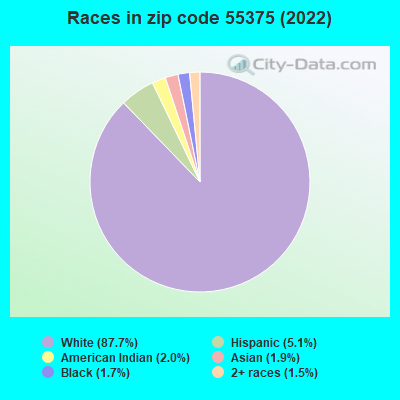
Black race population percentage significantly below state average.
Median age below state average.
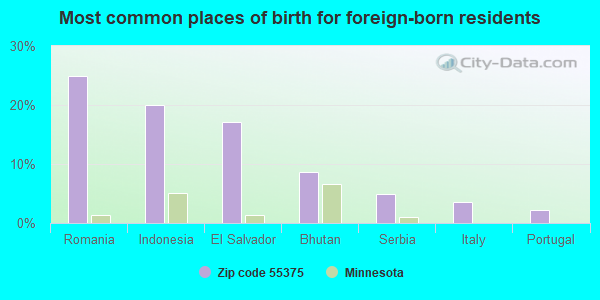
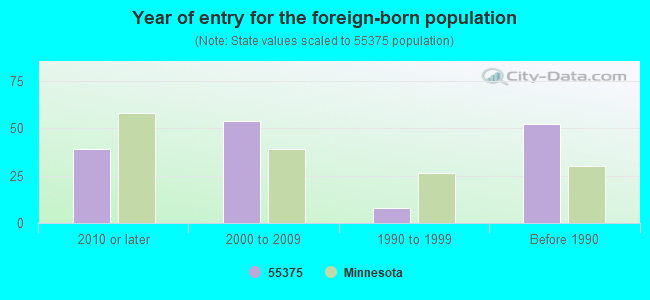
Foreign-born population percentage significantly below state average.
Renting percentage significantly below state average.
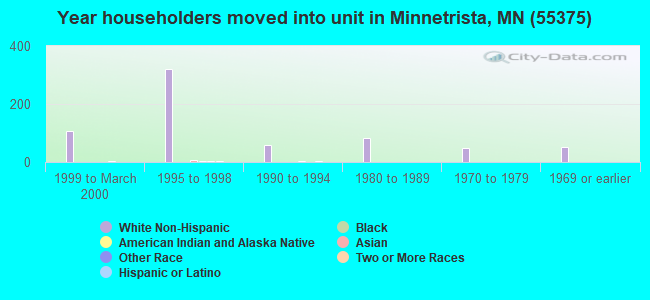
Length of stay since moving in significantly above state average.
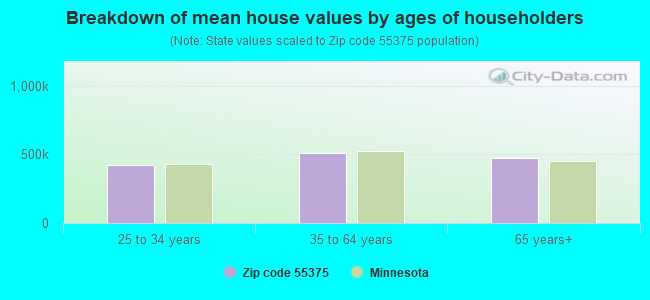
Estimated median house/condo value in 2022: $410,472
55375:
$410,472
Minnesota:
$314,600
Median resident age:
This zip code:
34.5 years
Minnesota median age:
39.0 years
Average household size:
This zip code:
2.8 people
Minnesota:
2.4 people
Averages for the 2020 tax year for zip code 55375, filed in 2021:
Average Adjusted Gross Income (AGI) in 2020: $93,976 (Individual Income Tax Returns)
Here:
$93,976
State:
$82,178
Salary/wage: $88,773 (reported on 88.9% of returns)
Here:
$88,773
State:
$67,438
(% of AGI for various income ranges: 1378.4% for AGIs below $25k, 3813.3% for AGIs $25k-50k, 7068.0% for AGIs $50k-75k, 10168.3% for AGIs $75k-100k, 23812.7% for AGIs $100k-200k, 61826.3% for AGIs over 200k)
Taxable interest for individuals: $758 (reported on 34.7% of returns)
This zip code:
$758
Minnesota:
$1,814
(% of AGI for various income ranges: 12.9% for AGIs below $25k, 35.4% for AGIs $25k-50k, 28.0% for AGIs $50k-75k, 26.7% for AGIs $75k-100k, 64.0% for AGIs $100k-200k, 165.0% for AGIs over 200k)
Ordinary dividends: $2,185 (reported on 26.6% of returns)
Here:
$2,185
State:
$6,928
(% of AGI for various income ranges: 21.9% for AGIs below $25k, 84.2% for AGIs $25k-50k, 53.3% for AGIs $50k-75k, 135.8% for AGIs $75k-100k, 154.3% for AGIs $100k-200k, 227.5% for AGIs over 200k)
Net capital gain/loss in AGI: +$4,671 (reported on 24.6% of returns)
Here:
+$4,671
State:
+$20,591
(% of AGI for various income ranges: 32.9% for AGIs below $25k, 44.2% for AGIs $25k-50k, 70.0% for AGIs $50k-75k, 204.2% for AGIs $75k-100k, 435.0% for AGIs $100k-200k, 532.5% for AGIs over 200k)
Profit/loss from business: +$13,872 (reported on 16.1% of returns)
Here:
+$13,872
State:
+$14,342
(% of AGI for various income ranges: 71.3% for AGIs below $25k, 248.3% for AGIs $25k-50k, 502.7% for AGIs $50k-75k, 399.2% for AGIs $75k-100k, 426.0% for AGIs $100k-200k, 1388.8% for AGIs over 200k)
Taxable individual retirement arrangement distribution: $20,665 (reported on 8.5% of returns)
55375:
$20,665
Minnesota:
$20,675
(% of AGI for various income ranges: 65.5% for AGIs below $25k, 262.9% for AGIs $25k-50k, 456.7% for AGIs $50k-75k, 664.7% for AGIs $100k-200k)
Total itemized deductions: $28,150 (reported on 13.1% of returns)
Here:
$28,150
State:
$33,311
(% of AGI for various income ranges: 178.4% for AGIs below $25k, 372.7% for AGIs $50k-75k, 634.2% for AGIs $75k-100k, 1121.0% for AGIs $100k-200k, 2603.8% for AGIs over 200k)
Charity contributions: $6,924 (reported on 10.6% of returns)
Here:
$6,924
State:
$11,879
(% of AGI for various income ranges: 58.3% for AGIs $25k-50k, 76.7% for AGIs $75k-100k, 241.7% for AGIs $100k-200k, 621.2% for AGIs over 200k)
Taxes paid: $8,669 (reported on 13.1% of returns)
55375:
$8,669
State:
$8,252
(% of AGI for various income ranges: 32.9% for AGIs below $25k, 108.0% for AGIs $50k-75k, 223.3% for AGIs $75k-100k, 381.3% for AGIs $100k-200k, 722.5% for AGIs over 200k)
Earned income credit: $1,620 (reported on 5.0% of returns)
Here:
$1,620
State:
$2,055
(% of AGI for various income ranges: 23.5% for AGIs below $25k, 37.1% for AGIs $25k-50k)
Percentage of individuals using paid preparers for their 2020 taxes: 94.5%
Here:
94%
State:
94%
(% for various income ranges: 93.8% for AGIs below $25k, 93.9% for AGIs $25k-50k, 91.3% for AGIs $50k-75k, 88.9% for AGIs $75k-100k, 96.5% for AGIs $100k-200k, 100.0% for AGIs over 200k)
Averages for the 2012 tax year for zip code 55375, filed in 2013:
Average Adjusted Gross Income (AGI) in 2012: $80,172 (Individual Income Tax Returns)
Here:
$80,172
State:
$67,192
Salary/wage: $75,846 (reported on 89.8% of returns)
Here:
$75,846
State:
$55,182
(% of AGI for various income ranges: 73.1% for AGIs below $25k, 81.5% for AGIs $25k-50k, 81.6% for AGIs $50k-75k, 85.6% for AGIs $75k-100k, 88.8% for AGIs $100k-200k, 79.7% for AGIs over 200k)
Taxable interest for individuals: $429 (reported on 39.8% of returns)
This zip code:
$429
Minnesota:
$1,664
(% of AGI for various income ranges: 0.9% for AGIs below $25k, 0.5% for AGIs $25k-50k, 0.3% for AGIs $50k-75k, 0.3% for AGIs $75k-100k, 0.1% for AGIs $100k-200k, 0.2% for AGIs over 200k)
Ordinary dividends: $1,868 (reported on 26.7% of returns)
Here:
$1,868
State:
$5,665
(% of AGI for various income ranges: 3.2% for AGIs below $25k, 1.2% for AGIs $25k-50k, 0.5% for AGIs $50k-75k, 0.5% for AGIs $75k-100k, 0.5% for AGIs $100k-200k, 0.4% for AGIs over 200k)
Net capital gain/loss in AGI: +$2,738 (reported on 22.2% of returns)
Here:
+$2,738
State:
+$16,131
(% of AGI for various income ranges: 0.3% for AGIs $75k-100k, 0.7% for AGIs $100k-200k, 2.4% for AGIs over 200k)
Profit/loss from business: +$13,633 (reported on 17.0% of returns)
Here:
+$13,633
State:
+$12,430
(% of AGI for various income ranges: 7.8% for AGIs below $25k, 4.1% for AGIs $25k-50k, 5.1% for AGIs $50k-75k, 4.3% for AGIs $75k-100k, 2.6% for AGIs $100k-200k)
Taxable individual retirement arrangement distribution: $12,706 (reported on 10.2% of returns)
55375:
$12,706
Minnesota:
$15,212
(% of AGI for various income ranges: 4.2% for AGIs below $25k, 2.6% for AGIs $25k-50k, 2.9% for AGIs $50k-75k, 1.4% for AGIs $75k-100k, 1.7% for AGIs $100k-200k)
Self-employment retirement plans: $11,450 (reported on 1.1% of returns)
55375:
$11,450
Minnesota:
$17,874
Total itemized deductions: $23,446 (21% of AGI, reported on 60.2% of returns)
Here:
$23,446
State:
$24,665
Here:
20.7% of AGI
State:
19.6% of AGI
(% of AGI for various income ranges: 13.4% for AGIs below $25k, 14.3% for AGIs $25k-50k, 17.6% for AGIs $50k-75k, 19.7% for AGIs $75k-100k, 18.9% for AGIs $100k-200k, 14.6% for AGIs over 200k)
Charity contributions: $2,392 (reported on 52.3% of returns)
Here:
$2,392
State:
$3,948
(% of AGI for various income ranges: 0.8% for AGIs below $25k, 1.3% for AGIs $25k-50k, 1.5% for AGIs $50k-75k, 1.6% for AGIs $75k-100k, 1.7% for AGIs $100k-200k, 1.5% for AGIs over 200k)
Taxes paid: $9,327 (reported on 60.2% of returns)
55375:
$9,327
State:
$10,589
(% of AGI for various income ranges: 3.1% for AGIs below $25k, 3.8% for AGIs $25k-50k, 5.7% for AGIs $50k-75k, 6.8% for AGIs $75k-100k, 7.8% for AGIs $100k-200k, 7.9% for AGIs over 200k)
Earned income credit: $2,131 (reported on 7.4% of returns)
Here:
$2,131
State:
$2,037
(% of AGI for various income ranges: 4.0% for AGIs below $25k, 0.8% for AGIs $25k-50k)
Percentage of individuals using paid preparers for their 2012 taxes: 50.6%
Here:
51%
State:
55%
(% for various income ranges: 40.9% for AGIs below $25k, 50.0% for AGIs $25k-50k, 54.5% for AGIs $50k-75k, 54.2% for AGIs $75k-100k, 55.1% for AGIs $100k-200k, 55.6% for AGIs over 200k)
Averages for the 2004 tax year for zip code 55375, filed in 2005:
Average Adjusted Gross Income (AGI) in 2004: $60,310 (Individual Income Tax Returns)
Here:
$60,310
State:
$53,560
Salary/wage: $56,157 (reported on 92.9% of returns)
Here:
$56,157
State:
$46,177
(% of AGI for various income ranges: 107.3% for AGIs below $10k, 80.9% for AGIs $10k-25k, 85.8% for AGIs $25k-50k, 88.5% for AGIs $50k-75k, 90.0% for AGIs $75k-100k, 84.0% for AGIs over 100k)
Taxable interest for individuals: $692 (reported on 48.0% of returns)
This zip code:
$692
Minnesota:
$1,796
(% of AGI for various income ranges: 0.7% for AGIs below $10k, 1.0% for AGIs $10k-25k, 0.9% for AGIs $25k-50k, 0.4% for AGIs $50k-75k, 0.5% for AGIs $75k-100k, 0.5% for AGIs over 100k)
Taxable dividends: $784 (reported on 28.0% of returns)
Here:
$784
State:
$3,096
(% of AGI for various income ranges: 1.9% for AGIs below $10k, 0.8% for AGIs $10k-25k, 0.7% for AGIs $25k-50k, 0.2% for AGIs $50k-75k, 0.2% for AGIs $75k-100k, 0.3% for AGIs over 100k)
Net capital gain/loss: +$7,464 (reported on 23.1% of returns)
Here:
+$7,464
State:
+$10,864
(% of AGI for various income ranges: -3.0% for AGIs below $10k, 0.4% for AGIs $10k-25k, 0.1% for AGIs $25k-50k, 0.0% for AGIs $50k-75k, 0.2% for AGIs $75k-100k, 6.9% for AGIs over 100k)
Profit/loss from business: +$12,606 (reported on 19.0% of returns)
Here:
+$12,606
State:
+$10,442
(% of AGI for various income ranges: 2.1% for AGIs below $10k, 6.7% for AGIs $10k-25k, 5.8% for AGIs $25k-50k, 5.1% for AGIs $50k-75k, 3.1% for AGIs $75k-100k, 3.0% for AGIs over 100k)
IRA payment deduction: $2,400 (reported on 3.1% of returns)
55375:
$2,400
Minnesota:
$2,955
Self-employed pension: $4,133 (reported on 1.0% of returns)
Here:
$4,133
Minnesota:
$12,099
Total itemized deductions: $19,478 (23% of AGI, reported on 60.4% of returns)
Here:
$19,478
State:
$20,035
Here:
23.2% of AGI
State:
21.3% of AGI
(% of AGI for various income ranges: 19.9% for AGIs $10k-25k, 19.1% for AGIs $25k-50k, 22.9% for AGIs $50k-75k, 21.2% for AGIs $75k-100k, 17.6% for AGIs over 100k)
Charity contributions deductions: $1,775 (2% of AGI, reported on 54.4% of returns)
Here:
$1,775
State:
$3,333
Here:
2.0% of AGI
State:
3.4% of AGI
(% of AGI for various income ranges: 1.3% for AGIs $10k-25k, 1.4% for AGIs $25k-50k, 2.3% for AGIs $50k-75k, 1.8% for AGIs $75k-100k, 1.3% for AGIs over 100k)
Total tax: $7,554 (reported on 85.6% of returns)
55375:
$7,554
State:
$8,485
(% of AGI for various income ranges: 2.7% for AGIs below $10k, 5.0% for AGIs $10k-25k, 7.9% for AGIs $25k-50k, 8.5% for AGIs $50k-75k, 9.0% for AGIs $75k-100k, 14.4% for AGIs over 100k)
Earned income credit: $1,529 (reported on 4.7% of returns)
Here:
$1,529
State:
$1,523
Percentage of individuals using paid preparers for their 2004 taxes: 54.9%
Here:
55%
State:
59%
(% for various income ranges: 38.6% for AGIs below $10k, 51.6% for AGIs $10k-25k, 56.3% for AGIs $25k-50k, 60.9% for AGIs $50k-75k, 60.8% for AGIs $75k-100k, 57.4% for AGIs over 100k)
Household received Food Stamps/SNAP in the past 12 months: 0 Household did not receive Food Stamps/SNAP in the past 12 months: 1,363
Women who had a birth in the past 12 months: 37 (37 now married, 0 unmarried) Women who did not have a birth in the past 12 months: 965 (526 now married, 439 unmarried)
Housing units in zip code 55375 with a mortgage: 998 (47 second mortgage, 32 both second mortgage and home equity loan) Houses without a mortgage: 8
Median monthly owner costs for units with a mortgage: $2,179 Median monthly owner costs for units without a mortgage: $712
Residents with income below the poverty level in 2022:
This zip code:
1.3%
Whole state:
9.6%
Residents with income below 50% of the poverty level in 2022:
This zip code:
1.3%
Whole state:
5.2%
Median number of rooms in houses and condos:
Here:
8.0
State:
7.1
Median number of rooms in apartments:
Here:
3.3
State:
3.8
Notable locations in this zip code not listed on our city pages
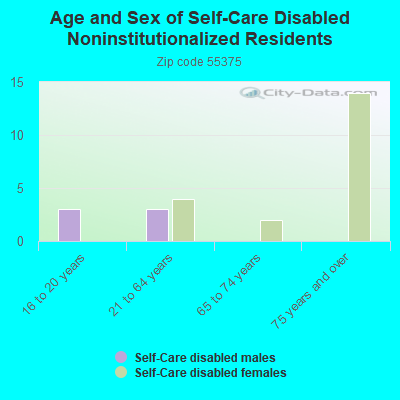
In group quarters: 410 (-1 institutionalized population)
Size of family households: 418 2-persons, 232 3-persons, 254 4-persons, 98 5-persons, 56 6-persons, 13 7-or-more-persons
Size of nonfamily households: 242 1-person, 45 2-persons
1,140 married couples with children.
72 single-parent households (16 men, 56 women).
94.7% of residents of 55375 zip code speak English at home.
2.6% of residents speak Spanish at home (86% very well, 14% not well).
0.4% of residents speak other Indo-European language at home (100% very well).
1.2% of residents speak Asian or Pacific Island language at home (22% very well, 67% well, 10% not well).
Foreign born population: 143 (3.4%) (88.1% of them are naturalized citizens)
This zip code:
3.4%
Whole state:
8.7%
25%Romania
20%Indonesia
17%El Salvador
9%Bhutan
5%Serbia
4%Italy
2%Portugal
27%German
9%Norwegian
7%American
7%Irish
6%European
4%English
3%Polish
Year of entry for the foreign-born population
392010 or later
542000 to 2009
81990 to 1999
52Before 1990
Facilities with environmental interests located in this zip code:
MN SPECIALIZED TRUCKING, INC (4350 MAIN ST in ST BONIFACIUS, MN)
STATE MASTER (Minnesota Pollution Control Agency permits and compilance tracking) - RCRIS-MNR000116251, SQG Small Quantity Generators, between 100 kg and 1000 kg of hazardous waste/month (Resource Conservation and Recovery Act (tracking hazardous waste)) Business SIC classification: LOCAL TRUCKING WITHOUT STORAGE Business NAICS classification: GENERAL FREIGHT TRUCKING, LOCAL. Organizations: LINDA FORSETH (CONTACT/OPERATOR)
, MN SPECIALIZED TRUCKING INC (CONTACT/OWNER)
NORWESCO INC FLUID SYSTEMS (4365 STEINER ST in SAINT BONIFACIUS, MN)
STATE MASTER (Minnesota Pollution Control Agency permits and compilance tracking) - RCRAINFO-MND038373973, CESQG, PCS-038373973, GENERAL PERMIT STORM WATER IND, NPDES STORMWATER PERMIT, RCRIS-MND038373973, CESQG Small Quantity Generators, between 100 kg and 1000 kg of hazardous waste/month (Resource Conservation and Recovery Act (tracking hazardous waste)) - notification Business SIC classification: PLASTICS PRODUCTS Business NAICS classification: UNLAMINATED PLASTICS PROFILE SHAPE MANUFACTURING. Organizations: MIBCO (CONTACT/OWNER)
BRADLEY COLLISION (4250 CREEKVIEW CIR in SAINT BONIFACIUS, MN)
STATE MASTER (Minnesota Pollution Control Agency permits and compilance tracking) - RCRAINFO-MND985698257, HAZARDOUS WASTE PROGRAM, RCRIS-MND985698257, Conditionally Exempt Small Quantity Generators, less than 100 kg/month of hazardous waste (Resource Conservation and Recovery Act (tracking hazardous waste)) - notification Business SIC classification: GENERAL AUTOMOTIVE REPAIR SHOPS Business NAICS classification: GENERAL AUTOMOTIVE REPAIR. Organizations: QUAAS BRADLEY (CONTACT/OWNER)
, BRADLEY S COLLISION INC (CONTACT/OWNER)
Alternative names: BRADLEYS COLLISION
GREAT RIVER ENERGY SAINT BONIFACIUS PEAKING (STATE HIGHWAY 7 AND COUNTY ROAD 10 in SAINT BONIFACIUS, MN)
AIR MAJOR (AIRS/AFS) STATE MASTER (Minnesota Pollution Control Agency permits and compilance tracking) - AIRS-2701900010, AIR PROGRAM, AFS-2701900010, AIR MAJOR CRITERIA AND HAZARDOUS AIR POLLUTANT INVENTORY (Inventory of air pollution sources) Business SIC classification: ELECTRIC SERVICES Organizations: COOPERATIVE POWER ASSOCIATION (CONTACT/OWNER)
Alternative names: COOP POWER ASSN, GREAT RIVER ENERGY - ST BONIFACIUS, ST BONIFACIUS PEAKNG
HENNEN ENGINE PARTS AND MACHINE INC (4394 STEINER ST in SAINT BONIFACIUS, MN)
STATE MASTER (Minnesota Pollution Control Agency permits and compilance tracking) - RCRAINFO-MNR000017756, CESQG, RCRIS-MNR000017756, Conditionally Exempt Small Quantity Generators, less than 100 kg/month of hazardous waste (Resource Conservation and Recovery Act (tracking hazardous waste)) - notification Organizations: HENNEN KEITH (CONTACT/OWNER)
, HENNEN ENGINE PARTS & MACHINE INC (CONTACT/OWNER)
EXCELSIOR BOAT REFINISHING (4340 MAIN ST in SAINT BONIFACIUS, MN)
STATE MASTER (Minnesota Pollution Control Agency permits and compilance tracking) - RCRAINFO-MND985771005, CESQG, RCRIS-MND985771005, Conditionally Exempt Small Quantity Generators, less than 100 kg/month of hazardous waste (Resource Conservation and Recovery Act (tracking hazardous waste)) - notification Alternative names: EXCELSIOR BOAT REFINISHERS
NIKE BATTERY LAUNCH SITE (9200 NIKE RD in ST BONIFACIUS, MN)
Small Quantity Generators, between 100 kg and 1000 kg of hazardous waste/month (Resource Conservation and Recovery Act (tracking hazardous waste)) - notification TRANSPORTER (Resource Conservation and Recovery Act (tracking hazardous waste)) - notification Organizations: W AREA FIRE TRAINING ACADEMY (CONTACT/OWNER)
Housing units lacking complete plumbing facilities: 0.3% Housing units lacking complete kitchen facilities: 1.1%
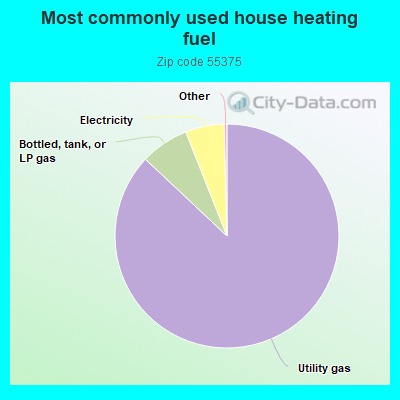
87.2%Utility gas
7.0%Bottled, tank, or LP gas
5.6%Electricity
Place of birth for U.S.-born residents:
This state: 2,902
Northeast: 112
Midwest: 759
South: 125
West: 162
43% of the 55375 zip code residents lived in the same house 5 years ago. Out of people who lived in different houses, 50% lived in this county. Out of people who lived in different counties, 50% lived in Minnesota.
92% of the 55375 zip code residents lived in the same house 1 year ago. Out of people who lived in different houses, 40% moved from this county. Out of people who lived in different houses, 50% moved from different county within same state. Out of people who lived in different houses, 10% moved from different state.
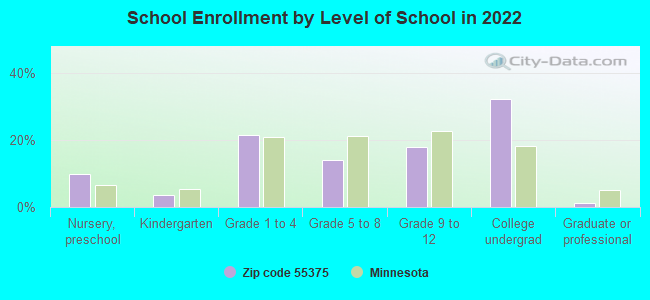
Private vs. public school enrollment:
Students in private schools in grades 1 to 8 (elementary and middle school): 99
Here:
18.1%
Minnesota:
12.9%
Students in private schools in grades 9 to 12 (high school): 15
Here:
5.7%
Minnesota:
8.6%
Students in private undergraduate colleges: 332
Here:
64.5%
Minnesota:
26.2%
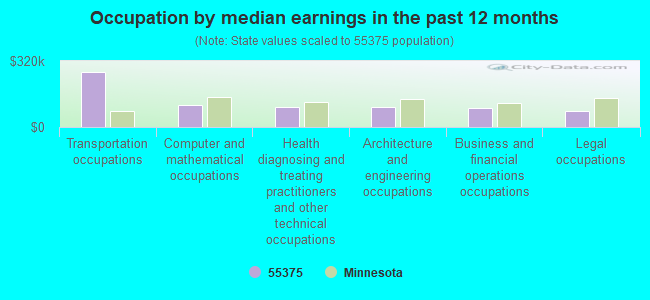
Occupation by median earnings in the past 12 months ($)
264,244Transportation occupations
106,465Computer and mathematical occupations
96,989Health diagnosing and treating practitioners and other technical occupations
96,050Architecture and engineering occupations
91,707Business and financial operations occupations
78,711Legal occupations
Companies with federal contracts located in this zip code:
TECHNICAL ORDNANCE, INC (9200 NIKE ROAD in SAINT BONIFACI, MN; small business) : $75,774,968 in 120 contractsfrom 1999 to 2006
Contracts for Cartridge and Propellant Actuated Devices and Components, Demolition Materials, Underwater Mine Explosive Components, Ammunition, over 125 mm, and moreby Air Force, Army, Navy Signed by year:2000: $7,959,893; 2001: $5,312,610; 2002: $9,292,686; 2003: $11,772,239; 2004: $21,591,779; 2005: $17,162,346; 2006: $2,089,290.
Biggest contracts:
$8,594,999 with Air Force for Cartridge and Propellant Actuated Devices and Components. Signed on 2005-02-22. Completion date: 2006-10-31.
$8,194,199, same as above.Signed on 2004-04-23. Completion date: 2006-02-28.
$6,598,599, same as above.Signed on 2003-11-14. Completion date: 2004-12-31.
$3,143,620, same as above.Signed on 2002-09-25. Completion date: 2003-12-31.
Top industries in this zip code by the number of employees in 2005:
Educational Services: Colleges, Universities, and Professional Schools (250-499 employees: 1 establishment)
Accommodation and Food Services: Food Service Contractors (50-99: 1, 1-4: 1)
Management of Companies and Enterprises: Corporate, Subsidiary, and Regional Managing Offices (20-49: 1)
Health Care and Social Assistance: Services for the Elderly and Persons with Disabilities (20-49: 1)
Other Services (except Public Administration): Religious Organizations (10-19: 1, 5-9: 2, 1-4: 1)
Construction: Water and Sewer Line and Related Structures Construction (10-19: 1, 1-4: 1)
People in group quarters in 2010:
418 people in college/university student housing
Home Mortgage Disclosure Act Aggregated Statistics For Year 2009 (Based on 2 partial tracts)
A) FHA, FSA/RHS & VA Home Purchase Loans
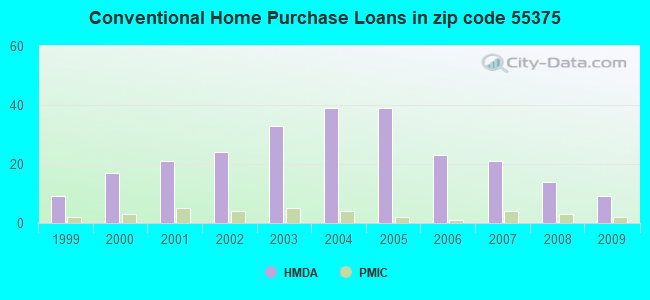
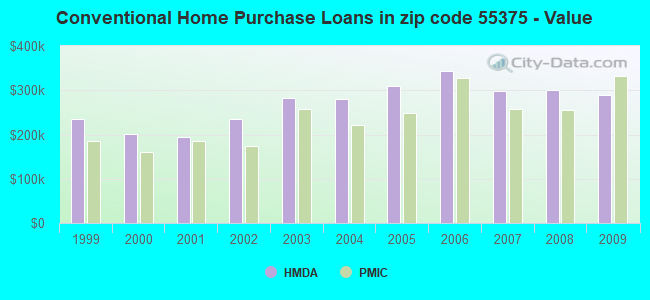
B) Conventional Home Purchase Loans
C) Refinancings
D) Home Improvement Loans
F) Non-occupant Loans on < 5 Family Dwellings (A B C & D)
Number
Average Value
Number
Average Value
Number
Average Value
Number
Average Value
Number
Average Value
LOANS ORIGINATED
6
$236,182
9
$290,304
45
$288,023
2
$228,160
2
$336,255
APPLICATIONS APPROVED, NOT ACCEPTED
0
$0
1
$171,010
6
$270,550
0
$0
0
$0
APPLICATIONS DENIED
1
$124,030
1
$366,590
13
$329,678
1
$103,420
1
$210,690
APPLICATIONS WITHDRAWN
1
$206,720
1
$217,220
10
$312,461
0
$0
1
$160,380
FILES CLOSED FOR INCOMPLETENESS
0
$0
0
$0
3
$379,180
0
$0
0
$0
Aggregated Statistics For Year 2008 (Based on 2 partial tracts)
A) FHA, FSA/RHS & VA Home Purchase Loans
B) Conventional Home Purchase Loans
C) Refinancings
D) Home Improvement Loans
F) Non-occupant Loans on < 5 Family Dwellings (A B C & D)
Number
Average Value
Number
Average Value
Number
Average Value
Number
Average Value
Number
Average Value
LOANS ORIGINATED
4
$244,928
14
$300,087
20
$330,758
2
$83,010
2
$281,410
APPLICATIONS APPROVED, NOT ACCEPTED
0
$0
2
$369,855
3
$227,157
0
$0
0
$0
APPLICATIONS DENIED
0
$0
1
$530,940
9
$296,362
1
$241,920
0
$0
APPLICATIONS WITHDRAWN
0
$0
1
$585,730
5
$349,030
0
$0
0
$0
FILES CLOSED FOR INCOMPLETENESS
0
$0
0
$0
1
$439,040
0
$0
0
$0
Aggregated Statistics For Year 2007 (Based on 2 partial tracts)
A) FHA, FSA/RHS & VA Home Purchase Loans
B) Conventional Home Purchase Loans
C) Refinancings
D) Home Improvement Loans
F) Non-occupant Loans on < 5 Family Dwellings (A B C & D)
Number
Average Value
Number
Average Value
Number
Average Value
Number
Average Value
Number
Average Value
LOANS ORIGINATED
1
$151,810
21
$298,758
23
$390,884
4
$109,505
2
$593,280
APPLICATIONS APPROVED, NOT ACCEPTED
0
$0
1
$417,020
5
$357,222
1
$28,930
0
$0
APPLICATIONS DENIED
0
$0
2
$507,970
11
$399,733
2
$72,770
1
$793,980
APPLICATIONS WITHDRAWN
0
$0
1
$538,620
5
$389,222
0
$0
1
$417,920
FILES CLOSED FOR INCOMPLETENESS
0
$0
1
$136,320
2
$709,505
0
$0
0
$0
Aggregated Statistics For Year 2006 (Based on 2 partial tracts)
A) FHA, FSA/RHS & VA Home Purchase Loans
B) Conventional Home Purchase Loans
C) Refinancings
D) Home Improvement Loans
F) Non-occupant Loans on < 5 Family Dwellings (A B C & D)
Number
Average Value
Number
Average Value
Number
Average Value
Number
Average Value
Number
Average Value
LOANS ORIGINATED
1
$142,340
23
$343,140
30
$305,903
4
$179,232
3
$302,933
APPLICATIONS APPROVED, NOT ACCEPTED
0
$0
2
$411,775
5
$250,292
1
$68,740
0
$0
APPLICATIONS DENIED
0
$0
5
$413,338
13
$317,686
1
$193,790
1
$722,820
APPLICATIONS WITHDRAWN
0
$0
2
$252,160
9
$348,530
1
$115,710
1
$333,700
FILES CLOSED FOR INCOMPLETENESS
0
$0
1
$317,310
2
$381,950
0
$0
0
$0
Aggregated Statistics For Year 2005 (Based on 2 partial tracts)
A) FHA, FSA/RHS & VA Home Purchase Loans
B) Conventional Home Purchase Loans
C) Refinancings
D) Home Improvement Loans
F) Non-occupant Loans on < 5 Family Dwellings (A B C & D)
Number
Average Value
Number
Average Value
Number
Average Value
Number
Average Value
Number
Average Value
LOANS ORIGINATED
1
$121,600
39
$309,537
35
$323,807
3
$250,240
6
$339,840
APPLICATIONS APPROVED, NOT ACCEPTED
0
$0
4
$400,575
4
$364,545
1
$88,580
1
$184,450
APPLICATIONS DENIED
0
$0
7
$293,614
12
$391,776
2
$175,550
2
$175,105
APPLICATIONS WITHDRAWN
0
$0
5
$321,152
11
$361,414
1
$43,260
1
$122,620
FILES CLOSED FOR INCOMPLETENESS
0
$0
2
$175,040
6
$293,248
0
$0
0
$0
Aggregated Statistics For Year 2004 (Based on 2 partial tracts)
A) FHA, FSA/RHS & VA Home Purchase Loans
B) Conventional Home Purchase Loans
C) Refinancings
D) Home Improvement Loans
F) Non-occupant Loans on < 5 Family Dwellings (A B C & D)
Number
Average Value
Number
Average Value
Number
Average Value
Number
Average Value
Number
Average Value
LOANS ORIGINATED
2
$132,350
39
$279,572
41
$282,780
3
$97,833
4
$289,760
APPLICATIONS APPROVED, NOT ACCEPTED
0
$0
2
$353,535
4
$243,808
0
$0
1
$185,980
APPLICATIONS DENIED
0
$0
4
$248,288
11
$367,314
1
$156,420
1
$285,820
APPLICATIONS WITHDRAWN
0
$0
2
$309,185
8
$316,944
1
$138,110
1
$451,200
FILES CLOSED FOR INCOMPLETENESS
0
$0
1
$83,970
5
$257,076
1
$70,530
0
$0
Aggregated Statistics For Year 2003 (Based on 2 partial tracts)
A) FHA, FSA/RHS & VA Home Purchase Loans
B) Conventional Home Purchase Loans
C) Refinancings
D) Home Improvement Loans
F) Non-occupant Loans on < 5 Family Dwellings (A B C & D)
Number
Average Value
Number
Average Value
Number
Average Value
Number
Average Value
Number
Average Value
LOANS ORIGINATED
2
$137,280
33
$281,790
103
$256,321
2
$42,690
2
$326,465
APPLICATIONS APPROVED, NOT ACCEPTED
0
$0
2
$247,870
9
$215,950
0
$0
0
$0
APPLICATIONS DENIED
0
$0
3
$209,707
18
$260,914
2
$38,785
1
$113,660
APPLICATIONS WITHDRAWN
0
$0
4
$191,425
12
$231,531
0
$0
0
$0
FILES CLOSED FOR INCOMPLETENESS
0
$0
1
$113,020
3
$293,760
0
$0
0
$0
Aggregated Statistics For Year 2002 (Based on 2 partial tracts)
A) FHA, FSA/RHS & VA Home Purchase Loans
B) Conventional Home Purchase Loans
C) Refinancings
D) Home Improvement Loans
F) Non-occupant Loans on < 5 Family Dwellings (A B C & D)
Number
Average Value
Number
Average Value
Number
Average Value
Number
Average Value
Number
Average Value
LOANS ORIGINATED
3
$147,457
24
$234,709
76
$239,943
4
$89,952
3
$288,727
APPLICATIONS APPROVED, NOT ACCEPTED
0
$0
2
$277,375
7
$206,793
1
$51,070
0
$0
APPLICATIONS DENIED
0
$0
2
$200,255
9
$207,218
0
$0
0
$0
APPLICATIONS WITHDRAWN
0
$0
3
$177,153
8
$186,352
0
$0
0
$0
FILES CLOSED FOR INCOMPLETENESS
0
$0
1
$114,940
4
$229,025
0
$0
0
$0
Aggregated Statistics For Year 2001 (Based on 2 partial tracts)
A) FHA, FSA/RHS & VA Home Purchase Loans
B) Conventional Home Purchase Loans
C) Refinancings
D) Home Improvement Loans
F) Non-occupant Loans on < 5 Family Dwellings (A B C & D)
Number
Average Value
Number
Average Value
Number
Average Value
Number
Average Value
Number
Average Value
LOANS ORIGINATED
4
$147,135
21
$194,578
51
$207,167
6
$57,707
1
$319,740
APPLICATIONS APPROVED, NOT ACCEPTED
0
$0
1
$136,700
4
$140,575
1
$70,400
0
$0
APPLICATIONS DENIED
0
$0
1
$255,870
10
$172,160
1
$37,250
0
$0
APPLICATIONS WITHDRAWN
0
$0
1
$296,450
8
$178,576
0
$0
1
$140,420
FILES CLOSED FOR INCOMPLETENESS
0
$0
0
$0
3
$233,513
0
$0
0
$0
Aggregated Statistics For Year 2000 (Based on 2 partial tracts)
A) FHA, FSA/RHS & VA Home Purchase Loans
B) Conventional Home Purchase Loans
C) Refinancings
D) Home Improvement Loans
F) Non-occupant Loans on < 5 Family Dwellings (A B C & D)
Number
Average Value
Number
Average Value
Number
Average Value
Number
Average Value
Number
Average Value
LOANS ORIGINATED
1
$78,720
17
$202,014
13
$151,592
6
$55,103
1
$103,680
APPLICATIONS APPROVED, NOT ACCEPTED
0
$0
1
$296,700
2
$86,655
1
$18,180
0
$0
APPLICATIONS DENIED
0
$0
2
$137,215
6
$138,133
2
$37,570
0
$0
APPLICATIONS WITHDRAWN
0
$0
1
$100,480
4
$97,728
1
$38,780
0
$0
FILES CLOSED FOR INCOMPLETENESS
0
$0
0
$0
2
$137,345
0
$0
0
$0
Aggregated Statistics For Year 1999 (Based on 1 partial tract)
Detailed PMIC statistics for the following Tracts:0277.00
2002 - 2018 National Fire Incident Reporting System (NFIRS) incidents
Based on the data from the years 2002 - 2018 the average number of fire incidents per year is 10. The highest number of fire incidents - 26 took place in 2008, and the least - 1 in 2002. The data has a rising trend.
When looking into fire subcategories, the most incidents belonged to: Structure Fires (49.4%), and Outside Fires (33.1%).
Fire incident types reported to NFIRS in Zip Code 55375


 Nearest zip codes: 55364, 55387, 55386, 55384, 55359, 55331.


 Based on the data from the years 2002 - 2018 the average number of fire incidents per year is 10. The highest number of fire incidents - 26 took place in 2008, and the least - 1 in 2002. The data has a rising trend.
 When looking into fire subcategories, the most incidents belonged to: Structure Fires (49.4%), and Outside Fires (33.1%).