Estimated zip code population in 2022: 901 Zip code population in 2010: 701 Zip code population in 2000: 768
Houses and condos: 429 Renter-occupied apartments: 22
% of renters here:
7%
State:
28%
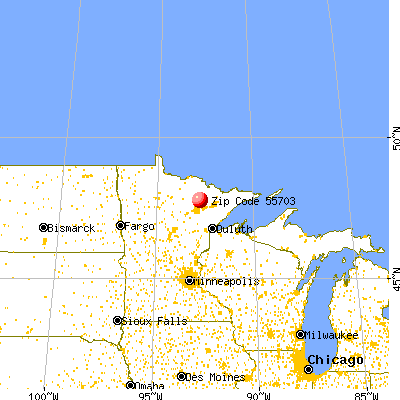
March 2022 cost of living index in zip code 55703: 87.7 (less than average, U.S. average is 100)
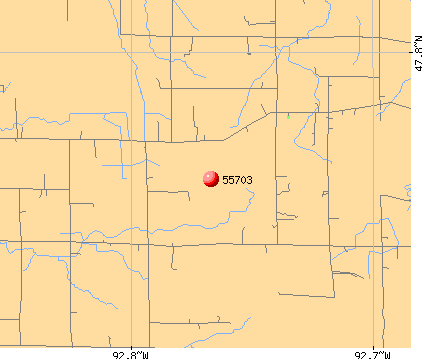
Land area: 138.9 sq. mi. Water area: 0.0 sq. mi.
Population density: 6 people per square mile
(very low).
OSM Map
General Map
Google Map
MSN Map
OSM Map
General Map
Google Map
MSN Map
OSM Map
General Map
Google Map
MSN Map
OSM Map
General Map
Google Map
MSN Map
Please wait while loading the map...
Real estate property taxes paid for housing units in 2022:
This zip code:
0.7% ($1,321)
Minnesota:
1.0% ($3,087)
Median real estate property taxes paid for housing units with mortgages in 2022: $1,591 (0.9%) Median real estate property taxes paid for housing units with no mortgage in 2022: $948 (0.7%)
Business Search- 14 Million verified businesses
Males: 454
(50.5%)
Females: 446
(49.5%)
For population 25 years and over in 55703:
High school or higher: 95.6%
Bachelor's degree or higher: 21.3%
Graduate or professional degree: 10.7%
Unemployed: 3.3%
Mean travel time to work (commute): 27.6 minutes
For population 15 years and over in 55703:
Never married: 19.5%
Now married: 54.6%
Separated: 2.3%
Widowed: 6.1%
Divorced: 17.4%
Zip code 55703 compared to state average:
Median house value below state average.
Black race population percentage significantly below state average.
Foreign-born population percentage significantly below state average.
Renting percentage significantly below state average.
Length of stay since moving in significantly below state average.
Number of college students significantly below state average.
Percentage of population with a bachelor's degree or higher below state average.
Estimated median house/condo value in 2022: $180,006
55703:
$180,006
Minnesota:
$314,600
According to our research of Minnesota and other state lists, there was 1 registered sex offender living in 55703 zip code as of May 28, 2024. The ratio of all residents to sex offenders in zip code 55703 is 720 to 1.
Median resident age:
This zip code:
41.3 years
Minnesota median age:
39.0 years
Average household size:
This zip code:
2.6 people
Minnesota:
2.4 people
Averages for the 2020 tax year for zip code 55703, filed in 2021:
Average Adjusted Gross Income (AGI) in 2020: $60,246 (Individual Income Tax Returns)
Here:
$60,246
State:
$82,178
Salary/wage: $55,826 (reported on 77.1% of returns)
Here:
$55,826
State:
$67,438
(% of AGI for various income ranges: 1144.0% for AGIs below $25k, 3198.6% for AGIs $25k-50k, 5905.0% for AGIs $50k-75k, 9646.7% for AGIs $75k-100k, 17515.0% for AGIs $100k-200k)
Taxable interest for individuals: $258 (reported on 34.3% of returns)
This zip code:
$258
Minnesota:
$1,814
(% of AGI for various income ranges: 2.0% for AGIs below $25k, 22.9% for AGIs $25k-50k, 30.0% for AGIs $75k-100k, 12.5% for AGIs $100k-200k)
Ordinary dividends: $920 (reported on 14.3% of returns)
Here:
$920
State:
$6,928
(% of AGI for various income ranges: 37.5% for AGIs $50k-75k, 77.5% for AGIs $100k-200k)
Net capital gain/loss in AGI: +$3,160 (reported on 14.3% of returns)
Here:
+$3,160
State:
+$20,591
(% of AGI for various income ranges: 95.7% for AGIs $25k-50k, 227.5% for AGIs $100k-200k)
Profit/loss from business: +$2,633 (reported on 8.6% of returns)
Here:
+$2,633
State:
+$14,342
(% of AGI for various income ranges: 112.9% for AGIs $25k-50k)
Taxable individual retirement arrangement distribution: $12,267 (reported on 8.6% of returns)
55703:
$12,267
Minnesota:
$20,675
(% of AGI for various income ranges: 736.0% for AGIs below $25k)
Earned income credit: $1,600 (reported on 8.6% of returns)
Here:
$1,600
State:
$2,055
(% of AGI for various income ranges: 96.0% for AGIs below $25k)
Percentage of individuals using paid preparers for their 2020 taxes: 94.3%
Here:
94%
State:
94%
(% for various income ranges: 88.9% for AGIs below $25k, 100.0% for AGIs $25k-50k, 83.3% for AGIs $50k-75k, 100.0% for AGIs $75k-100k, 100.0% for AGIs $100k-200k)
Averages for the 2012 tax year for zip code 55703, filed in 2013:
Average Adjusted Gross Income (AGI) in 2012: $49,764 (Individual Income Tax Returns)
Here:
$49,764
State:
$67,192
Salary/wage: $50,020 (reported on 75.8% of returns)
Here:
$50,020
State:
$55,182
(% of AGI for various income ranges: 62.5% for AGIs below $25k, 64.3% for AGIs $25k-50k, 77.4% for AGIs $50k-75k, 78.9% for AGIs $75k-100k, 83.1% for AGIs $100k-200k)
Taxable interest for individuals: $467 (reported on 45.5% of returns)
This zip code:
$467
Minnesota:
$1,664
(% of AGI for various income ranges: 1.0% for AGIs below $25k, 0.5% for AGIs $25k-50k, 0.2% for AGIs $50k-75k, 0.4% for AGIs $75k-100k, 0.4% for AGIs $100k-200k)
Ordinary dividends: $650 (reported on 12.1% of returns)
Here:
$650
State:
$5,665
Net capital gain/loss in AGI: +$4,367 (reported on 9.1% of returns)
Here:
+$4,367
State:
+$16,131
Profit/loss from business: +$2,700 (reported on 15.2% of returns)
Here:
+$2,700
State:
+$12,430
Taxable individual retirement arrangement distribution: $8,200 (reported on 9.1% of returns)
55703:
$8,200
Minnesota:
$15,212
Total itemized deductions: $14,818 (19% of AGI, reported on 33.3% of returns)
Here:
$14,818
State:
$24,665
Here:
18.6% of AGI
State:
19.6% of AGI
(% of AGI for various income ranges: 23.3% for AGIs below $25k, 9.5% for AGIs $50k-75k, 11.8% for AGIs $75k-100k, 10.4% for AGIs $100k-200k)
Charity contributions: $1,362 (reported on 24.2% of returns)
Here:
$1,362
State:
$3,948
Taxes paid: $5,809 (reported on 33.3% of returns)
55703:
$5,809
State:
$10,589
(% of AGI for various income ranges: 4.4% for AGIs below $25k, 2.6% for AGIs $50k-75k, 4.6% for AGIs $75k-100k, 6.2% for AGIs $100k-200k)
Earned income credit: $2,100 (reported on 12.1% of returns)
Here:
$2,100
State:
$2,037
(% of AGI for various income ranges: 6.2% for AGIs below $25k)
Percentage of individuals using paid preparers for their 2012 taxes: 57.6%
Here:
58%
State:
55%
(% for various income ranges: 54.5% for AGIs below $25k, 50.0% for AGIs $25k-50k, 66.7% for AGIs $50k-75k, 75.0% for AGIs $75k-100k, 50.0% for AGIs $100k-200k)
Averages for the 2004 tax year for zip code 55703, filed in 2005:
Average Adjusted Gross Income (AGI) in 2004: $36,853 (Individual Income Tax Returns)
Here:
$36,853
State:
$53,560
Salary/wage: $34,031 (reported on 83.0% of returns)
Here:
$34,031
State:
$46,177
(% of AGI for various income ranges: 121.7% for AGIs below $10k, 58.6% for AGIs $10k-25k, 77.4% for AGIs $25k-50k, 81.5% for AGIs $50k-75k, 87.7% for AGIs $75k-100k, 61.8% for AGIs over 100k)
Taxable interest for individuals: $583 (reported on 50.4% of returns)
This zip code:
$583
Minnesota:
$1,796
(% of AGI for various income ranges: 0.4% for AGIs below $10k, 1.8% for AGIs $10k-25k, 0.6% for AGIs $25k-50k, 1.1% for AGIs $50k-75k, 0.2% for AGIs $75k-100k, 0.3% for AGIs over 100k)
Taxable dividends: $489 (reported on 13.0% of returns)
Here:
$489
State:
$3,096
Profit/loss from business: +$2,000 (reported on 18.4% of returns)
Here:
+$2,000
State:
+$10,442
(% of AGI for various income ranges: 5.1% for AGIs below $10k, 6.4% for AGIs $10k-25k, 1.4% for AGIs $25k-50k, 0.5% for AGIs $50k-75k, -1.6% for AGIs $75k-100k)
Total itemized deductions: $13,493 (20% of AGI, reported on 20.5% of returns)
Here:
$13,493
State:
$20,035
Here:
20.1% of AGI
State:
21.3% of AGI
Charity contributions deductions: $1,056 (1% of AGI, reported on 15.6% of returns)
Here:
$1,056
State:
$3,333
Here:
1.5% of AGI
State:
3.4% of AGI
Total tax: $4,509 (reported on 76.9% of returns)
55703:
$4,509
State:
$8,485
(% of AGI for various income ranges: 3.2% for AGIs below $10k, 4.8% for AGIs $10k-25k, 6.8% for AGIs $25k-50k, 8.7% for AGIs $50k-75k, 10.4% for AGIs $75k-100k, 16.9% for AGIs over 100k)
Earned income credit: $1,350 (reported on 17.3% of returns)
Here:
$1,350
State:
$1,523
Percentage of individuals using paid preparers for their 2004 taxes: 60.2%
Here:
60%
State:
59%
(% for various income ranges: 49.4% for AGIs below $10k, 59.0% for AGIs $10k-25k, 65.4% for AGIs $25k-50k, 61.8% for AGIs $50k-75k, 65.2% for AGIs $75k-100k, 80.0% for AGIs over 100k)
Household received Food Stamps/SNAP in the past 12 months: 20 Household did not receive Food Stamps/SNAP in the past 12 months: 319
Women who had a birth in the past 12 months: 2 (2 now married, 0 unmarried) Women who did not have a birth in the past 12 months: 178 (97 now married, 81 unmarried)
Housing units in zip code 55703 with a mortgage: 193 (5 second mortgage, 1 both second mortgage and home equity loan) Houses without a mortgage: 5
Median monthly owner costs for units with a mortgage: $1,353 Median monthly owner costs for units without a mortgage: $481
Residents with income below the poverty level in 2022:
This zip code:
7.9%
Whole state:
9.6%
Residents with income below 50% of the poverty level in 2022:
This zip code:
3.4%
Whole state:
5.2%
Median number of rooms in houses and condos:
Here:
5.9
State:
7.1
Median number of rooms in apartments:
Here:
5.4
State:
3.8
Notable locations in this zip code not listed on our city pages
Rivers and creeks: Forsman Creek (A), Leander Creek (B), East Branch Sturgeon River (C), Paavola Creek (D), Murray Creek (E), Dark River (F), Johnson Creek (G), Gilmore Creek (H), Maki Creek (I). Display/hide their locations on the map
In group quarters: 5 (-1 institutionalized population)
Size of family households: 109 2-persons, 29 3-persons, 20 4-persons, 13 5-persons, 7 6-persons, 40 7-or-more-persons
Size of nonfamily households: 97 1-person, 18 2-persons, 1 6-persons
75 married couples with children.
96 single-parent households (22 men, 74 women).
99.2% of residents of 55703 zip code speak English at home.
0.1% of residents speak Spanish at home (100% well).
0.1% of residents speak other Indo-European language at home (100% very well).
0.1% of residents speak Asian or Pacific Island language at home (100% very well).
0.2% of residents speak other language at home (100% not well).
Foreign born population: 6 (0.7%) (84.1% of them are naturalized citizens)
This zip code:
0.7%
Whole state:
8.7%
17%Scotland
17%Malaysia
17%Singapore
30%Finnish
14%German
9%American
6%English
4%Irish
3%Norwegian
3%Swedish
Year of entry for the foreign-born population
12010 or later
02000 to 2009
01990 to 1999
4Before 1990
Facilities with environmental interests located in this zip code:
HANCOCK FABRICATION INC (9167 HWY 53 in ANGORA, MN)
STATE MASTER (Minnesota Pollution Control Agency permits and compilance tracking) - RCRAINFO-MND985684612, CESQG, RCRIS-MND985684612, Small Quantity Generators, between 100 kg and 1000 kg of hazardous waste/month (Resource Conservation and Recovery Act (tracking hazardous waste)) - notification Business SIC classification: INDUSTRIAL AND COMMERCIAL MACHINERY AND EQUIPMENT; WELDING REPAIR Business NAICS classification: OTHER COMMERCIAL AND SERVICE INDUSTRY MACHINERY MANUFACTURING.; COMMERCIAL AND INDUSTRIAL MACHINERY AND EQUIPMENT (EXCEPT AUTOMOTIVE AND ELECTRONIC) REPAIR AND MAINTENANCE. Organizations: HANCOCK JOHN G (CONTACT/OWNER)
Housing units lacking complete plumbing facilities: 10.8% Housing units lacking complete kitchen facilities: 4.6%
39.6%Bottled, tank, or LP gas
32.9%Wood
14.3%Fuel oil, kerosene, etc.
10.7%Electricity
2.7%Utility gas
Population in 1990: 291. Population change in the 1990s: +477 (+163.9%).
Place of birth for U.S.-born residents:
This state: 764
Northeast: 9
Midwest: 66
South: 25
West: 27
74% of the 55703 zip code residents lived in the same house 5 years ago. Out of people who lived in different houses, 78% lived in this county. Out of people who lived in different counties, 50% lived in Minnesota.
95% of the 55703 zip code residents lived in the same house 1 year ago. Out of people who lived in different houses, 50% moved from this county. Out of people who lived in different houses, 21% moved from different county within same state. Out of people who lived in different houses, 29% moved from different state. Out of people who lived in different houses, 4% moved from abroad.
Private vs. public school enrollment:
Students in private schools in grades 1 to 8 (elementary and middle school): 9
Here:
4.6%
Minnesota:
12.9%
Students in private schools in grades 9 to 12 (high school): 1
Here:
2.3%
Minnesota:
8.6%
Students in private undergraduate colleges:
Here:
0.0%
Minnesota:
26.2%
Occupation by median earnings in the past 12 months ($)
105,901Installation, maintenance, and repair occupations
72,491Management occupations
71,099Health diagnosing and treating practitioners and other technical occupations
70,898Life, physical, and social science occupations
69,599Construction and extraction occupations
60,362Production occupations
Top industries in this zip code by the number of employees in 2005:
Construction: Highway, Street, and Bridge Construction (20-49 employees: 1 establishment)
Construction: Site Preparation Contractors (1-4: 2)
Professional, Scientific, and Technical Services: Other Services Related to Advertising (1-4: 1)
Arts, Entertainment, and Recreation: Golf Courses and Country Clubs (1-4: 1)
Accommodation and Food Services: Full-Service Restaurants (1-4: 1)
Professional, Scientific, and Technical Services: Environmental Consulting Services (1-4: 1)
People in group quarters in 2010:
4 people in group homes intended for adults
Fatal accident statistics in 2013:
Fatal accident count: 1
Vehicles involved in fatal accidents: 2
Fatal accidents caused by drunken drivers: 0
Fatalities: 1
Persons involved in fatal accidents: 2
Pedestrians involved in fatal accidents: 0
Home Mortgage Disclosure Act Aggregated Statistics For Year 2009 (Based on 2 partial tracts)
A) FHA, FSA/RHS & VA Home Purchase Loans
B) Conventional Home Purchase Loans
C) Refinancings
D) Home Improvement Loans
F) Non-occupant Loans on < 5 Family Dwellings (A B C & D)
G) Loans On Manufactured Home Dwelling (A B C & D)
Number
Average Value
Number
Average Value
Number
Average Value
Number
Average Value
Number
Average Value
Number
Average Value
LOANS ORIGINATED
1
$113,590
7
$137,139
58
$152,773
7
$93,627
17
$129,730
2
$76,395
APPLICATIONS APPROVED, NOT ACCEPTED
0
$0
0
$0
8
$129,734
1
$35,180
1
$142,240
0
$0
APPLICATIONS DENIED
0
$0
2
$97,255
28
$173,038
1
$35,180
5
$172,090
1
$44,230
APPLICATIONS WITHDRAWN
1
$71,370
0
$0
6
$218,463
1
$175,910
0
$0
0
$0
FILES CLOSED FOR INCOMPLETENESS
0
$0
1
$136,710
4
$119,115
1
$27,640
0
$0
1
$22,620
Aggregated Statistics For Year 2008 (Based on 2 partial tracts)
A) FHA, FSA/RHS & VA Home Purchase Loans
B) Conventional Home Purchase Loans
C) Refinancings
D) Home Improvement Loans
F) Non-occupant Loans on < 5 Family Dwellings (A B C & D)
G) Loans On Manufactured Home Dwelling (A B C & D)
Number
Average Value
Number
Average Value
Number
Average Value
Number
Average Value
Number
Average Value
Number
Average Value
LOANS ORIGINATED
4
$107,682
11
$142,921
27
$130,416
7
$56,507
7
$139,220
2
$69,105
APPLICATIONS APPROVED, NOT ACCEPTED
0
$0
3
$120,290
4
$107,682
1
$25,130
1
$62,820
0
$0
APPLICATIONS DENIED
1
$29,150
5
$108,662
14
$124,573
8
$59,432
5
$109,668
0
$0
APPLICATIONS WITHDRAWN
1
$47,750
2
$91,975
4
$225,415
2
$45,235
2
$143,995
0
$0
FILES CLOSED FOR INCOMPLETENESS
1
$43,220
1
$159,830
2
$350,060
2
$59,560
2
$304,825
0
$0
Aggregated Statistics For Year 2007 (Based on 2 partial tracts)
A) FHA, FSA/RHS & VA Home Purchase Loans
B) Conventional Home Purchase Loans
C) Refinancings
D) Home Improvement Loans
F) Non-occupant Loans on < 5 Family Dwellings (A B C & D)
G) Loans On Manufactured Home Dwelling (A B C & D)
Number
Average Value
Number
Average Value
Number
Average Value
Number
Average Value
Number
Average Value
Number
Average Value
LOANS ORIGINATED
1
$107,560
14
$144,929
43
$140,611
10
$74,083
11
$149,272
4
$70,615
APPLICATIONS APPROVED, NOT ACCEPTED
0
$0
2
$145,250
6
$173,648
2
$90,970
1
$60,810
2
$77,650
APPLICATIONS DENIED
0
$0
3
$93,820
19
$123,851
5
$72,978
2
$81,420
1
$142,740
APPLICATIONS WITHDRAWN
0
$0
1
$60,810
8
$135,074
1
$52,770
1
$60,810
1
$81,920
FILES CLOSED FOR INCOMPLETENESS
0
$0
1
$274,420
3
$105,210
0
$0
2
$174,905
0
$0
Aggregated Statistics For Year 2006 (Based on 2 partial tracts)
A) FHA, FSA/RHS & VA Home Purchase Loans
B) Conventional Home Purchase Loans
C) Refinancings
D) Home Improvement Loans
F) Non-occupant Loans on < 5 Family Dwellings (A B C & D)
G) Loans On Manufactured Home Dwelling (A B C & D)
Number
Average Value
Number
Average Value
Number
Average Value
Number
Average Value
Number
Average Value
Number
Average Value
LOANS ORIGINATED
1
$59,810
16
$109,378
34
$131,341
18
$54,979
6
$105,713
3
$82,760
APPLICATIONS APPROVED, NOT ACCEPTED
0
$0
3
$136,203
7
$113,947
1
$28,150
1
$152,790
1
$43,220
APPLICATIONS DENIED
0
$0
3
$78,407
18
$144,833
4
$163,345
1
$153,290
1
$20,100
APPLICATIONS WITHDRAWN
0
$0
3
$120,623
13
$127,196
1
$25,130
2
$70,615
0
$0
FILES CLOSED FOR INCOMPLETENESS
0
$0
0
$0
5
$154,800
0
$0
0
$0
0
$0
Aggregated Statistics For Year 2005 (Based on 2 partial tracts)
A) FHA, FSA/RHS & VA Home Purchase Loans
B) Conventional Home Purchase Loans
C) Refinancings
D) Home Improvement Loans
F) Non-occupant Loans on < 5 Family Dwellings (A B C & D)
G) Loans On Manufactured Home Dwelling (A B C & D)
Number
Average Value
Number
Average Value
Number
Average Value
Number
Average Value
Number
Average Value
Number
Average Value
LOANS ORIGINATED
1
$62,820
18
$135,786
47
$125,040
13
$49,758
16
$120,152
4
$61,945
APPLICATIONS APPROVED, NOT ACCEPTED
0
$0
3
$133,357
9
$110,404
1
$61,320
3
$146,760
1
$62,820
APPLICATIONS DENIED
1
$64,330
6
$95,745
28
$139,202
5
$51,366
6
$168,455
3
$51,433
APPLICATIONS WITHDRAWN
0
$0
5
$117,206
22
$121,972
3
$105,880
4
$114,215
1
$95,490
FILES CLOSED FOR INCOMPLETENESS
0
$0
0
$0
8
$130,425
0
$0
0
$0
0
$0
Aggregated Statistics For Year 2004 (Based on 2 partial tracts)
B) Conventional Home Purchase Loans
C) Refinancings
D) Home Improvement Loans
F) Non-occupant Loans on < 5 Family Dwellings (A B C & D)
G) Loans On Manufactured Home Dwelling (A B C & D)
Number
Average Value
Number
Average Value
Number
Average Value
Number
Average Value
Number
Average Value
LOANS ORIGINATED
18
$116,687
53
$96,461
15
$40,845
12
$102,656
3
$49,757
APPLICATIONS APPROVED, NOT ACCEPTED
1
$31,660
8
$118,049
2
$122,635
1
$103,030
0
$0
APPLICATIONS DENIED
1
$96,500
18
$102,391
5
$53,778
3
$45,903
1
$87,950
APPLICATIONS WITHDRAWN
2
$108,060
13
$81,073
1
$26,140
0
$0
1
$59,810
FILES CLOSED FOR INCOMPLETENESS
1
$89,460
5
$88,860
0
$0
0
$0
0
$0
Aggregated Statistics For Year 2003 (Based on 2 partial tracts)
A) FHA, FSA/RHS & VA Home Purchase Loans
B) Conventional Home Purchase Loans
C) Refinancings
D) Home Improvement Loans
F) Non-occupant Loans on < 5 Family Dwellings (A B C & D)


 Nearest zip codes: 55710, 55723, 55719, 55758, 55713, 55768.