Estimated zip code population in 2022: 1,032 Zip code population in 2010: 1,045 Zip code population in 2000: 882
Houses and condos: 659 Renter-occupied apartments: 90
% of renters here:
23%
State:
28%
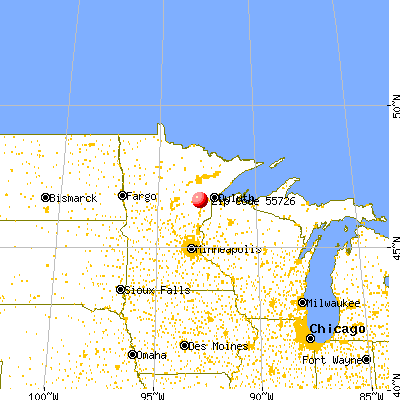
March 2022 cost of living index in zip code 55726: 87.1 (less than average, U.S. average is 100)
Land area: 92.7 sq. mi. Water area: 1.4 sq. mi.
Population density: 11 people per square mile
(very low).
OSM Map
General Map
Google Map
MSN Map
OSM Map
General Map
Google Map
MSN Map
OSM Map
General Map
Google Map
MSN Map
OSM Map
General Map
Google Map
MSN Map
Please wait while loading the map...
Real estate property taxes paid for housing units in 2022:
This zip code:
1.1% ($2,404)
Minnesota:
1.0% ($3,087)
Median real estate property taxes paid for housing units with mortgages in 2022: $2,376 (1.1%) Median real estate property taxes paid for housing units with no mortgage in 2022: $2,428 (1.0%)
Business Search- 14 Million verified businesses
Males: 492
(47.6%)
Females: 540
(52.4%)
For population 25 years and over in 55726:
High school or higher: 92.8%
Bachelor's degree or higher: 20.2%
Graduate or professional degree: 6.2%
Unemployed: 1.0%
Mean travel time to work (commute): 35.3 minutes
For population 15 years and over in 55726:
Never married: 26.6%
Now married: 57.9%
Separated: 0.1%
Widowed: 6.9%
Divorced: 8.4%
Zip code 55726 compared to state average:
Unemployed percentage significantly below state average.
Black race population percentage significantly below state average.
Hispanic race population percentage significantly below state average.
Foreign-born population percentage significantly below state average.
Number of college students below state average.
Percentage of population with a bachelor's degree or higher below state average.
Estimated median house/condo value in 2022: $221,580
55726:
$221,580
Minnesota:
$314,600
Median resident age:
This zip code:
42.4 years
Minnesota median age:
39.0 years
Average household size:
This zip code:
2.6 people
Minnesota:
2.4 people
Averages for the 2020 tax year for zip code 55726, filed in 2021:
Average Adjusted Gross Income (AGI) in 2020: $62,974 (Individual Income Tax Returns)
Here:
$62,974
State:
$82,178
Salary/wage: $55,688 (reported on 79.1% of returns)
Here:
$55,688
State:
$67,438
(% of AGI for various income ranges: 1347.5% for AGIs below $25k, 2921.4% for AGIs $25k-50k, 7186.7% for AGIs $50k-75k, 9100.0% for AGIs $75k-100k, 20030.0% for AGIs $100k-200k)
Taxable interest for individuals: $553 (reported on 39.5% of returns)
This zip code:
$553
Minnesota:
$1,814
(% of AGI for various income ranges: 11.2% for AGIs below $25k, 21.4% for AGIs $25k-50k, 170.0% for AGIs $50k-75k, 12.5% for AGIs $75k-100k, 28.0% for AGIs $100k-200k)
Ordinary dividends: $1,429 (reported on 16.3% of returns)
Here:
$1,429
State:
$6,928
(% of AGI for various income ranges: 16.2% for AGIs below $25k, 123.3% for AGIs $50k-75k, 100.0% for AGIs $100k-200k)
Net capital gain/loss in AGI: +$2,657 (reported on 16.3% of returns)
Here:
+$2,657
State:
+$20,591
(% of AGI for various income ranges: 172.9% for AGIs $25k-50k, 162.5% for AGIs $75k-100k)
Profit/loss from business: +$9,000 (reported on 11.6% of returns)
Here:
+$9,000
State:
+$14,342
(% of AGI for various income ranges: 195.7% for AGIs $25k-50k, 782.5% for AGIs $75k-100k)
Taxable individual retirement arrangement distribution: $16,267 (reported on 14.0% of returns)
55726:
$16,267
Minnesota:
$20,675
(% of AGI for various income ranges: 704.3% for AGIs $25k-50k, 1207.5% for AGIs $75k-100k)
Earned income credit: $1,800 (reported on 9.3% of returns)
Here:
$1,800
State:
$2,055
(% of AGI for various income ranges: 90.0% for AGIs below $25k)
Percentage of individuals using paid preparers for their 2020 taxes: 93.0%
Here:
93%
State:
94%
(% for various income ranges: 91.7% for AGIs below $25k, 90.0% for AGIs $25k-50k, 100.0% for AGIs $50k-75k, 100.0% for AGIs $75k-100k, 88.9% for AGIs $100k-200k)
Averages for the 2012 tax year for zip code 55726, filed in 2013:
Average Adjusted Gross Income (AGI) in 2012: $46,372 (Individual Income Tax Returns)
Here:
$46,372
State:
$67,192
Salary/wage: $43,529 (reported on 77.5% of returns)
Here:
$43,529
State:
$55,182
(% of AGI for various income ranges: 72.5% for AGIs below $25k, 67.0% for AGIs $25k-50k, 72.0% for AGIs $50k-75k, 82.1% for AGIs $75k-100k, 71.6% for AGIs $100k-200k)
Taxable interest for individuals: $331 (reported on 40.0% of returns)
This zip code:
$331
Minnesota:
$1,664
(% of AGI for various income ranges: 0.6% for AGIs below $25k, 0.7% for AGIs $25k-50k, 0.2% for AGIs $50k-75k, 0.1% for AGIs $75k-100k)
Ordinary dividends: $633 (reported on 15.0% of returns)
Here:
$633
State:
$5,665
Net capital gain/loss in AGI: +$317 (reported on 15.0% of returns)
Here:
+$317
State:
+$16,131
Profit/loss from business: +$10,880 (reported on 12.5% of returns)
Here:
+$10,880
State:
+$12,430
Taxable individual retirement arrangement distribution: $4,700 (reported on 10.0% of returns)
55726:
$4,700
Minnesota:
$15,212
Total itemized deductions: $21,662 (26% of AGI, reported on 32.5% of returns)
Here:
$21,662
State:
$24,665
Here:
25.8% of AGI
State:
19.6% of AGI
(% of AGI for various income ranges: 14.9% for AGIs $25k-50k, 16.3% for AGIs $50k-75k, 18.1% for AGIs $75k-100k, 17.6% for AGIs $100k-200k)
Charity contributions: $1,511 (reported on 22.5% of returns)
Here:
$1,511
State:
$3,948
(% of AGI for various income ranges: 1.4% for AGIs $50k-75k, 0.8% for AGIs $75k-100k, 1.1% for AGIs $100k-200k)
Taxes paid: $6,938 (reported on 32.5% of returns)
55726:
$6,938
State:
$10,589
(% of AGI for various income ranges: 2.7% for AGIs $25k-50k, 4.6% for AGIs $50k-75k, 7.2% for AGIs $75k-100k, 6.9% for AGIs $100k-200k)
Earned income credit: $2,400 (reported on 12.5% of returns)
Here:
$2,400
State:
$2,037
(% of AGI for various income ranges: 7.1% for AGIs below $25k)
Percentage of individuals using paid preparers for their 2012 taxes: 67.5%
Here:
68%
State:
55%
(% for various income ranges: 64.3% for AGIs below $25k, 66.7% for AGIs $25k-50k, 66.7% for AGIs $50k-75k, 75.0% for AGIs $75k-100k, 75.0% for AGIs $100k-200k)
Averages for the 2004 tax year for zip code 55726, filed in 2005:
Average Adjusted Gross Income (AGI) in 2004: $36,187 (Individual Income Tax Returns)
Here:
$36,187
State:
$53,560
Salary/wage: $32,949 (reported on 82.3% of returns)
Here:
$32,949
State:
$46,177
(% of AGI for various income ranges: 92.9% for AGIs below $10k, 68.1% for AGIs $10k-25k, 74.9% for AGIs $25k-50k, 81.1% for AGIs $50k-75k, 66.5% for AGIs $75k-100k, 75.5% for AGIs over 100k)
Taxable interest for individuals: $611 (reported on 56.2% of returns)
This zip code:
$611
Minnesota:
$1,796
(% of AGI for various income ranges: 1.1% for AGIs below $10k, 2.8% for AGIs $10k-25k, 1.2% for AGIs $25k-50k, 0.3% for AGIs $50k-75k, 0.4% for AGIs $75k-100k, 0.5% for AGIs over 100k)
Taxable dividends: $528 (reported on 17.9% of returns)
Here:
$528
State:
$3,096
(% of AGI for various income ranges: 1.0% for AGIs $10k-25k, 0.2% for AGIs $25k-50k, 0.2% for AGIs $50k-75k, 0.3% for AGIs $75k-100k)
Net capital gain/loss: +$1,481 (reported on 12.9% of returns)
Here:
+$1,481
State:
+$10,864
(% of AGI for various income ranges: -0.1% for AGIs $10k-25k, -0.3% for AGIs $50k-75k, 4.1% for AGIs $75k-100k)
Profit/loss from business: +$7,974 (reported on 18.9% of returns)
Here:
+$7,974
State:
+$10,442
(% of AGI for various income ranges: 11.1% for AGIs below $10k, 7.9% for AGIs $10k-25k, 4.5% for AGIs $25k-50k, 6.1% for AGIs $50k-75k)
Total itemized deductions: $15,500 (26% of AGI, reported on 33.8% of returns)
Here:
$15,500
State:
$20,035
Here:
26.0% of AGI
State:
21.3% of AGI
(% of AGI for various income ranges: 10.7% for AGIs $10k-25k, 13.3% for AGIs $25k-50k, 15.9% for AGIs $50k-75k, 17.1% for AGIs $75k-100k, 17.1% for AGIs over 100k)
Charity contributions deductions: $1,193 (2% of AGI, reported on 28.4% of returns)
Here:
$1,193
State:
$3,333
Here:
2.0% of AGI
State:
3.4% of AGI
(% of AGI for various income ranges: 0.9% for AGIs $10k-25k, 1.1% for AGIs $25k-50k, 0.9% for AGIs $50k-75k, 0.8% for AGIs $75k-100k, 0.9% for AGIs over 100k)
Total tax: $3,732 (reported on 77.1% of returns)
55726:
$3,732
State:
$8,485
(% of AGI for various income ranges: 3.4% for AGIs below $10k, 4.0% for AGIs $10k-25k, 6.5% for AGIs $25k-50k, 8.0% for AGIs $50k-75k, 9.6% for AGIs $75k-100k, 13.0% for AGIs over 100k)
Earned income credit: $1,736 (reported on 13.2% of returns)
Here:
$1,736
State:
$1,523
Percentage of individuals using paid preparers for their 2004 taxes: 63.2%
Here:
63%
State:
59%
(% for various income ranges: 48.7% for AGIs below $10k, 58.5% for AGIs $10k-25k, 70.4% for AGIs $25k-50k, 72.7% for AGIs $50k-75k, 74.1% for AGIs $75k-100k, 58.8% for AGIs over 100k)
Likely homosexual households (counted as self-reported same-sex unmarried-partner households)
Lesbian couples: 0.0% of all households
Gay men: 0.8% of all households
Household received Food Stamps/SNAP in the past 12 months: 20 Household did not receive Food Stamps/SNAP in the past 12 months: 368
Women who had a birth in the past 12 months: 1 (1 now married, 0 unmarried) Women who did not have a birth in the past 12 months: 208 (109 now married, 99 unmarried)
Housing units in zip code 55726 with a mortgage: 188 (9 second mortgage, 4 both second mortgage and home equity loan) Houses without a mortgage: 17
Median monthly owner costs for units with a mortgage: $1,588 Median monthly owner costs for units without a mortgage: $593
Residents with income below the poverty level in 2022:
This zip code:
8.6%
Whole state:
9.6%
Residents with income below 50% of the poverty level in 2022:
This zip code:
3.2%
Whole state:
5.2%
Median number of rooms in houses and condos:
Here:
6.2
State:
7.1
Median number of rooms in apartments:
Here:
3.2
State:
3.8
Notable locations in this zip code not listed on our city pages
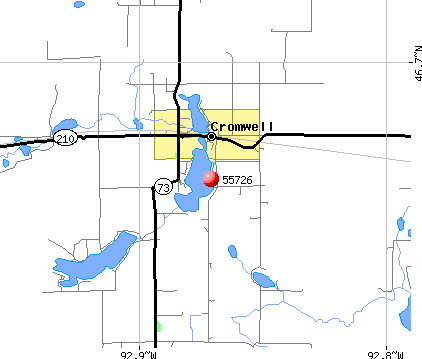
Notable locations in zip code 55726: Cromwell (A), Island Lake Campgrounds (B), Corona (C), Camp Lawrie (D), Cromwell Fire and Ambulance (E). Display/hide their locations on the map
Lakes: Rogers Lake (A), Spruce Lake (B), Springer Lake (C), Merwin Lake (D), Little Kettle Lake (E), Island Lake (F), Eagle Lake (G), Black Lake (H). Display/hide their locations on the map
Parks in zip code 55726 include: Mervin State Wildlife Management Area (1), Island Lake Park (2), Sawyer State Wildlife Management Area (3). Display/hide their locations on the map
In group quarters: 38 (-1 institutionalized population)
Size of family households: 127 2-persons, 56 3-persons, 30 4-persons, 44 5-persons, 6 6-persons, 1 7-or-more-persons
Size of nonfamily households: 104 1-person, 17 2-persons
239 married couples with children.
25 single-parent households (25 women).
99.3% of residents of 55726 zip code speak English at home.
0.2% of residents speak Spanish at home (100% well).
0.4% of residents speak other language at home (100% very well).
Foreign born population: 2 (0.2%) (100.0% of them are naturalized citizens)
This zip code:
0.2%
Whole state:
8.7%
50%Germany
31%Finnish
15%German
15%American
11%Swedish
4%Scandinavian
3%French Canadian
3%English
Year of entry for the foreign-born population
02010 or later
02000 to 2009
01990 to 1999
9Before 1990
Facilities with environmental interests located in this zip code:
GEM AUTOMOTIVE (1311 KALLI RD in CROMWELL, MN)
STATE MASTER (Minnesota Pollution Control Agency permits and compilance tracking) - RCRIS-MNR000119693, CESQG Conditionally Exempt Small Quantity Generators, less than 100 kg/month of hazardous waste (Resource Conservation and Recovery Act (tracking hazardous waste)) Business SIC classification: GENERAL AUTOMOTIVE REPAIR SHOPS Business NAICS classification: GENERAL AUTOMOTIVE REPAIR. Organizations: GARY HAKAMAKI JR (CONTACT/OPERATOR)
AMERICAN FURNITURE CRAFTSMEN (HIGHWAY 73 N in CROMWELL, MN)
AIR MINOR (AIRS/AFS) Business SIC classification: WOOD HOUSEHOLD FURNITURE, UPHOLSTERED
PEATREX MINING AREA (SEC 14,23,24 T49N, R20W in CROMWELL, MN)
National Pollutant Discharge Elimination System NON-MAJOR (Tracking pollutant discharge elimination systems) - permit Business SIC classification: MISCELLANEOUS NONMETALLIC MINERALS, EXCEPT FUELS Alternative names: PEATREX LIMITED
Housing units lacking complete plumbing facilities: 10.6% Housing units lacking complete kitchen facilities: 6.8%
53.6%Bottled, tank, or LP gas
26.9%Electricity
14.4%Wood
2.7%No fuel used
2.1%Fuel oil, kerosene, etc.
1.1%Other fuel
Population in 1990: 1,048.
Place of birth for U.S.-born residents:
This state: 955
Northeast: 2
Midwest: 44
South: 8
West: 9
64% of the 55726 zip code residents lived in the same house 5 years ago. Out of people who lived in different houses, 42% lived in this county. Out of people who lived in different counties, 50% lived in Minnesota.
92% of the 55726 zip code residents lived in the same house 1 year ago. Out of people who lived in different houses, 36% moved from this county. Out of people who lived in different houses, 51% moved from different county within same state. Out of people who lived in different houses, 15% moved from different state.
Private vs. public school enrollment:
Students in private schools in grades 1 to 8 (elementary and middle school):
Here:
0.0%
Minnesota:
12.9%
Students in private schools in grades 9 to 12 (high school):
Here:
0.0%
Minnesota:
8.6%
Students in private undergraduate colleges: 2
Here:
13.0%
Minnesota:
26.2%
Occupation by median earnings in the past 12 months ($)
78,293Construction and extraction occupations
76,408Installation, maintenance, and repair occupations
73,807Business and financial operations occupations
67,625Production occupations
64,357Education, training, and library occupations
63,890Management occupations
Companies with federal contracts located in this zip code:
GLASS MAN, THE (1272 HWY 73 in CROMWELL, MN; small business)
$8,320 with Army for Glass Fabricated Materials. Signed on 2004-09-13. Completion date: 2004-11-01.
Top industries in this zip code by the number of employees in 2005:
Health Care and Social Assistance: Nursing Care Facilities (50-99 employees: 1 establishment)
Accommodation and Food Services: Full-Service Restaurants (10-19: 1)
Construction: Drywall and Insulation Contractors (5-9: 1)
Finance and Insurance: Commercial Banking (5-9: 1)
Construction: New Single-Family Housing Construction (except Operative Builders) (5-9: 1)
Fatal accident statistics in 2013:
Fatal accident count: 1
Vehicles involved in fatal accidents: 1
Fatal accidents caused by drunken drivers: 1
Fatalities: 1
Persons involved in fatal accidents: 1
Pedestrians involved in fatal accidents: 0
Fatal accident statistics in 2012:
Fatal accident count: 1
Vehicles involved in fatal accidents: 3
Fatal accidents caused by drunken drivers: 0
Fatalities: 2
Persons involved in fatal accidents: 5
Pedestrians involved in fatal accidents: 0
Home Mortgage Disclosure Act Aggregated Statistics For Year 2009 (Based on 2 partial tracts)
A) FHA, FSA/RHS & VA Home Purchase Loans
B) Conventional Home Purchase Loans
C) Refinancings
D) Home Improvement Loans
F) Non-occupant Loans on < 5 Family Dwellings (A B C & D)
G) Loans On Manufactured Home Dwelling (A B C & D)
Number
Average Value
Number
Average Value
Number
Average Value
Number
Average Value
Number
Average Value
Number
Average Value
LOANS ORIGINATED
3
$148,470
8
$114,046
29
$151,447
2
$38,000
7
$120,004
3
$99,840
APPLICATIONS APPROVED, NOT ACCEPTED
0
$0
0
$0
1
$125,980
0
$0
0
$0
0
$0
APPLICATIONS DENIED
0
$0
0
$0
14
$153,968
2
$53,035
1
$40,230
2
$139,190
APPLICATIONS WITHDRAWN
0
$0
2
$138,990
13
$177,815
2
$139,395
1
$168,660
1
$49,580
FILES CLOSED FOR INCOMPLETENESS
0
$0
0
$0
2
$181,255
1
$10,160
0
$0
0
$0
Aggregated Statistics For Year 2008 (Based on 2 partial tracts)
A) FHA, FSA/RHS & VA Home Purchase Loans
B) Conventional Home Purchase Loans
C) Refinancings
D) Home Improvement Loans
F) Non-occupant Loans on < 5 Family Dwellings (A B C & D)
G) Loans On Manufactured Home Dwelling (A B C & D)
Number
Average Value
Number
Average Value
Number
Average Value
Number
Average Value
Number
Average Value
Number
Average Value
LOANS ORIGINATED
2
$112,575
7
$124,939
16
$131,801
3
$21,267
4
$95,300
2
$97,130
APPLICATIONS APPROVED, NOT ACCEPTED
0
$0
1
$67,060
4
$125,272
0
$0
1
$98,350
0
$0
APPLICATIONS DENIED
1
$89,810
1
$43,080
11
$136,255
3
$27,770
2
$137,365
0
$0
APPLICATIONS WITHDRAWN
0
$0
1
$89,410
6
$103,022
1
$97,940
1
$97,540
2
$68,070
FILES CLOSED FOR INCOMPLETENESS
0
$0
1
$125,980
0
$0
0
$0
0
$0
0
$0
Aggregated Statistics For Year 2007 (Based on 2 partial tracts)
A) FHA, FSA/RHS & VA Home Purchase Loans
B) Conventional Home Purchase Loans
C) Refinancings
D) Home Improvement Loans
F) Non-occupant Loans on < 5 Family Dwellings (A B C & D)
G) Loans On Manufactured Home Dwelling (A B C & D)
Number
Average Value
Number
Average Value
Number
Average Value
Number
Average Value
Number
Average Value
Number
Average Value
LOANS ORIGINATED
1
$172,720
16
$131,268
26
$143,553
6
$55,812
9
$107,696
4
$132,488
APPLICATIONS APPROVED, NOT ACCEPTED
0
$0
1
$73,150
5
$133,786
2
$66,855
1
$149,560
0
$0
APPLICATIONS DENIED
0
$0
7
$128,829
17
$126,438
2
$46,330
5
$95,910
2
$87,580
APPLICATIONS WITHDRAWN
0
$0
3
$140,480
6
$111,422
1
$52,430
1
$50,390
1
$75,180
FILES CLOSED FOR INCOMPLETENESS
0
$0
0
$0
2
$149,555
0
$0
0
$0
0
$0
Aggregated Statistics For Year 2006 (Based on 2 partial tracts)
A) FHA, FSA/RHS & VA Home Purchase Loans
B) Conventional Home Purchase Loans
C) Refinancings
D) Home Improvement Loans
F) Non-occupant Loans on < 5 Family Dwellings (A B C & D)
G) Loans On Manufactured Home Dwelling (A B C & D)
Number
Average Value
Number
Average Value
Number
Average Value
Number
Average Value
Number
Average Value
Number
Average Value
LOANS ORIGINATED
1
$102,410
17
$134,088
33
$135,381
6
$37,388
5
$137,526
4
$119,990
APPLICATIONS APPROVED, NOT ACCEPTED
0
$0
0
$0
4
$166,420
1
$17,880
0
$0
0
$0
APPLICATIONS DENIED
0
$0
4
$99,162
24
$147,947
5
$77,298
2
$116,840
2
$89,205
APPLICATIONS WITHDRAWN
0
$0
4
$100,380
15
$130,481
1
$147,120
2
$101,395
0
$0
FILES CLOSED FOR INCOMPLETENESS
0
$0
1
$75,180
4
$143,155
0
$0
0
$0
0
$0
Aggregated Statistics For Year 2005 (Based on 2 partial tracts)
A) FHA, FSA/RHS & VA Home Purchase Loans
B) Conventional Home Purchase Loans
C) Refinancings
D) Home Improvement Loans
F) Non-occupant Loans on < 5 Family Dwellings (A B C & D)
G) Loans On Manufactured Home Dwelling (A B C & D)
Number
Average Value
Number
Average Value
Number
Average Value
Number
Average Value
Number
Average Value
Number
Average Value
LOANS ORIGINATED
1
$168,250
16
$128,372
36
$128,231
4
$88,290
8
$159,665
3
$100,517
APPLICATIONS APPROVED, NOT ACCEPTED
0
$0
1
$96,720
7
$106,593
2
$107,495
0
$0
1
$60,960
APPLICATIONS DENIED
0
$0
11
$98,275
24
$116,162
4
$62,485
4
$151,992
3
$88,730
APPLICATIONS WITHDRAWN
0
$0
7
$103,284
19
$133,492
4
$121,615
2
$84,735
2
$72,540
FILES CLOSED FOR INCOMPLETENESS
0
$0
1
$48,360
2
$134,720
0
$0
0
$0
0
$0
Aggregated Statistics For Year 2004 (Based on 2 partial tracts)
B) Conventional Home Purchase Loans
C) Refinancings
D) Home Improvement Loans
F) Non-occupant Loans on < 5 Family Dwellings (A B C & D)
G) Loans On Manufactured Home Dwelling (A B C & D)
Detailed PMIC statistics for the following Tracts:9706.00
2002 - 2018 National Fire Incident Reporting System (NFIRS) incidents
According to the data from the years 2002 - 2018 the average number of fires per year is 8. The highest number of reported fire incidents - 26 took place in 2010, and the least - 3 in 2005. The data has a declining trend.
When looking into fire subcategories, the most reports belonged to: Outside Fires (41.1%), and Structure Fires (33.3%).
Fire incident types reported to NFIRS in Zip Code 55726


 Nearest zip codes: 55780, 55798, 55757, 55711, 55707, 55767.


 According to the data from the years 2002 - 2018 the average number of fires per year is 8. The highest number of reported fire incidents - 26 took place in 2010, and the least - 3 in 2005. The data has a declining trend.
 When looking into fire subcategories, the most reports belonged to: Outside Fires (41.1%), and Structure Fires (33.3%).