Estimated zip code population in 2022: 465 Zip code population in 2010: 554 Zip code population in 2000: 591
Houses and condos: 757 Renter-occupied apartments: 28
% of renters here:
12%
State:
28%
March 2022 cost of living index in zip code 55763: 84.3 (less than average, U.S. average is 100)
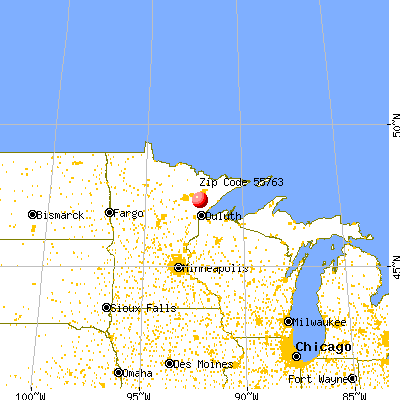
Land area: 175.1 sq. mi. Water area: 9.6 sq. mi.
Population density: 3 people per square mile
(very low).
OSM Map
General Map
Google Map
MSN Map
OSM Map
General Map
Google Map
MSN Map
OSM Map
General Map
Google Map
MSN Map
OSM Map
General Map
Google Map
MSN Map
Please wait while loading the map...
Real estate property taxes paid for housing units in 2022:
This zip code:
0.7% ($1,280)
Minnesota:
1.0% ($3,087)
Median real estate property taxes paid for housing units with mortgages in 2022: $1,216 (0.8%) Median real estate property taxes paid for housing units with no mortgage in 2022: $1,470 (0.8%)
Business Search- 14 Million verified businesses
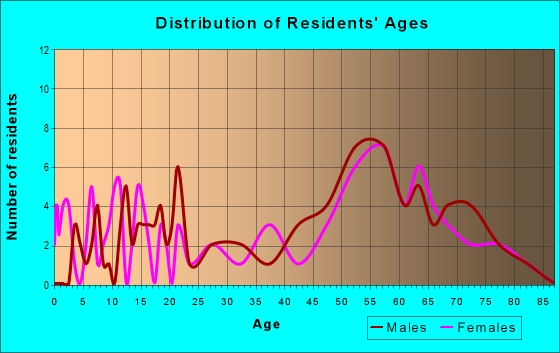
Males: 254
(54.5%)
Females: 211
(45.5%)
For population 25 years and over in 55763:
High school or higher: 96.0%
Bachelor's degree or higher: 27.6%
Graduate or professional degree: 11.1%
Unemployed: 3.8%
Mean travel time to work (commute): 32.7 minutes
For population 15 years and over in 55763:
Never married: 17.6%
Now married: 65.0%
Separated: 0.0%
Widowed: 4.7%
Divorced: 12.8%
Zip code 55763 compared to state average:
Median house value below state average.
Black race population percentage significantly below state average.
Hispanic race population percentage significantly below state average.
Median age significantly above state average.
Foreign-born population percentage significantly below state average.
Renting percentage significantly below state average.
Length of stay since moving in significantly above state average.
Number of rooms per house significantly below state average.
Estimated median house/condo value in 2022: $173,425
55763:
$173,425
Minnesota:
$314,600
Median resident age:
This zip code:
57.3 years
Minnesota median age:
39.0 years
Average household size:
This zip code:
2.0 people
Minnesota:
2.4 people
Averages for the 2020 tax year for zip code 55763, filed in 2021:
Average Adjusted Gross Income (AGI) in 2020: $67,156 (Individual Income Tax Returns)
Here:
$67,156
State:
$82,178
Salary/wage: $51,717 (reported on 66.7% of returns)
Here:
$51,717
State:
$67,438
(% of AGI for various income ranges: 1197.5% for AGIs below $25k, 1550.0% for AGIs $25k-50k, 7100.0% for AGIs $50k-75k, 7616.7% for AGIs $75k-100k, 14500.0% for AGIs $100k-200k)
Taxable interest for individuals: $370 (reported on 37.0% of returns)
This zip code:
$370
Minnesota:
$1,814
(% of AGI for various income ranges: 50.0% for AGIs $25k-50k, 20.0% for AGIs $50k-75k, 26.7% for AGIs $100k-200k)
Ordinary dividends: $1,217 (reported on 22.2% of returns)
Here:
$1,217
State:
$6,928
(% of AGI for various income ranges: 104.0% for AGIs $25k-50k, 70.0% for AGIs $75k-100k)
Net capital gain/loss in AGI: +$5,675 (reported on 14.8% of returns)
Here:
+$5,675
State:
+$20,591
(% of AGI for various income ranges: 130.0% for AGIs below $25k, 583.3% for AGIs $75k-100k)
Profit/loss from business: +$300 (reported on 7.4% of returns)
Here:
+$300
State:
+$14,342
(% of AGI for various income ranges: 30.0% for AGIs $50k-75k)
Taxable individual retirement arrangement distribution: $18,000 (reported on 22.2% of returns)
55763:
$18,000
Minnesota:
$20,675
(% of AGI for various income ranges: 480.0% for AGIs below $25k, 4440.0% for AGIs $50k-75k)
Percentage of individuals using paid preparers for their 2020 taxes: 88.9%
Here:
89%
State:
94%
(% for various income ranges: 83.3% for AGIs below $25k, 85.7% for AGIs $25k-50k, 100.0% for AGIs $50k-75k, 100.0% for AGIs $75k-100k, 83.3% for AGIs $100k-200k)
Averages for the 2012 tax year for zip code 55763, filed in 2013:
Average Adjusted Gross Income (AGI) in 2012: $50,600 (Individual Income Tax Returns)
Here:
$50,600
State:
$67,192
Salary/wage: $45,024 (reported on 75.0% of returns)
Here:
$45,024
State:
$55,182
(% of AGI for various income ranges: 65.3% for AGIs below $25k, 47.5% for AGIs $25k-50k, 73.9% for AGIs $50k-75k, 70.2% for AGIs $75k-100k, 70.6% for AGIs $100k-200k)
Taxable interest for individuals: $291 (reported on 39.3% of returns)
This zip code:
$291
Minnesota:
$1,664
(% of AGI for various income ranges: 0.4% for AGIs below $25k, 0.5% for AGIs $25k-50k, 0.4% for AGIs $50k-75k)
Ordinary dividends: $580 (reported on 17.9% of returns)
Here:
$580
State:
$5,665
Net capital gain/loss in AGI: +$75 (reported on 14.3% of returns)
Here:
+$75
State:
+$16,131
Profit/loss from business: +$3,150 (reported on 14.3% of returns)
Here:
+$3,150
State:
+$12,430
Taxable individual retirement arrangement distribution: $9,825 (reported on 14.3% of returns)
55763:
$9,825
Minnesota:
$15,212
Total itemized deductions: $18,188 (20% of AGI, reported on 28.6% of returns)
Here:
$18,188
State:
$24,665
Here:
20.1% of AGI
State:
19.6% of AGI
(% of AGI for various income ranges: 29.0% for AGIs $50k-75k, 11.7% for AGIs $100k-200k)
Charity contributions: $1,186 (reported on 25.0% of returns)
Here:
$1,186
State:
$3,948
(% of AGI for various income ranges: 1.5% for AGIs $50k-75k, 0.8% for AGIs $100k-200k)
Taxes paid: $7,100 (reported on 28.6% of returns)
55763:
$7,100
State:
$10,589
(% of AGI for various income ranges: 8.7% for AGIs $50k-75k, 6.3% for AGIs $100k-200k)
Earned income credit: $1,500 (reported on 14.3% of returns)
Here:
$1,500
State:
$2,037
(% of AGI for various income ranges: 5.6% for AGIs below $25k)
Percentage of individuals using paid preparers for their 2012 taxes: 57.1%
Here:
57%
State:
55%
(% for various income ranges: 44.4% for AGIs below $25k, 71.4% for AGIs $25k-50k, 60.0% for AGIs $50k-75k, 66.7% for AGIs $75k-100k, 50.0% for AGIs $100k-200k)
Averages for the 2004 tax year for zip code 55763, filed in 2005:
Average Adjusted Gross Income (AGI) in 2004: $34,909 (Individual Income Tax Returns)
Here:
$34,909
State:
$53,560
Salary/wage: $31,000 (reported on 83.6% of returns)
Here:
$31,000
State:
$46,177
(% of AGI for various income ranges: 130.1% for AGIs below $10k, 63.2% for AGIs $10k-25k, 62.5% for AGIs $25k-50k, 81.4% for AGIs $50k-75k, 77.9% for AGIs $75k-100k)
Taxable interest for individuals: $489 (reported on 51.5% of returns)
This zip code:
$489
Minnesota:
$1,796
(% of AGI for various income ranges: 2.0% for AGIs below $10k, 1.9% for AGIs $10k-25k, 1.1% for AGIs $25k-50k, 0.3% for AGIs $50k-75k, 0.1% for AGIs $75k-100k)
Taxable dividends: $750 (reported on 21.9% of returns)
Here:
$750
State:
$3,096
Profit/loss from business: +$679 (reported on 10.2% of returns)
Here:
+$679
State:
+$10,442
Total itemized deductions: $13,714 (25% of AGI, reported on 23.0% of returns)
Here:
$13,714
State:
$20,035
Here:
25.0% of AGI
State:
21.3% of AGI
Charity contributions deductions: $1,333 (2% of AGI, reported on 20.8% of returns)
Here:
$1,333
State:
$3,333
Here:
2.4% of AGI
State:
3.4% of AGI
Total tax: $3,607 (reported on 79.9% of returns)
55763:
$3,607
State:
$8,485
(% of AGI for various income ranges: 1.6% for AGIs below $10k, 4.3% for AGIs $10k-25k, 7.5% for AGIs $25k-50k, 7.9% for AGIs $50k-75k, 11.8% for AGIs $75k-100k)
Earned income credit: $1,216 (reported on 13.5% of returns)
Here:
$1,216
State:
$1,523
Percentage of individuals using paid preparers for their 2004 taxes: 64.6%
Here:
65%
State:
59%
(% for various income ranges: 50.8% for AGIs below $10k, 56.7% for AGIs $10k-25k, 71.8% for AGIs $25k-50k, 72.0% for AGIs $50k-75k, 77.8% for AGIs $75k-100k)
Household received Food Stamps/SNAP in the past 12 months: 12 Household did not receive Food Stamps/SNAP in the past 12 months: 223
Women who did not have a birth in the past 12 months: 64 (34 now married, 30 unmarried)
Housing units in zip code 55763 with a mortgage: 95 (2 second mortgage, 1 both second mortgage and home equity loan) Median monthly owner costs for units with a mortgage: $1,328 Median monthly owner costs for units without a mortgage: $543
Residents with income below the poverty level in 2022:
This zip code:
16.6%
Whole state:
9.6%
Residents with income below 50% of the poverty level in 2022:
This zip code:
14.5%
Whole state:
5.2%
Median number of rooms in houses and condos:
Here:
5.0
State:
7.1
Median number of rooms in apartments:
Here:
4.7
State:
3.8
Notable locations in this zip code not listed on our city pages
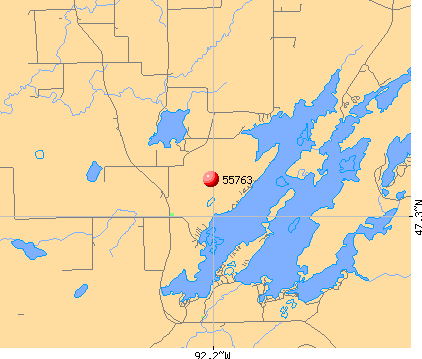
Notable locations in zip code 55763: Whiteface River Picnic Area (A), Whiteface Reservoir Campground (B), Fairbanks Station (C), Makinen Fire Department (D), Colvin Volunteer Fire Department (E). Display/hide their locations on the map
Lakes and reservoirs: Wiggle Lake (A), Cedar Lake (B), Coe Lake (C), Harris Lake (D), Hay Lake (E), Lanta Lake (F), Linwood Lake (G), Little Lake (H). Display/hide their locations on the map
Rivers and creeks: North Branch Whiteface River (A), Petrel Creek (B), Hornby Creek (C), Reno Creek (D), Jenkins Creek (E), Bum Creek (F), South Branch Water Hen Creek (G), South Branch Whiteface River (H), Shiver Creek (I). Display/hide their locations on the map
Size of family households: 124 2-persons, 7 3-persons, 18 4-persons, 3 5-persons, 2 6-persons
Size of nonfamily households: 57 1-person, 25 2-persons
48 married couples with children.
4 single-parent households (4 men).
97.4% of residents of 55763 zip code speak English at home.
0.9% of residents speak Spanish at home (100% very well).
1.5% of residents speak other Indo-European language at home (86% very well, 14% not well).
0.4% of residents speak other language at home (100% well).
Foreign born population: 3 (0.7%) (34.6% of them are naturalized citizens)
This zip code:
0.7%
Whole state:
8.7%
67%Kenya
33%Germany
23%German
18%American
18%Finnish
13%Scandinavian
12%Swedish
4%Irish
4%Polish
Year of entry for the foreign-born population
22010 or later
02000 to 2009
01990 to 1999
2Before 1990
Facilities with environmental interests located in this zip code:
CURTISS WHITEGOODS PROCESSING INC (6327 LONG LAKE RD in MAKINEN, MN)
Conditionally Exempt Small Quantity Generators, less than 100 kg/month of hazardous waste (Resource Conservation and Recovery Act (tracking hazardous waste)) - notification Organizations: ST LOUIS COUNTY (CONTACT/OWNER)
Housing units lacking complete plumbing facilities: 27.3% Housing units lacking complete kitchen facilities: 17.2%
41.6%Bottled, tank, or LP gas
21.5%Electricity
15.8%Fuel oil, kerosene, etc.
15.3%Wood
5.3%Utility gas
1.3%No fuel used
Population in 1990: 1,028.
Place of birth for U.S.-born residents:
This state: 323
Northeast: 8
Midwest: 69
South: 18
West: 40
67% of the 55763 zip code residents lived in the same house 5 years ago. Out of people who lived in different houses, 85% lived in this county. Out of people who lived in different counties, 50% lived in Minnesota.
96% of the 55763 zip code residents lived in the same house 1 year ago. Out of people who lived in different houses, 93% moved from this county.
Private vs. public school enrollment:
Students in private schools in grades 1 to 8 (elementary and middle school):
Here:
0.0%
Minnesota:
12.9%
Students in private schools in grades 9 to 12 (high school):
Here:
0.0%
Minnesota:
8.6%
Students in private undergraduate colleges:
Here:
0.0%
Minnesota:
26.2%
Occupation by median earnings in the past 12 months ($)
116,177Installation, maintenance, and repair occupations
81,401Production occupations
80,453Construction and extraction occupations
71,856Health technologists and technicians
66,648Office and administrative support occupations
57,546Education, training, and library occupations
Top industries in this zip code by the number of employees in 2005:
Accommodation and Food Services: Full-Service Restaurants (10-19 employees: 1 establishment)
Construction: New Single-Family Housing Construction (except Operative Builders) (5-9: 1)
Other Services (except Public Administration): Other Automotive Mechanical and Electrical Repair and Maintenance (1-4: 1)
Accommodation and Food Services: Drinking Places (Alcoholic Beverages) (1-4: 1)
Home Mortgage Disclosure Act Aggregated Statistics For Year 2009 (Based on 2 partial tracts)
A) FHA, FSA/RHS & VA Home Purchase Loans
B) Conventional Home Purchase Loans
C) Refinancings
D) Home Improvement Loans
F) Non-occupant Loans on < 5 Family Dwellings (A B C & D)
G) Loans On Manufactured Home Dwelling (A B C & D)
Number
Average Value
Number
Average Value
Number
Average Value
Number
Average Value
Number
Average Value
Number
Average Value
LOANS ORIGINATED
1
$196,950
4
$204,848
23
$143,936
2
$76,635
7
$160,847
1
$86,970
APPLICATIONS APPROVED, NOT ACCEPTED
0
$0
1
$78,590
1
$170,820
0
$0
0
$0
0
$0
APPLICATIONS DENIED
1
$108,420
1
$206,510
7
$159,844
2
$67,375
2
$93,700
0
$0
APPLICATIONS WITHDRAWN
0
$0
0
$0
4
$143,862
0
$0
0
$0
0
$0
FILES CLOSED FOR INCOMPLETENESS
0
$0
0
$0
1
$158,730
1
$52,450
1
$84,240
0
$0
Aggregated Statistics For Year 2008 (Based on 2 partial tracts)
A) FHA, FSA/RHS & VA Home Purchase Loans
B) Conventional Home Purchase Loans
C) Refinancings
D) Home Improvement Loans
F) Non-occupant Loans on < 5 Family Dwellings (A B C & D)
G) Loans On Manufactured Home Dwelling (A B C & D)
Number
Average Value
Number
Average Value
Number
Average Value
Number
Average Value
Number
Average Value
Number
Average Value
LOANS ORIGINATED
1
$125,780
6
$173,453
14
$142,309
3
$37,637
5
$161,304
1
$66,300
APPLICATIONS APPROVED, NOT ACCEPTED
0
$0
1
$153,080
1
$83,660
1
$57,140
0
$0
0
$0
APPLICATIONS DENIED
0
$0
1
$166,530
6
$134,388
2
$37,440
2
$90,970
0
$0
APPLICATIONS WITHDRAWN
0
$0
1
$91,650
2
$180,670
1
$87,750
1
$91,650
0
$0
FILES CLOSED FOR INCOMPLETENESS
0
$0
0
$0
1
$102,380
0
$0
0
$0
0
$0
Aggregated Statistics For Year 2007 (Based on 2 partial tracts)
B) Conventional Home Purchase Loans
C) Refinancings
D) Home Improvement Loans
F) Non-occupant Loans on < 5 Family Dwellings (A B C & D)
G) Loans On Manufactured Home Dwelling (A B C & D)
Number
Average Value
Number
Average Value
Number
Average Value
Number
Average Value
Number
Average Value
LOANS ORIGINATED
8
$139,864
13
$150,855
4
$65,668
5
$165,010
1
$113,100
APPLICATIONS APPROVED, NOT ACCEPTED
1
$93,990
4
$123,142
0
$0
1
$103,740
0
$0
APPLICATIONS DENIED
2
$162,925
10
$150,638
2
$84,045
2
$88,045
1
$186,030
APPLICATIONS WITHDRAWN
2
$115,540
4
$134,795
0
$0
1
$86,780
0
$0
FILES CLOSED FOR INCOMPLETENESS
0
$0
2
$144,690
0
$0
0
$0
0
$0
Aggregated Statistics For Year 2006 (Based on 2 partial tracts)
A) FHA, FSA/RHS & VA Home Purchase Loans
B) Conventional Home Purchase Loans
C) Refinancings
D) Home Improvement Loans
F) Non-occupant Loans on < 5 Family Dwellings (A B C & D)
G) Loans On Manufactured Home Dwelling (A B C & D)
Number
Average Value
Number
Average Value
Number
Average Value
Number
Average Value
Number
Average Value
Number
Average Value
LOANS ORIGINATED
1
$107,450
11
$141,056
17
$133,484
6
$54,893
9
$125,862
1
$44,850
APPLICATIONS APPROVED, NOT ACCEPTED
0
$0
1
$162,830
3
$73,777
1
$30,420
0
$0
0
$0
APPLICATIONS DENIED
0
$0
3
$102,503
9
$132,513
1
$84,830
2
$95,065
1
$53,630
APPLICATIONS WITHDRAWN
0
$0
1
$91,840
5
$124,254
1
$35,690
0
$0
0
$0
FILES CLOSED FOR INCOMPLETENESS
0
$0
0
$0
2
$119,925
0
$0
0
$0
0
$0
Aggregated Statistics For Year 2005 (Based on 2 partial tracts)
B) Conventional Home Purchase Loans
C) Refinancings
D) Home Improvement Loans
F) Non-occupant Loans on < 5 Family Dwellings (A B C & D)
G) Loans On Manufactured Home Dwelling (A B C & D)
Number
Average Value
Number
Average Value
Number
Average Value
Number
Average Value
Number
Average Value
LOANS ORIGINATED
10
$135,759
21
$120,278
6
$42,575
6
$124,053
2
$74,785
APPLICATIONS APPROVED, NOT ACCEPTED
1
$182,910
4
$115,880
0
$0
0
$0
0
$0
APPLICATIONS DENIED
2
$107,545
8
$150,224
2
$57,525
2
$94,480
0
$0
APPLICATIONS WITHDRAWN
1
$256,820
7
$129,841
0
$0
0
$0
1
$60,650
FILES CLOSED FOR INCOMPLETENESS
1
$160,290
2
$143,035
0
$0
0
$0
0
$0
Aggregated Statistics For Year 2004 (Based on 2 partial tracts)
B) Conventional Home Purchase Loans
C) Refinancings
D) Home Improvement Loans
F) Non-occupant Loans on < 5 Family Dwellings (A B C & D)
G) Loans On Manufactured Home Dwelling (A B C & D)
Number
Average Value
Number
Average Value
Number
Average Value
Number
Average Value
Number
Average Value
LOANS ORIGINATED
10
$155,337
19
$99,696
4
$26,618
7
$135,051
1
$81,900
APPLICATIONS APPROVED, NOT ACCEPTED
2
$146,835
2
$82,195
1
$63,960
0
$0
0
$0
APPLICATIONS DENIED
2
$195,390
7
$122,711
2
$30,420
1
$100,040
1
$45,830
APPLICATIONS WITHDRAWN
0
$0
8
$118,999
1
$46,410
0
$0
1
$96,920
FILES CLOSED FOR INCOMPLETENESS
0
$0
1
$85,610
0
$0
0
$0
0
$0
Aggregated Statistics For Year 2003 (Based on 2 partial tracts)
A) FHA, FSA/RHS & VA Home Purchase Loans
B) Conventional Home Purchase Loans
C) Refinancings
D) Home Improvement Loans
F) Non-occupant Loans on < 5 Family Dwellings (A B C & D)


 Nearest zip codes: 55705, 55750, 55741, 55602, 55724, 55766.


