Estimated zip code population in 2022: 1,315 Zip code population in 2010: 1,209 Zip code population in 2000: 963
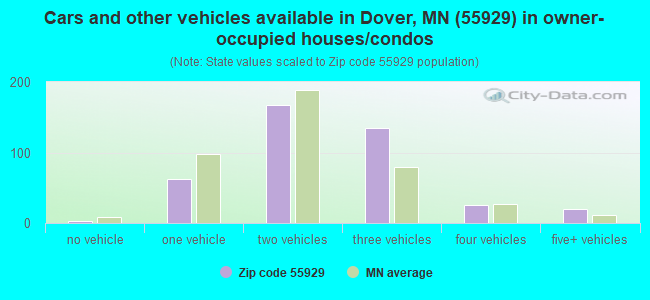
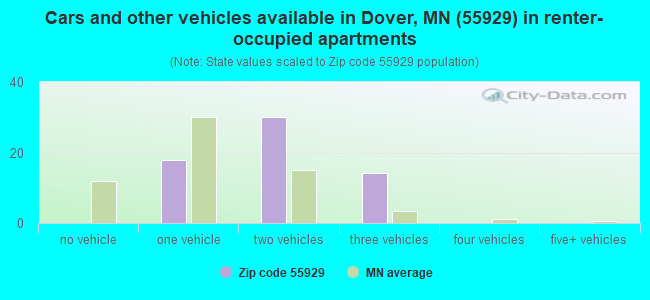
Houses and condos: 527 Renter-occupied apartments: 63
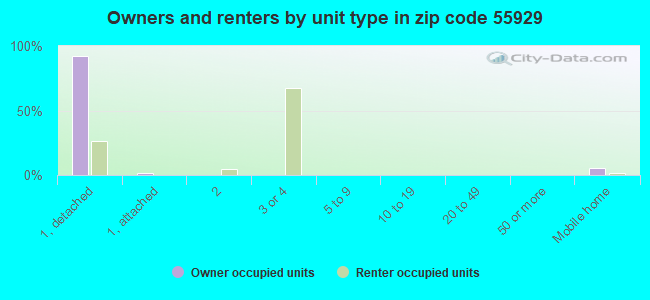
% of renters here:
13%
State:
28%
March 2022 cost of living index in zip code 55929: 86.1 (less than average, U.S. average is 100)
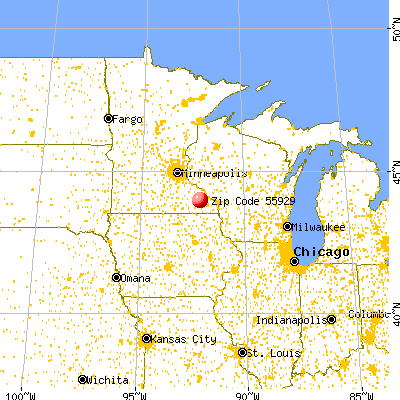
Land area: 46.3 sq. mi. Water area: 0.0 sq. mi.
Population density: 28 people per square mile
(very low).
OSM Map
General Map
Google Map
MSN Map
OSM Map
General Map
Google Map
MSN Map
OSM Map
General Map
Google Map
MSN Map
OSM Map
General Map
Google Map
MSN Map
Please wait while loading the map...
Real estate property taxes paid for housing units in 2022:
This zip code:
1.1% ($3,231)
Minnesota:
1.0% ($3,087)
Median real estate property taxes paid for housing units with mortgages in 2022: $3,227 (1.1%) Median real estate property taxes paid for housing units with no mortgage in 2022: $3,185 (1.3%)
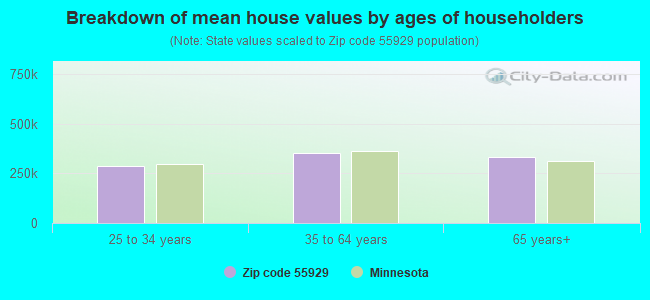
Estimated median house/condo value in 2022: $293,320
55929:
$293,320
Minnesota:
$314,600
Median resident age:
This zip code:
38.1 years
Minnesota median age:
39.0 years
Average household size:
This zip code:
2.7 people
Minnesota:
2.4 people
Averages for the 2020 tax year for zip code 55929, filed in 2021:
Average Adjusted Gross Income (AGI) in 2020: $75,400 (Individual Income Tax Returns)
Here:
$75,400
State:
$82,178
Salary/wage: $65,239 (reported on 89.5% of returns)
Here:
$65,239
State:
$67,438
(% of AGI for various income ranges: 1342.9% for AGIs below $25k, 4137.8% for AGIs $25k-50k, 6496.3% for AGIs $50k-75k, 9304.0% for AGIs $75k-100k, 16774.4% for AGIs $100k-200k)
Taxable interest for individuals: $878 (reported on 40.4% of returns)
This zip code:
$878
Minnesota:
$1,814
(% of AGI for various income ranges: 14.3% for AGIs below $25k, 30.0% for AGIs $25k-50k, 46.2% for AGIs $50k-75k, 56.0% for AGIs $75k-100k, 111.1% for AGIs $100k-200k)
Ordinary dividends: $930 (reported on 17.5% of returns)
Here:
$930
State:
$6,928
(% of AGI for various income ranges: 82.5% for AGIs $50k-75k, 30.0% for AGIs $100k-200k)
Net capital gain/loss in AGI: +$10,973 (reported on 19.3% of returns)
Here:
+$10,973
State:
+$20,591
(% of AGI for various income ranges: 62.9% for AGIs below $25k, 188.8% for AGIs $50k-75k, 1124.4% for AGIs $100k-200k)
Profit/loss from business: +$11,667 (reported on 10.5% of returns)
Here:
+$11,667
State:
+$14,342
(% of AGI for various income ranges: 627.8% for AGIs $25k-50k, 150.0% for AGIs $100k-200k)
Taxable individual retirement arrangement distribution: $6,860 (reported on 8.8% of returns)
55929:
$6,860
Minnesota:
$20,675
(% of AGI for various income ranges: 220.0% for AGIs below $25k, 236.2% for AGIs $50k-75k)
Total itemized deductions: $20,900 (reported on 7.0% of returns)
Here:
$20,900
State:
$33,311
(% of AGI for various income ranges: 1672.0% for AGIs $75k-100k)
Taxes paid: $6,700 (reported on 7.0% of returns)
55929:
$6,700
State:
$8,252
(% of AGI for various income ranges: 536.0% for AGIs $75k-100k)
Earned income credit: $1,560 (reported on 8.8% of returns)
Here:
$1,560
State:
$2,055
(% of AGI for various income ranges: 86.7% for AGIs $25k-50k)
Percentage of individuals using paid preparers for their 2020 taxes: 98.2%
Here:
98%
State:
94%
(% for various income ranges: 91.7% for AGIs below $25k, 100.0% for AGIs $25k-50k, 100.0% for AGIs $50k-75k, 100.0% for AGIs $75k-100k, 100.0% for AGIs $100k-200k, 100.0% for AGIs over 200k)
Averages for the 2012 tax year for zip code 55929, filed in 2013:
Average Adjusted Gross Income (AGI) in 2012: $54,174 (Individual Income Tax Returns)
Here:
$54,174
State:
$67,192
Salary/wage: $48,206 (reported on 91.2% of returns)
Here:
$48,206
State:
$55,182
(% of AGI for various income ranges: 78.3% for AGIs below $25k, 79.1% for AGIs $25k-50k, 84.8% for AGIs $50k-75k, 86.5% for AGIs $75k-100k, 77.1% for AGIs $100k-200k)
Taxable interest for individuals: $669 (reported on 45.6% of returns)
This zip code:
$669
Minnesota:
$1,664
(% of AGI for various income ranges: 0.7% for AGIs below $25k, 0.5% for AGIs $25k-50k, 0.8% for AGIs $50k-75k, 0.5% for AGIs $75k-100k, 0.4% for AGIs $100k-200k)
Ordinary dividends: $638 (reported on 14.0% of returns)
Here:
$638
State:
$5,665
(% of AGI for various income ranges: 0.9% for AGIs below $25k, 0.3% for AGIs $50k-75k, 0.1% for AGIs $75k-100k)
Net capital gain/loss in AGI: +$2,300 (reported on 12.3% of returns)
Here:
+$2,300
State:
+$16,131
Profit/loss from business: +$8,088 (reported on 14.0% of returns)
Here:
+$8,088
State:
+$12,430
Taxable individual retirement arrangement distribution: $6,833 (reported on 5.3% of returns)
55929:
$6,833
Minnesota:
$15,212
Total itemized deductions: $17,785 (23% of AGI, reported on 35.1% of returns)
Here:
$17,785
State:
$24,665
Here:
22.8% of AGI
State:
19.6% of AGI
(% of AGI for various income ranges: 11.8% for AGIs $25k-50k, 11.0% for AGIs $50k-75k, 13.1% for AGIs $75k-100k, 13.2% for AGIs $100k-200k)
Charity contributions: $1,606 (reported on 28.1% of returns)
Here:
$1,606
State:
$3,948
(% of AGI for various income ranges: 0.5% for AGIs $25k-50k, 0.8% for AGIs $50k-75k, 1.0% for AGIs $75k-100k, 1.1% for AGIs $100k-200k)
Taxes paid: $6,445 (reported on 35.1% of returns)
55929:
$6,445
State:
$10,589
(% of AGI for various income ranges: 2.9% for AGIs $25k-50k, 3.7% for AGIs $50k-75k, 4.4% for AGIs $75k-100k, 5.8% for AGIs $100k-200k)
Earned income credit: $1,825 (reported on 14.0% of returns)
Here:
$1,825
State:
$2,037
(% of AGI for various income ranges: 4.6% for AGIs below $25k, 0.9% for AGIs $25k-50k)
Percentage of individuals using paid preparers for their 2012 taxes: 64.9%
Here:
65%
State:
55%
(% for various income ranges: 58.8% for AGIs below $25k, 57.1% for AGIs $25k-50k, 72.7% for AGIs $50k-75k, 71.4% for AGIs $75k-100k, 75.0% for AGIs $100k-200k)
Averages for the 2004 tax year for zip code 55929, filed in 2005:
Average Adjusted Gross Income (AGI) in 2004: $43,780 (Individual Income Tax Returns)
Here:
$43,780
State:
$53,560
Salary/wage: $39,714 (reported on 90.2% of returns)
Here:
$39,714
State:
$46,177
(% of AGI for various income ranges: 115.9% for AGIs below $10k, 76.2% for AGIs $10k-25k, 83.2% for AGIs $25k-50k, 86.3% for AGIs $50k-75k, 89.4% for AGIs $75k-100k, 60.3% for AGIs over 100k)
Taxable interest for individuals: $716 (reported on 51.8% of returns)
This zip code:
$716
Minnesota:
$1,796
(% of AGI for various income ranges: 0.6% for AGIs $10k-25k, 1.0% for AGIs $25k-50k, 0.8% for AGIs $50k-75k, 0.4% for AGIs $75k-100k, 1.9% for AGIs over 100k)
Taxable dividends: $221 (reported on 18.3% of returns)
Here:
$221
State:
$3,096
(% of AGI for various income ranges: 0.1% for AGIs $10k-25k, 0.1% for AGIs $25k-50k, 0.1% for AGIs $50k-75k, 0.1% for AGIs $75k-100k)
Net capital gain/loss: +$859 (reported on 16.6% of returns)
Here:
+$859
State:
+$10,864
(% of AGI for various income ranges: 0.7% for AGIs $10k-25k, 0.1% for AGIs $25k-50k, 0.6% for AGIs $50k-75k, 0.5% for AGIs over 100k)
Profit/loss from business: +$9,750 (reported on 13.6% of returns)
Here:
+$9,750
State:
+$10,442
Total itemized deductions: $14,413 (23% of AGI, reported on 38.2% of returns)
Here:
$14,413
State:
$20,035
Here:
23.2% of AGI
State:
21.3% of AGI
(% of AGI for various income ranges: 7.1% for AGIs $10k-25k, 11.3% for AGIs $25k-50k, 13.8% for AGIs $50k-75k, 15.8% for AGIs $75k-100k, 11.7% for AGIs over 100k)
Charity contributions deductions: $1,206 (2% of AGI, reported on 30.1% of returns)
Here:
$1,206
State:
$3,333
Here:
1.8% of AGI
State:
3.4% of AGI
(% of AGI for various income ranges: 0.7% for AGIs $25k-50k, 1.2% for AGIs $50k-75k, 1.1% for AGIs $75k-100k, 0.6% for AGIs over 100k)
Total tax: $4,585 (reported on 84.2% of returns)
55929:
$4,585
State:
$8,485
(% of AGI for various income ranges: 3.2% for AGIs below $10k, 5.2% for AGIs $10k-25k, 7.4% for AGIs $25k-50k, 7.8% for AGIs $50k-75k, 8.7% for AGIs $75k-100k, 17.3% for AGIs over 100k)
Earned income credit: $1,638 (reported on 10.0% of returns)
Here:
$1,638
State:
$1,523
Percentage of individuals using paid preparers for their 2004 taxes: 72.1%
Here:
72%
State:
59%
(% for various income ranges: 50.0% for AGIs below $10k, 70.5% for AGIs $10k-25k, 70.1% for AGIs $25k-50k, 79.6% for AGIs $50k-75k, 78.4% for AGIs $75k-100k, 83.3% for AGIs over 100k)
Household received Food Stamps/SNAP in the past 12 months: 18 Household did not receive Food Stamps/SNAP in the past 12 months: 461
Women who had a birth in the past 12 months: 11 (11 now married, 0 unmarried) Women who did not have a birth in the past 12 months: 310 (165 now married, 144 unmarried)
Housing units in zip code 55929 with a mortgage: 278 (29 second mortgage, 28 both second mortgage and home equity loan) Median monthly owner costs for units with a mortgage: $1,760 Median monthly owner costs for units without a mortgage: $665
Residents with income below the poverty level in 2022:
This zip code:
3.8%
Whole state:
9.6%
Residents with income below 50% of the poverty level in 2022:
This zip code:
1.0%
Whole state:
5.2%
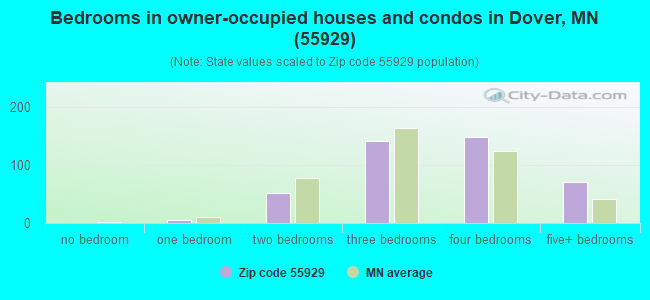
Median number of rooms in houses and condos:
Here:
7.9
State:
7.1
Median number of rooms in apartments:
Here:
4.1
State:
3.8
Notable locations in this zip code not listed on our city pages
Size of family households: 158 2-persons, 49 3-persons, 108 4-persons, 35 5-persons, 8 6-persons, 15 7-or-more-persons
Size of nonfamily households: 88 1-person, 11 2-persons, 1 3-persons
358 married couples with children.
49 single-parent households (9 men, 40 women).
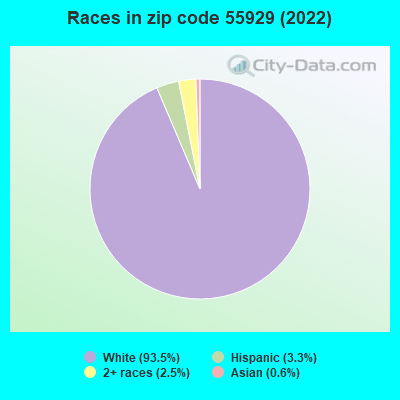
96.9% of residents of 55929 zip code speak English at home.
1.9% of residents speak Spanish at home (100% very well).
0.5% of residents speak Asian or Pacific Island language at home (17% very well, 83% not well).
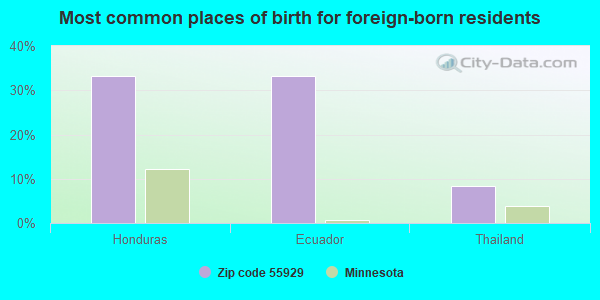
Foreign born population: 12 (1.0%) (76.0% of them are naturalized citizens)
This zip code:
1.0%
Whole state:
8.7%
33%Honduras
33%Ecuador
8%Thailand
34%German
28%American
10%Norwegian
9%Irish
5%European
2%Polish
2%English
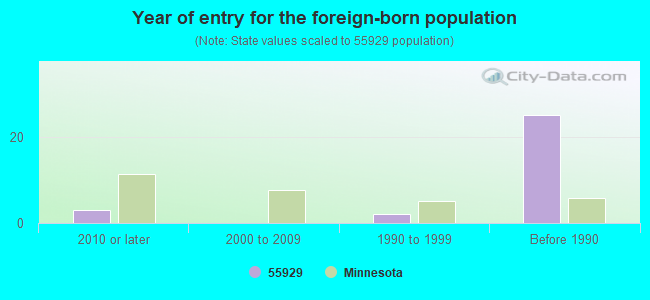
Year of entry for the foreign-born population
32010 or later
02000 to 2009
21990 to 1999
25Before 1990
Facilities with environmental interests located in this zip code:
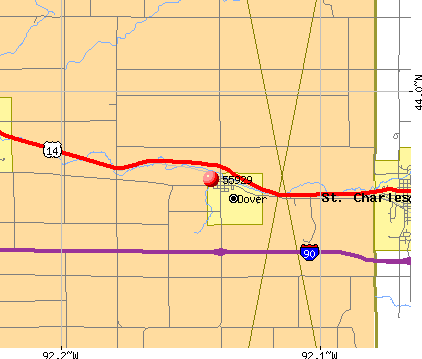
CF WELDING (1734 COUNTY ROAD 142 SE in DOVER, MN)
STATE MASTER (Minnesota Pollution Control Agency permits and compilance tracking) - RCRAINFO-MNR000032003, CESQG, RCRIS-MNR000032003, Conditionally Exempt Small Quantity Generators, less than 100 kg/month of hazardous waste (Resource Conservation and Recovery Act (tracking hazardous waste)) - notification Business SIC classification: WELDING REPAIR Business NAICS classification: COMMERCIAL AND INDUSTRIAL MACHINERY AND EQUIPMENT (EXCEPT AUTOMOTIVE AND ELECTRONIC) REPAIR AND MAINTENANCE. Organizations: FERGUSON GORDON (CONTACT/OWNER)
EVS BODY SHOP (112 E ELM in DOVER, MN)
STATE MASTER (Minnesota Pollution Control Agency permits and compilance tracking) - RCRAINFO-MND985705946, CESQG, RCRIS-MND985705946, Conditionally Exempt Small Quantity Generators, less than 100 kg/month of hazardous waste (Resource Conservation and Recovery Act (tracking hazardous waste)) - notification Business SIC classification: TOP, BODY, AND UPHOLSTERY REPAIR SHOPS AND PAINT SHOPS Business NAICS classification: AUTOMOTIVE BODY, PAINT, AND INTERIOR REPAIR AND MAINTENANCE. Organizations: MAYER EVERETT (CONTACT/OWNER)
, EV S BODY SHOP (CONTACT/OWNER)
OLMSTED CNTY HWY DEPT (E ELM ST in DOVER, MN)
Conditionally Exempt Small Quantity Generators, less than 100 kg/month of hazardous waste (Resource Conservation and Recovery Act (tracking hazardous waste)) - notification
Housing units lacking complete plumbing facilities: 4.3% Housing units lacking complete kitchen facilities: 2.6%
49.9%Utility gas
30.5%Bottled, tank, or LP gas
10.1%Electricity
8.6%Wood
0.6%Fuel oil, kerosene, etc.
Population in 1990: 1,265.
Place of birth for U.S.-born residents:
This state: 1,020
Northeast: 6
Midwest: 156
South: 71
West: 24
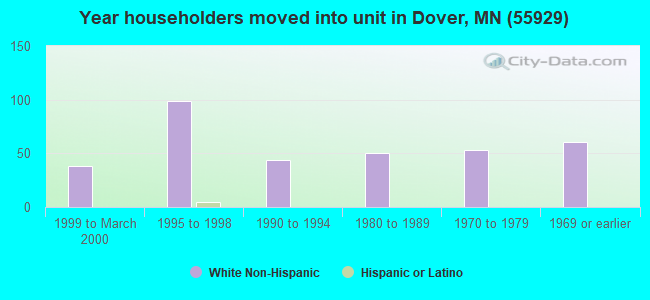
64% of the 55929 zip code residents lived in the same house 5 years ago. Out of people who lived in different houses, 67% lived in this county. Out of people who lived in different counties, 50% lived in Minnesota.
98% of the 55929 zip code residents lived in the same house 1 year ago. Out of people who lived in different houses, 79% moved from this county. Out of people who lived in different houses, 11% moved from different county within same state. Out of people who lived in different houses, 16% moved from different state.
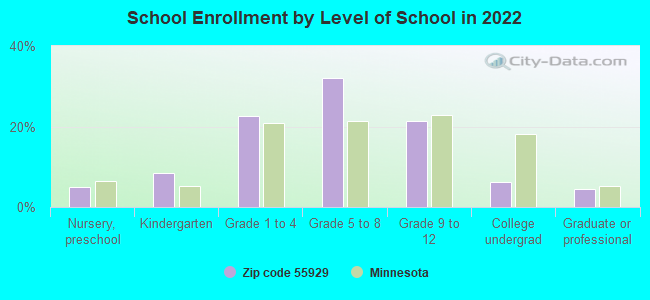
Private vs. public school enrollment:
Students in private schools in grades 1 to 8 (elementary and middle school):
Here:
0.0%
Minnesota:
12.9%
Students in private schools in grades 9 to 12 (high school): 9
Here:
12.0%
Minnesota:
8.6%
Students in private undergraduate colleges: 3
Here:
12.9%
Minnesota:
26.2%
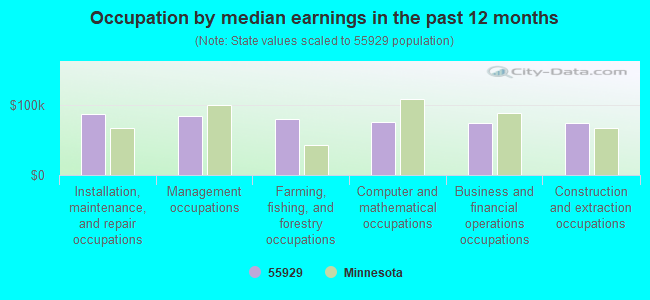
Occupation by median earnings in the past 12 months ($)
86,784Installation, maintenance, and repair occupations
83,549Management occupations
79,523Farming, fishing, and forestry occupations
75,639Computer and mathematical occupations
73,971Business and financial operations occupations
73,656Construction and extraction occupations
Top industries in this zip code by the number of employees in 2005:
Wholesale Trade: Other Grocery and Related Products Merchant Wholesalers (10-19 employees: 1 establishment)
Construction: New Single-Family Housing Construction (except Operative Builders) (5-9: 1, 1-4: 3)
Educational Services: Elementary and Secondary Schools (5-9: 1)
Other Services (except Public Administration): Civic and Social Organizations (5-9: 1)
Other Services (except Public Administration): Commercial and Industrial Machinery and Equipment (except Automotive and Electronic) Repair and Maintenance (5-9: 1)
Administrative and Support and Waste Management and Remediation Services: All Other Support Services (1-4: 1)
Other Services (except Public Administration): Automotive Body, Paint, and Interior Repair and Maintenance (1-4: 1)
Professional, Scientific, and Technical Services: All Other Professional, Scientific, and Technical Services (1-4: 1)
Fatal accident statistics in 2013:
Fatal accident count: 1
Vehicles involved in fatal accidents: 2
Fatal accidents caused by drunken drivers: 0
Fatalities: 2
Persons involved in fatal accidents: 4
Pedestrians involved in fatal accidents: 0
Home Mortgage Disclosure Act Aggregated Statistics For Year 2009 (Based on 2 partial tracts)
A) FHA, FSA/RHS & VA Home Purchase Loans
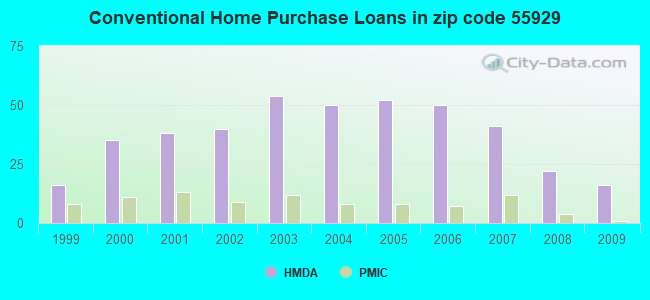
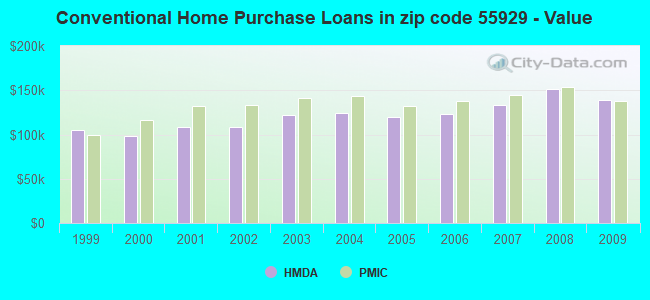
B) Conventional Home Purchase Loans
C) Refinancings
D) Home Improvement Loans
F) Non-occupant Loans on < 5 Family Dwellings (A B C & D)
G) Loans On Manufactured Home Dwelling (A B C & D)
Number
Average Value
Number
Average Value
Number
Average Value
Number
Average Value
Number
Average Value
Number
Average Value
LOANS ORIGINATED
14
$126,887
16
$138,539
106
$160,232
7
$47,213
4
$155,208
4
$104,475
APPLICATIONS APPROVED, NOT ACCEPTED
0
$0
0
$0
8
$123,876
1
$23,640
0
$0
0
$0
APPLICATIONS DENIED
2
$119,080
3
$155,357
23
$159,144
2
$114,175
0
$0
2
$71,135
APPLICATIONS WITHDRAWN
0
$0
5
$174,386
15
$159,787
1
$69,130
0
$0
0
$0
FILES CLOSED FOR INCOMPLETENESS
0
$0
1
$127,110
5
$165,734
0
$0
0
$0
0
$0
Aggregated Statistics For Year 2008 (Based on 2 partial tracts)
A) FHA, FSA/RHS & VA Home Purchase Loans
B) Conventional Home Purchase Loans
C) Refinancings
D) Home Improvement Loans
F) Non-occupant Loans on < 5 Family Dwellings (A B C & D)
G) Loans On Manufactured Home Dwelling (A B C & D)
Number
Average Value
Number
Average Value
Number
Average Value
Number
Average Value
Number
Average Value
Number
Average Value
LOANS ORIGINATED
5
$171,888
22
$150,870
62
$153,223
8
$28,544
3
$41,923
2
$22,300
APPLICATIONS APPROVED, NOT ACCEPTED
0
$0
1
$272,060
5
$174,386
0
$0
0
$0
0
$0
APPLICATIONS DENIED
2
$138,260
1
$164,570
17
$165,859
2
$100,795
0
$0
0
$0
APPLICATIONS WITHDRAWN
0
$0
1
$395,600
13
$166,015
2
$144,505
0
$0
0
$0
FILES CLOSED FOR INCOMPLETENESS
0
$0
0
$0
2
$116,850
0
$0
0
$0
0
$0
Aggregated Statistics For Year 2007 (Based on 2 partial tracts)
A) FHA, FSA/RHS & VA Home Purchase Loans
B) Conventional Home Purchase Loans
C) Refinancings
D) Home Improvement Loans
F) Non-occupant Loans on < 5 Family Dwellings (A B C & D)
G) Loans On Manufactured Home Dwelling (A B C & D)
Number
Average Value
Number
Average Value
Number
Average Value
Number
Average Value
Number
Average Value
Number
Average Value
LOANS ORIGINATED
6
$118,710
41
$133,321
54
$140,399
16
$28,321
4
$65,450
1
$28,990
APPLICATIONS APPROVED, NOT ACCEPTED
0
$0
4
$99,012
6
$126,887
1
$69,580
0
$0
0
$0
APPLICATIONS DENIED
1
$63,330
6
$158,553
26
$152,258
7
$73,080
0
$0
1
$33,450
APPLICATIONS WITHDRAWN
0
$0
5
$234,774
15
$136,565
1
$27,210
0
$0
0
$0
FILES CLOSED FOR INCOMPLETENESS
0
$0
0
$0
4
$118,525
0
$0
0
$0
0
$0
Aggregated Statistics For Year 2006 (Based on 2 partial tracts)
A) FHA, FSA/RHS & VA Home Purchase Loans
B) Conventional Home Purchase Loans
C) Refinancings
D) Home Improvement Loans
F) Non-occupant Loans on < 5 Family Dwellings (A B C & D)
G) Loans On Manufactured Home Dwelling (A B C & D)
Number
Average Value
Number
Average Value
Number
Average Value
Number
Average Value
Number
Average Value
Number
Average Value
LOANS ORIGINATED
8
$135,751
50
$123,551
59
$115,960
17
$28,151
5
$123,186
3
$66,603
APPLICATIONS APPROVED, NOT ACCEPTED
1
$81,170
3
$119,230
6
$103,695
0
$0
0
$0
1
$38,800
APPLICATIONS DENIED
0
$0
8
$86,301
32
$122,998
5
$54,412
0
$0
2
$19,845
APPLICATIONS WITHDRAWN
0
$0
4
$161,118
25
$141,328
6
$49,060
1
$200,700
0
$0
FILES CLOSED FOR INCOMPLETENESS
0
$0
0
$0
7
$193,627
0
$0
0
$0
0
$0
Aggregated Statistics For Year 2005 (Based on 2 partial tracts)
A) FHA, FSA/RHS & VA Home Purchase Loans
B) Conventional Home Purchase Loans
C) Refinancings
D) Home Improvement Loans
F) Non-occupant Loans on < 5 Family Dwellings (A B C & D)
G) Loans On Manufactured Home Dwelling (A B C & D)
Number
Average Value
Number
Average Value
Number
Average Value
Number
Average Value
Number
Average Value
Number
Average Value
LOANS ORIGINATED
9
$151,392
52
$120,163
81
$124,181
14
$41,574
8
$94,886
2
$29,880
APPLICATIONS APPROVED, NOT ACCEPTED
0
$0
7
$99,521
8
$133,186
1
$36,130
0
$0
0
$0
APPLICATIONS DENIED
1
$136,480
6
$110,088
45
$142,304
8
$67,401
1
$116,850
2
$116,850
APPLICATIONS WITHDRAWN
0
$0
5
$171,978
37
$152,665
3
$100,797
1
$119,080
1
$111,050
FILES CLOSED FOR INCOMPLETENESS
0
$0
0
$0
5
$166,268
0
$0
0
$0
0
$0
Aggregated Statistics For Year 2004 (Based on 2 partial tracts)
A) FHA, FSA/RHS & VA Home Purchase Loans
B) Conventional Home Purchase Loans
C) Refinancings
D) Home Improvement Loans
F) Non-occupant Loans on < 5 Family Dwellings (A B C & D)
G) Loans On Manufactured Home Dwelling (A B C & D)
Number
Average Value
Number
Average Value
Number
Average Value
Number
Average Value
Number
Average Value
Number
Average Value
LOANS ORIGINATED
12
$126,924
50
$124,015
82
$123,678
14
$25,964
3
$59,170
4
$28,545
APPLICATIONS APPROVED, NOT ACCEPTED
0
$0
1
$146,730
11
$100,877
0
$0
0
$0
0
$0
APPLICATIONS DENIED
0
$0
9
$105,702
29
$128,387
6
$63,703
0
$0
5
$40,318
APPLICATIONS WITHDRAWN
0
$0
4
$191,892
27
$139,003
3
$55,303
1
$140,490
0
$0
FILES CLOSED FOR INCOMPLETENESS
0
$0
0
$0
13
$145,122
1
$130,230
0
$0
0
$0
Aggregated Statistics For Year 2003 (Based on 2 partial tracts)
A) FHA, FSA/RHS & VA Home Purchase Loans
B) Conventional Home Purchase Loans
C) Refinancings
D) Home Improvement Loans
F) Non-occupant Loans on < 5 Family Dwellings (A B C & D)
Number
Average Value
Number
Average Value
Number
Average Value
Number
Average Value
Number
Average Value
LOANS ORIGINATED
12
$124,508
54
$121,841
169
$122,368
11
$27,368
4
$100,015
APPLICATIONS APPROVED, NOT ACCEPTED
0
$0
2
$100,350
9
$125,623
1
$35,230
0
$0
APPLICATIONS DENIED
1
$74,040
8
$94,664
45
$115,682
2
$49,060
0
$0
APPLICATIONS WITHDRAWN
0
$0
7
$95,954
37
$113,392
0
$0
1
$99,460
FILES CLOSED FOR INCOMPLETENESS
0
$0
0
$0
6
$109,270
0
$0
0
$0
Aggregated Statistics For Year 2002 (Based on 2 partial tracts)
A) FHA, FSA/RHS & VA Home Purchase Loans
B) Conventional Home Purchase Loans
C) Refinancings
D) Home Improvement Loans
F) Non-occupant Loans on < 5 Family Dwellings (A B C & D)
Number
Average Value
Number
Average Value
Number
Average Value
Number
Average Value
Number
Average Value
LOANS ORIGINATED
15
$121,223
40
$108,166
124
$115,841
12
$23,303
4
$69,910
APPLICATIONS APPROVED, NOT ACCEPTED
1
$95,890
4
$125,882
10
$108,155
0
$0
0
$0
APPLICATIONS DENIED
0
$0
4
$95,445
29
$93,583
4
$30,105
0
$0
APPLICATIONS WITHDRAWN
1
$106,590
4
$93,882
20
$112,280
0
$0
0
$0
FILES CLOSED FOR INCOMPLETENESS
0
$0
0
$0
11
$114,541
0
$0
0
$0
Aggregated Statistics For Year 2001 (Based on 2 partial tracts)
A) FHA, FSA/RHS & VA Home Purchase Loans
B) Conventional Home Purchase Loans
C) Refinancings
D) Home Improvement Loans
F) Non-occupant Loans on < 5 Family Dwellings (A B C & D)
Number
Average Value
Number
Average Value
Number
Average Value
Number
Average Value
Number
Average Value
LOANS ORIGINATED
14
$117,426
38
$108,965
137
$102,570
12
$19,810
4
$75,262
APPLICATIONS APPROVED, NOT ACCEPTED
0
$0
4
$169,035
6
$92,173
1
$24,530
0
$0
APPLICATIONS DENIED
0
$0
6
$67,792
35
$93,316
3
$17,690
0
$0
APPLICATIONS WITHDRAWN
0
$0
4
$92,100
17
$103,419
0
$0
0
$0
FILES CLOSED FOR INCOMPLETENESS
0
$0
0
$0
4
$100,572
0
$0
0
$0
Aggregated Statistics For Year 2000 (Based on 2 partial tracts)
A) FHA, FSA/RHS & VA Home Purchase Loans
B) Conventional Home Purchase Loans
C) Refinancings
D) Home Improvement Loans
F) Non-occupant Loans on < 5 Family Dwellings (A B C & D)
Number
Average Value
Number
Average Value
Number
Average Value
Number
Average Value
Number
Average Value
LOANS ORIGINATED
6
$109,717
35
$98,706
25
$71,860
9
$15,808
1
$61,990
APPLICATIONS APPROVED, NOT ACCEPTED
0
$0
4
$90,650
6
$71,212
2
$13,605
0
$0
APPLICATIONS DENIED
1
$148,070
12
$55,304
19
$65,937
4
$20,405
0
$0
APPLICATIONS WITHDRAWN
0
$0
10
$93,125
16
$74,594
0
$0
0
$0
FILES CLOSED FOR INCOMPLETENESS
0
$0
0
$0
3
$69,873
0
$0
0
$0
Aggregated Statistics For Year 1999 (Based on 1 partial tract)
A) FHA, FSA/RHS & VA Home Purchase Loans
B) Conventional Home Purchase Loans
C) Refinancings
D) Home Improvement Loans
F) Non-occupant Loans on < 5 Family Dwellings (A B C & D)
Detailed PMIC statistics for the following Tracts:0020.00
2002 - 2018 National Fire Incident Reporting System (NFIRS) incidents
According to the data from the years 2002 - 2018 the average number of fires per year is 6. The highest number of reported fires - 11 took place in 2012, and the least - 3 in 2006. The data has a constant trend.
When looking into fire subcategories, the most incidents belonged to: Outside Fires (39.8%), and Mobile Property/Vehicle Fires (28.7%).
Fire incident types reported to NFIRS in Zip Code 55929


 Nearest zip codes: 55972, 55934, 55923, 55964, 55979, 55935.


 According to the data from the years 2002 - 2018 the average number of fires per year is 6. The highest number of reported fires - 11 took place in 2012, and the least - 3 in 2006. The data has a constant trend.
 When looking into fire subcategories, the most incidents belonged to: Outside Fires (39.8%), and Mobile Property/Vehicle Fires (28.7%).